Abstract
In the article, the application algorithms of neural network methods for determining the lithological composition of a well bore according to logging data are studied by training based on the analysis of the correspondence of logs to the available expert opinion. Specialized algorithms for processing the results of network operation have been developed to increase the information content of a signal produced by a neural network and to increase the reliability of recognition.
1. Introduction
The method for isolating reservoirs from geophysical data, which is represented as logs, is based on the following characteristic features of reservoirs: permeability – data obtained by apparent and effective resistances is used to isolate the collector; a reduced content of the surface-active plastic component of the solid phase is determined by resistance methods or by a complex analysis of the latter together with neutron, ultrasound, and gamma methods; increased porosity – for the separation of reservoirs having this feature, magnetometry and thermometry are used along with the listed methods of isotopes, potentials.
Using the information received from a geophysicist on the selected reservoirs from several wells, it is possible to reveal the patterns between the logging readings and the presence or absence of a reservoir.
Determination of the porosity and oil saturation coefficients is the next step in the geophysical study of oil wells after the separation of reservoirs. In carrying out this work, the geophysicist interpreter faces uncertainty and inconsistency in geophysical data, and a successful problem solution requires him/her to have a lot of experience in deciphering the logs. The use of artificial neural networks can greatly facilitate the work of geophysics and accelerate the process of interpreting new wells.
To determine the coefficient of porosity, the results of measurements obtained by resistance methods, potentials of intrinsic polarization, neutron scattering, scattered gamma radiation and ultrasound are used. In most cases, the porosity is calculated by the methods of resistance; neutron methods are used when the pore space of the rock is filled with water, oil or gas with a known hydrogen equivalent.
2. System model
In the work, the applicability of three types of neural networks (NN) for solving the problems of interpretation of well logging was studied as a multilayer unidirectional network, radial network (RBF), fuzzy network (TSK) [1, 2].
The combination of the principles of fuzzy inference and the neural network structure led to the creation of fuzzy NN. The article uses one of the variants of NN – fuzzy NN Takagi-Sugeno-Kanga (TSK) [3-5]. For the training, a data system representing a set of observable points was used. The data system is divided into two samples: training and testing. Unknown coefficients should be chosen in such a way that they ensure a minimum deviation of the values calculated in the network from the available ones, i.e. it would give a minimum of the target optimization function. The examined NSs were used to predict the porosity of the seam reservoir. The logging diagram (LD) of the selected reservoirs led to the network inputs, and the output signal corresponded to the porosity value for the entire formation. 8 exploratory wells of the Vyatka area participated in the experiment, to which decodings of geophysicists-interpreters were attached with the wells depth indication corresponding to collectors, total porosity coefficient (M3/M3, %) and saturation type. For oil-saturated reservoirs, the oil saturation coefficient was additionally indicated. The network input was given by 7 methods: BK, SP (intrinsic potentials), PZ (potential probe), GR, NGR, DT, IK (induction logging) [6].
The total number of training examples was 200, which half was used for training, the rest ones for testing the NA. To synthesize the architecture and teach the multilayer NA, the genetic algorithm of the BGA was applied. The model of a multilayer perceptron satisfies satisfactorily the prediction of porosity from the data of a complex of geophysical methods. It is determined that the problem of determining the porosity coefficient was better solved by the TSK network. A RMS prediction error on a test data set for a multilayer perceptron is 1,9 %, for a TSK network it is 1,6 %. Fig. 1 depicts the graphs of the dependences of the coefficient , produced by the NN, on the reference porosity coefficient .
Fig. 1Output graph of TS defining porosity
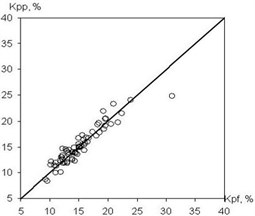
a) Learning set
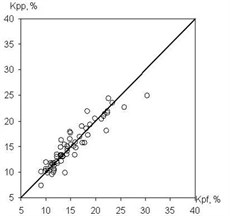
b) Test set
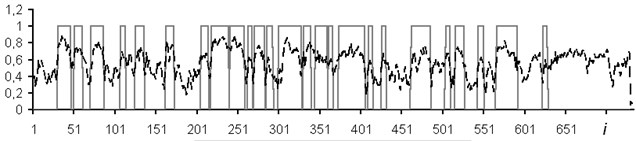
Fig. 2Separation of strata by neural network method
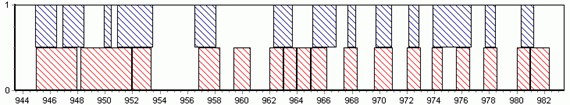
a) Well No. 13022
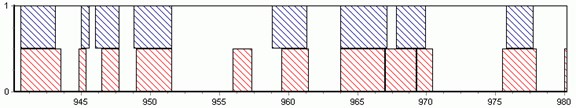
b) Well No. 13416
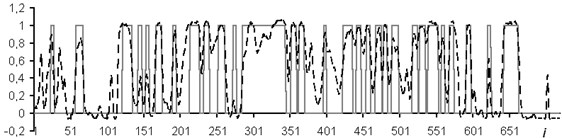
The neural network methods have also been used to separate the section into reservoirs. The method of reservoir separation according to LD is based on the following characteristic features of reservoirs: permeability; reduced content of the surface active plastic component of the solid phase; increased porosity. The network inputs were studied as per geophysical methods at each point of the well. At the output, one of two values were fixed – 1 (the layer is available) and 0 (the layer is unavailable). The higher quality of the partitioning, taking into account the fact that the boundaries of reservoir layers are blurred, was achieved by coding the output signals of the HC. For this purpose, a function defined by a parabola is inscribed in the layer.
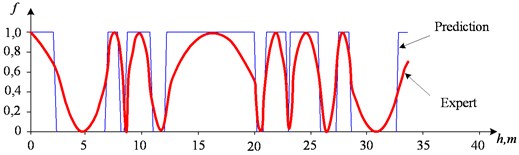
Fig. 3Result of operation of RBF network at well when allocating reservoirs: – training signal, – approximation of RBF
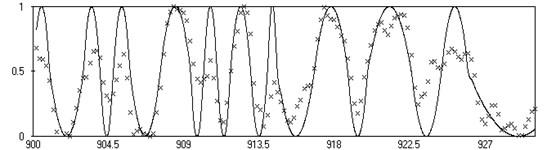
Thus, in the middle of the reservoir, the output value of the network is maximal and equal to 1. When studying the effectiveness of the method, geophysical data for wells of the Vyatka area with well-known interpretation of reservoir boundaries was taken for training the NN. The training sample contained about 2000 points. After training, the percentage of recognized points reached 80. The test was also made in other wells. The separation of the section into strata according to this procedure for two wells No. 13022 (Fig. 2(a)) and No. 13416 (Fig. 2(b)) is shown below. The predicted strata are shown by the upper right-angles. The lower rectangles correspond to the decoding data for the corresponding wells.
Using the information received from the geophysicist on the extracted reservoirs from several wells, the patterns between the logging readings and the presence or absence of the reservoir were revealed. The tasks of isolating reservoirs were solved with the use of all the types of NS considered. Fig. 3 shows the result of signal part approximation represented in the training well at a depth of 900 to 930 m by the radial RBF network. The method of neural network separation of geophysical wells showed a high processing speed of new wells and independence from measurement conditions.
3. Computational experiments
The paper describes experimental studies conducted on the digitized material of the Vyatka area wells. Before processing, LDs were normalized. The experiment involved 400 interpreted wells, which were divided into training (30 %) and test (70 %) sets. The purpose of the study was to test the applicability of multilayer NN for lithologic dismemberment of the borehole section and to assess the quality of the interpretation. The experiment was divided into five parts: teaching the NA without a data window for a group of methods; training of the NN with a data window on a group of methods; learning the NN without a data window for each method separately; training of the NN with a data window for each method separately; transition to accurate estimates and increased recognition reliability.
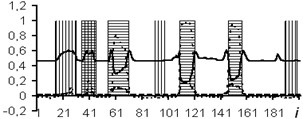
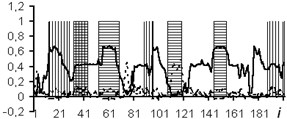
Fig. 4Network outcomes during reservoirs allocation
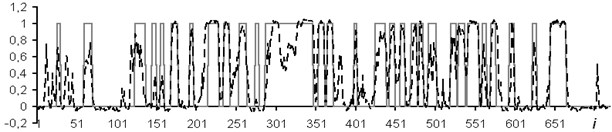
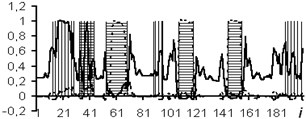
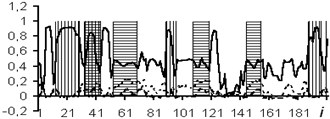
Fig. 5Network results during determination of type saturation
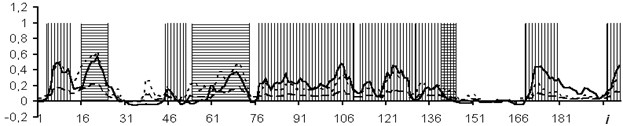
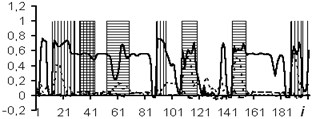
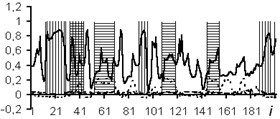
Fig. 6Network outcomes with data window of 3 counts
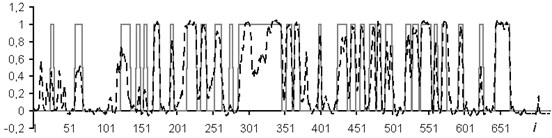
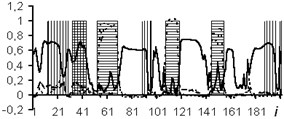
Fig. 7Network results with data window of 5 samples
In each part of the experiment, in addition to the transition to accurate estimates, separation of reservoirs into oil, water, oil-saturated reservoirs were made without prior allocation of reservoirs.
The following logging methods were chosen as input data: BK, well diameter (DS), DT, GR, NGR. This is explained by the fact that these methods are presented on all wells in the available set of logging methods. The size of the input layer of the NN was 5 neurons. In the course of the experiment, several NNs were built and trained for each variant of the task's formalization, and then one was selected from the resulting set, most accurately constructing the given mapping.
The usage of the data window allows the NN analyzing both the current values of the logging methods, and the curve behavior in the vicinity of the estimated depth. In the course of the experiment, windows of 3 and 5 depths were used. The dimensions of the input layers of the NN were 15 and 25 neurons, respectively. In Figs. 4-7: solid line – expert’s conclusion, dotted line network evaluation. The results of the experiment are shown in Fig. 6 for a window in 3 counts and in Fig. 7 for a window in 5 counts. The experiment results for one well in the separation of reservoir formations without the use of a data window are shown in Fig. 4. To determine the type of saturation, the result of network training without a data window is shown in Fig. 5.
It is established that the quality of interpretation increases when the data window is used. But at the same time, the dimension of the interpretive NN increases and, as a consequence, the time of its training increases too. In the experiment with the separation of logging methods, BK, DS, DT, GR, NGR, IK, PZ, SP were selected as the input data. The experiment results for one well (determination of the saturation character) with a data window of five samples are shown in Fig. 8.
To test the accuracy of this approach, the wells were interpreted according to the complete set of methods and methods, namely: BK, GR, NGR, DS.
The results of the reservoir separation into reservoirs with a full set of logging methods are shown in Fig. 9 without a data window and Fig. 10 with a data window of 5 counts. Two methods were applied to bring the NN estimates to exact values: introduction of the rounding threshold and use of a fuzzy system. In Figs. 9 and 10, the solid line is expert's conclusion, and the dotted line is network evaluation.
For solving this problem, it was assumed that the coefficients in the petrophysical equations are known. To determine them, you must have a training sample.
The tasks of increasing the informative value of models of well logging data interpretation are solved. We denote the properties of the cutting by the vector . As such properties, the porosity coefficient , the clay factor , the water saturation coefficient , the oil saturation coefficient , etc., are generally used. Several methods were used to conduct the well logging: electrometric, acoustic, radiometric, thermometric, etc. For each method, a signal was detected that determined the physical characteristics (electrical resistance, sound wave velocity, radioactive radiation level) associated with the properties of the section.
Fig. 8Determination of saturation type by individual
a) BK curve
b) DS curve
c) DT curve
d) GR curve

e) NGR curve
f) IK curve
g) PZ curve
h) SP curve

Fig. 9Result of allocation of collectors without window on 8 methods
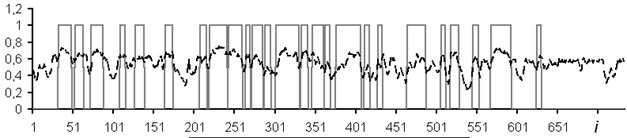
Fig. 10Result of allocation of collectors with data window in 5 counts
The quality improvement of well logging interpretation is also achieved by reducing the size of the data system. Dimension reduction methods are designed to represent a system characterized by variables in a coordinate space of smaller dimension , and . For this, one can use either nonlinear methods (multidimensional scaling) or linear (main component method). In the PCA principal component method, each coordinate axis is a linear combination of the system’s initial variables . The transformation by the principal component method determines the correlation between the variables that make up the input set. If the variables correlate with each other, then it is sufficient to take a smaller number of variables to determine all the data.
On the presented sample, the matrix of signals transformation into the values of the main components for the five methods was determined. The values were fed to the input of the fuzzy TSK network instead of the signals . In fact, this means that a network of the following kind is constructed . The results of expert interpretation and calculation are shown in Fig. 11.
Fig. 11Results of fragment interpretation separation of seams using composite network x→PCA→y→TSK→f
A study was made by the application of oil well formation classification methods based on learning algorithms without a teacher for well logging interpretation tasks in order to obtain additional information on the structure of the section. The following algorithms are considered: Kohonen self-organizing maps; multidimensional scaling method; method of main components of X-ray diffraction. These algorithms gave approximately the same results.
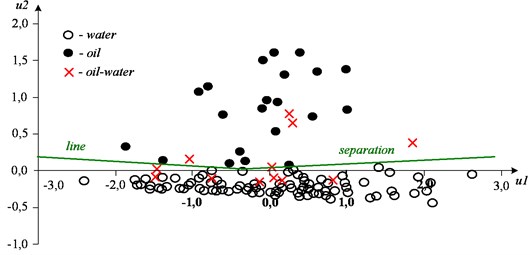
For example, for the case of two-dimensional scaling, we have a mapping of the multidimensional feature space onto the plane in the measurement system , , shown in Fig. 12 with known decoding results for them. From Fig. 12, it follows that all the layers are located in two compact groups. One group occupies the area 0 and corresponds to productive layers. Another group 0 is formed by aquifers. Mixed layers occupy an intermediate position.
After adding to the examined objects a group of layers for three additional wells with unknown lithological properties, all the productive strata were higher than the separation line, and all the aquifers were lower (Fig. 13). Thus, the division into productive and unproductive strata by this method is one hundred percent.
Fig. 12Results of two-dimensional scaling
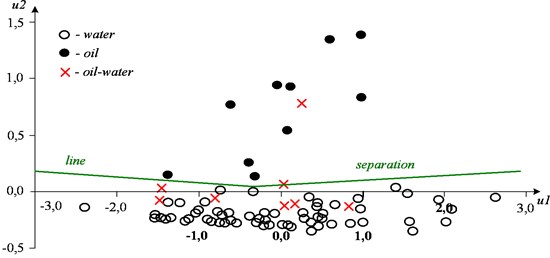
Fig. 13Two-dimensional scaling for group of layers with unknown lithological characteristics
4. Conclusions
A complex experiment was conducted to train the NN, which consisted in the allocation of reservoir-reservoirs and oil-saturated, water-saturated, oil-saturated reservoirs. Experimental relationships between the rules of formalization of the problem, and the final results of recognition of the lithological structure of the borehole section with the help of an apparatus of artificial NN are obtained. This made it possible to draw a conclusion on the applicability of multilayer NN for qualitative express interpretation of well logging data. Among the neural network algorithms considered (multilayer perceptron, radial network, fuzzy network), the best efficiency (approximation error) is provided by fuzzy TSK network with training based on pseudo-inversion and hybrid algorithm.
The application of algorithms for processing the output of NC allowed obtaining up to 85 % of coincidences of network estimates with the reference data using the rounding threshold and up to 93 % when using the fuzzy logic apparatus. In other words, the accuracy of isolating lithologic formations in the borehole section with the help of the NS can be higher than that the indicated one. The root-mean-square prediction error on the test data set was for a multi-layer perception 1,9 %, for the TSK network 1,6 %.
References
-
Callan R. Basic Concepts of Neural Networks. Williams, Moscow, 2002.
-
Hopfield J. J. Neural networks and physical systems with emergent collective computation abilities. Proceedings of the National Academy of Sciences of the United States of America, Vol. 79, 1982, p. 2554-2558.
-
Kruglov V. V., Borisov V. V. Artificial Neural Networks. Theory and Practice. 2nd Ed., Hot-Line-Telecom, Moscow, 2002, p. 382.
-
Osovskiy S. Neural Networks for Information Processing. Rudinsky, Moscow, 2002, p. 344.
-
Holland J. H. Adaptation in Natural and Artificial Systems. University of Michigan Press, Ann. Arbor, MI, 1975.
-
Wendelshtein Yu B., Rezvanov R. A. Geophysical Methods for Determining the Parameters of Oil Reservoirs. Nedra, Moscow, 1978, p. 317.
About this article

