Abstract
The leakage of water supply pipeline is a common problem in the world. Timely discovery and treatment of leakage can avoid drinking water pollution, save water resources or avoid road collapse accidents. Therefore, it is of great practical significance to study pipeline leak detection methods. In this experiment, piezoelectric acceleration sensors were placed in different locations of a leak pipe to acquire the leakage signals. According to the generation mechanism of leak acoustic signals, the unpredictability characteristics of leak signal are investigated. The autocorrelation function is used to describe the unpredictability of the leak signal because it has the ability to analyze the coherent structure of time series, and the Lyapunov exponent can describe its complexity. The autocorrelation function sequence is used as featured extraction object. The Lyapunov exponent of this sequence is used to quantify the signal characteristics. By this method, the leakage can be effectively identified.
1. Introduction
Water is a precious resource, and the distribution of water resources is very uneven. China's per capita water resource is a quarter of the world's per capita. Even so, the average loss rate caused by leakage in China’s water supply network is more than 30 %, which is 2 to 3 times that of developed countries [1]. There is a leaking in water supply pipe network, which not only wastes a lot of water, but also can cause a wider range of water pollution [2]. In order to minimize the loss, it is very important to judge whether the water supply pipe is leaking and accurately locate the leakage point.
Usually non-acoustic methods to detect leaks require a lot of time, such as: uninterrupted flow detection method [3], minimum night flow method [4], and pipeline pressure signal analysis method [5] etc. These methods only suit for some specific pipes or detecting be affected a lot by the environment.
The methods according to the acoustic signal: Initially, people judge a leak by the sound coming from the pipe, which rely on people’s experience too much. In 1993, Wan proposed the adaptive filtering noise for the collected acoustic signals, and according to the spectral analysis, to determine whether there was a leak in the pipeline [6]. Tang Xiujia applied the neural network method to pipeline leakage identification work [7]. He used signal amplitude, average value, etc. as characteristic quantities to identify whether the pipeline leaked. This method cannot eliminate interference from other fixed sound sources. Ai et al. combined the Linear Predictive Coding Cepstrum Coefficients (LPCC) with Hidden Markov Models (HMM) to improve the ability to identify leakage [8], Toshitaka and Akira proposed to identify the leakage by combining the support vector machine (SVM) with the power spectral density of the leakage signal and the destruction factor based on AR model as the characteristics of the leakage acoustic signal [9].
2. Problem description
When there is a crack or small hole in the water supply pipe, the water will spray outwards and interact with the pipe to form vibration. The vibration propagates far away through the waveguide formed by the pipe and the fluid in the pipe. Place acceleration sensors on both sides of the leak point to obtain the vibration signal [2], as shown in Fig. 1.
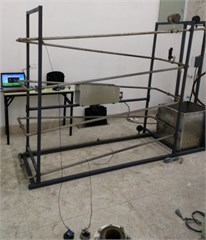
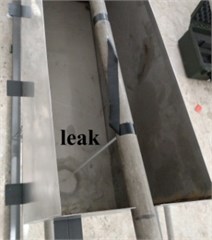
Pipeline leakage was simulated in the laboratory, the actual experimental device is shown in Fig. 2.
The signals collected by the sensors can be simplified as:
In the equation, and represent the signals collected by the sensors, is the leakage signal, and represent noise, is the delay time of the source signal to reach the two sensors; a is the attenuation factor. The location of the leakage point can be calculated by combining the length () of the pipeline between the sensors and the propagation velocity () of the leakage signal [2]:
From the above analysis, it can be seen that the leak location method based on delay time. However, when the pipeline is inspected in the actual environment, a variety of non-leakage sound can also cause vibration.
Fig. 1Sensors on both sides of the leak
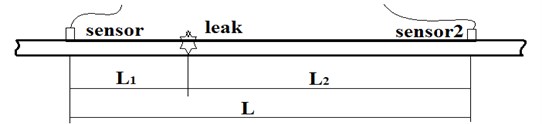
Fig. 2Experimental device
a)
b)
3. Analysis and description of the turbulent characteristics of the leakage signal
Fluid near the leak point become to turbulent flow state, so there is turbulence noise generated; when water is ejected outside the pipe, there is low-pressure zone appeared near the leak. The gas nuclei in the water form vacuoles in the low-pressure area, the cavitation effect also produces acoustic signals [10]. It can be seen that the turbulence noise and cavitation noise are the root cause of the leakage acoustic signal. The characteristics of the leakage acoustic signal are closely related to the mechanism of turbulence and vacuole movement in the leakage.
Fluid turbulence is not a completely random movement, but there is an orderly movement in the disorder. Turbulence is intermittently alternating between the “active period” and the “quiet period,” and the “active period” is repeatable.
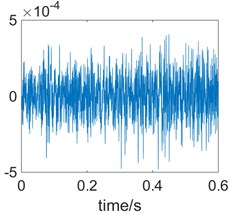
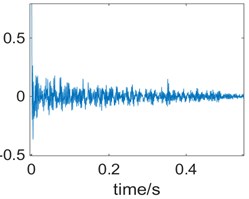
Due to the uncertainty of the generation and rupture of the cavitation bubbles in time and space, the “active period” of turbulent is no longer reproducible. Therefore, the leakage sound has an active period, that is, the acoustic signal generated by the turbulence and vacuoles at a certain moment has a certain survival time, the leakage signals observed during the same active period have similarities in themselves. However, the similarities and correlations are weak between different active period acoustic signals. Autocorrelation functions of observed signals were analyzed. In the “active period”, the autocorrelation function has a larger value; it means that the part has self-similarity. Due to the influence of the cavitation, the correlation between the different active periods is weak. Therefore, at , the signal autocorrelation function will show irregularities. Fig. 3 shows the time-domain waveforms and autocorrelation calculation results of the signal detected by the accelerometer sensor.
Fig. 3Waveform and autocorrelation function of the crack leak signal
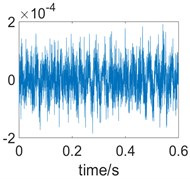
a) Signal waveform
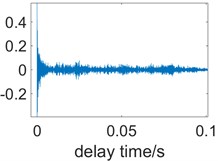
b) Autocorrelation
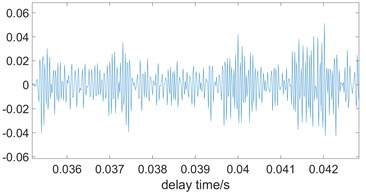
c) Autocorrelation (0.35 < delay time < 0.43)
Analyzing the above results can be obtained: 1) from Fig. 3(b), it can be seen that the autocorrelation function shows an attenuation trend, and the time of the attenuation trend corresponds to the duration of the “active period” of the leakage signal; 2) from Fig. 3(c), with the increase of (delay time), oscillates around 0, but the oscillation process is not regular, which indicates that there is a weak correlation between the leakage signals in a active period and other active periods.
Fig. 4 shows the time domain of the knock ground signal and the processing result of the autocorrelation function. The distance between the knock and the pipe is 2 m, and the signal is still collected by the acceleration sensor on the pipe.
Fig. 4Waveform and autocorrelation function of the knock the ground sound
a) Signal waveform
b) Autocorrelation
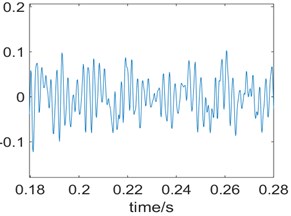
c) Autocorrelation (0.18 < delay time < 0.28)
We can see that in Fig. 4(c) oscillates around 0 and the oscillation process has certain regularity, there is an obvious oscillation start and decay process. According to the principle of autocorrelation, it can be seen that the signal has “reproducibility”. This is quite different from leakage signals (as shown in Fig. 3).
From analysis, we can see that some features of leakage acoustic signal and non-leakage acoustic signal are quite different, and the autocorrelation function can reflect the difference between the two. Therefore, leakage detection can be achieved by using the part of the autocorrelation function as the object of extraction.
The same result can be found in sever other experiments, they are: machine running, car passed, and so on.
4. Application of the Lyapunov exponent
Since the initial value sensitivity of chaotic system and the anti-interference ability of noise are better, the application of chaos theory to signal detection is an important development trend at present.
The maximum Lyapunov exponent can determine the chaos [11]. In most cases, it only needs to calculate the maximum Lyapunov exponent, if it is greater than zero, which indicates that the system is chaotic, otherwise the system is not chaotic.
In this paper, the correlation function and the maximum Lyapunov exponent are used to identify the leakage, and the specific process is: 1) the autocorrelation function of the signal collected by the sensor is calculated first; 2) the function value after the signal correlation length is used as the calculation sequence to calculate the maximum Lyapunov exponent, and then identify whether the leakage occurs.
When calculating Lyapunov exponent, phase space reconstruction is first performed [11]. In the process of phase space reconstruction, the embedding dimension and delay time directly affect the level of phase space reconstruction, and then influence the speed and precision of Lyapunov exponent calculation.
In this paper, the improved mutual information method [12] is used to calculate the delay time, the - tree algorithm of false nearest neighbors’ method [13] is used to calculate the imbedding dimension.
Fig. 5The delay time calculated by the mutual information method
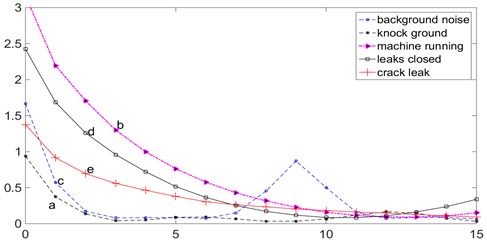
Fig. 6The embedding dimension image by the false nearest neighbors method
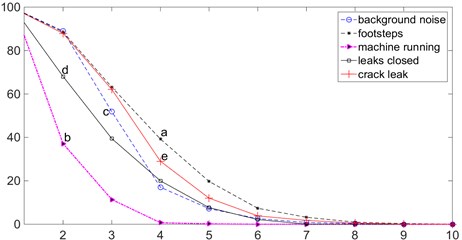
Fig. 5 shows the delay time calculated by the mutual information method. Fig. 6 shows the embedding dimension image by the false nearest neighbors method. Fig. 7 shows the calculation process of the maximum Lyapunov exponent.
In Figs. 5-6: (a) the background noise is collected when a car passed by in environment. (b) the knock ground sound in environment is collected when there is no water in the pipe. (c) the signal is collected when machine running in environment. (d) the signal is collected when all leaks are closed and all valves are open with high water pressure in the pipe. (e) the signal collected when opening the crack leak and closing all valves with high water pressure in the pipe.
Fig. 7The calculation process of the maximum Lyapunov exponent
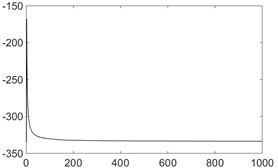
a) Background noise
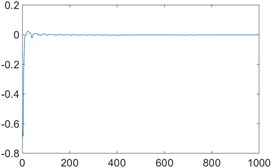
b) Knock ground sound
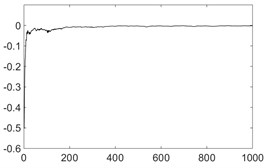
c) Machine running
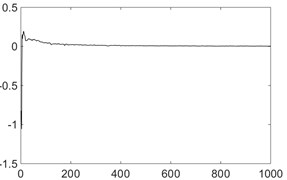
d) All leaks are closed
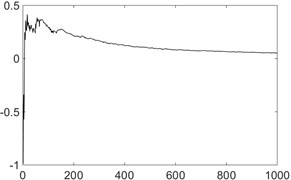
e) Crack leak
The maximum Lyapunov exponent obtained in each case is shown in the Table 1.
From the above analysis, it can be found that the maximum Lyapunov exponent is positive when the leakage exists, and the value is relatively larger. When the noise of non-chaotic systems exists (such as machine’s sound), the maximum Lyapunov exponent is negative. However, there is also turbulent flow at the valve corner of the pipeline, the maximum Lyapunov exponent is positive, but the value is small.
Fig. 8The cross-correlation calculation of the signals obtained by the two sensors
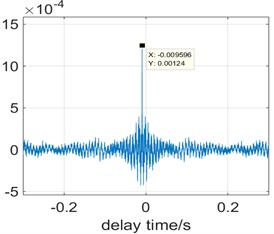
Table 1The maximum Lyapunov exponent of each case
Situation | Background noise | Knock ground | Machine running | Leaks closed | Crack leak |
Lyapunov exponent | –333.8 | –0.0021 | –0.0040 | 0.0059 | 0.0630 |
However, there is also turbulent flow at the valve corner of the pipeline, the maximum Lyapunov exponent is positive, but the value is small.
Then the cross-correlation calculation of the signals obtained by the two sensors can calculate the corresponding delay time (), the result shown as Fig. 8, 0.009596. Take the delay time into Eq. (2) to obtain the leak location. The calculation result is basically in line with the actual situation.
5. Conclusions
Based on the mechanism of the leakage sound signal, the interaction between the turbulence and the cavitation of the leak is analyzed, and the mechanism of the “non-repeatable” characteristic of the leakage signal’s “active period” is analyzed. The signal autocorrelation function is used to describe the characteristic of the leakage signal. Among them, the autocorrelation function value after the correlation length of the signal reflects the “non-repeatability” characteristic. The function value is used as the extraction object to identify the leak with the maximum Lyapunov exponent.
Next step, I’ll study Lyapunov exponent by changing a certain variable (such as the vibration frequency, water pressure, and so on). And compare with other detection methods.
References
-
Shu Shihu, He Wenjie Current application and recent development of leakage detection technologies in water supply networks. Water and Waste water Engineering, Vol. 6, 2008, p. 114-116.
-
Fuchsh V., Riehle R. Ten years of experience with leak detection by acoustic signal analysis. Applied Acoustics, Vol. 33, 1991, p. 1-19.
-
Makar J. M., Kleiner Y. Maintaining water pipeline integrity. AWWA Infrastructure Conference and Exhibition, Baltimore, Maryland, 2000.
-
Makar J. M., Chagnon N. Inspecting systems for leaks, pits, and corrosion. American Water Works Association, Vol. 91, Issue 7, 1999, p. 36-46.
-
Liu Jingbin, Wang Ji, Liu Shuyong A survey of structural damage identification methods based on vibration analysis. Environmental Engineering, Vol. 5, 2017, p. 95-98.
-
Qin Wan, Koch Daniel Multichannel spectral analysis for tube leak detection. Proceedings of Southeastcon, 1993.
-
Tang Xiujia Water pipelines leak detection and location method and instrument. Journal of Hydraulic Engineering, Vol. 3, 1997, p. 19-26.
-
Aich S. H., Zhao H. H., Ma R. J., et al. Pipeline damage and leak detection based on sound spectrum LPCC and HMM. Proceeding of the 6th International Conference on Intelligent System Design and Applications, 2006, p. 829-833.
-
Sato T., Mita A. Leak detection using the pattern of sound signals in water supply systems. Summaries of Technical Papers of Meeting Architectural Institute of Japan B, 65292K-9, 2007.
-
Thompson M., Chapman C. J., Howison S. D., et al. Noise generation by water pipe leaks. 40th European Study Group with Industry, Keele, 2001.
-
Brown R., Bryant P., Henry D. I. Computing the Lyapunov spectrum of a dynamical system from an observed time series. Physical Review A, Vol. 43, Issue 6, 1991, p. 2787-2806.
-
Jiang Aihua, Zhou Pu Improved mutual information algorithm for phase space reconstruction. Journal of Vibration and Shock, Vol. 14, Issue 2, 2015, p. 71-74.
-
Liu Shuyong, Yang Qingchao, Wei Xiulei The application of fast searching nearest points method to chaos identification. Journal of Huazhong University of Science and Technology, Vol. 40, Issue 11, 2012, p. 89-92.
-
Hunaidi Osama, Wing Chu T. Acoustical characteristics of leak signals in plastic water distribution pipes. Applied Acoustics, Vol. 58, 1999, p. 235-254.
Cited by
About this article

The research is support by the provincial foundation of China (2017CFB672) and University Scientific foundation (425517 K143).
