Abstract
Experimental modal analysis of a turbine disk was conducted with the hammering method. The first five modals were obtained, matches well with calculation results of ANSYS, and proves the effectiveness of the experiment, provides a reference for further improvement of a certain engine.
1. Introduction
Gas turbine is a core component of the engine [1]. It works at high speed, high temperature, and poor working environment. Its stable operation is essential for the engine to work properly. If the gas turbine is excited by airflow or other external force during operation, it will cause great damage, which may cause the blade to break or even penetrate the engine casing [2-4]. Therefore, in the working environment, the gas turbine should meet the requirements of high vibration characteristics and structural rigidity.
However, gas turbines inevitably vibrate during normal operation. In order to prevent the gas turbine from resonating and causing damage, the modal analysis of the gas turbine is needed to understand the resonant frequency of the gas turbine and the corresponding natural vibration modes, so as to avoid the resonance frequency when the gas turbine is working and ensure the normal operation of the gas turbine [5].
An experimental modal analysis of a turbine disk was conducted with the hammering method. The first five modals were obtained, matches well with calculation results of ANSYS, and proves the effectiveness of the experiment, provides a reference for further improvement of a certain engine.
2. Experimental modal analysis of a turbine disk
The modal analysis method is used to determine the natural frequency and natural mode of the system through modal test and parameter identification. The modal parameters can be determined by a series of frequency response functions, giving a certain excitation to the structural system, measuring the corresponding excitation and frequency response functions, and using the frequency response function to identify the modal parameters, called the frequency of the modal parameters. Domain identification method.
2.1. Modal experiment device
The signal acquisition and data analysis software used in this test is the DASP software of China Orient Institute of Noise and Vibration. It has multiple test and analysis modules such as signal acquisition, signal processing, signal generation, and DA conversion. With different hardware, it can complete a variety of different dynamic and static tests [6]. The system principle of this modal test is shown in Fig. 1.
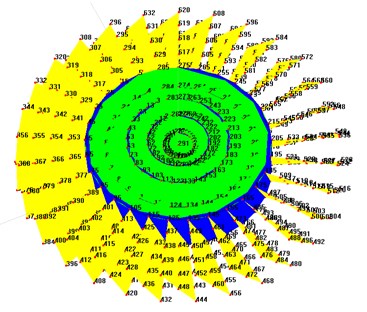
In order to accurately obtain the first few modes, a total of 640 measuring points are arranged on the turbine disk. The test model is shown in Fig. 2.
Fig. 1Instrument connection diagram
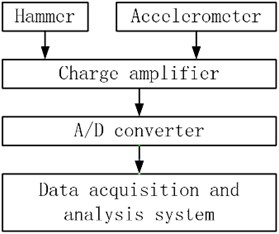
Fig. 2Modal test model
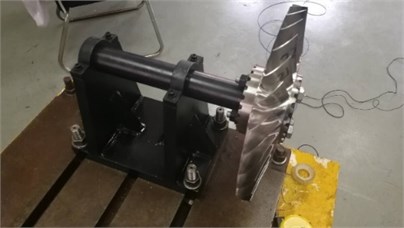
In order to simulate the free-free boundary conditions and the installation boundary conditions, respectively, the two sets of tests were carried out by means of free suspension and clamping. Two sets of test devices are shown in Fig. 3 and Fig. 4.
Fig. 3Free boundary condition test
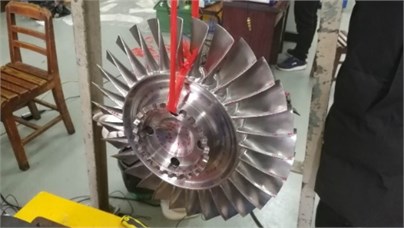
Fig. 4Installation boundary condition test
2.2. Experimental result
The first five natural frequencies and damping ratios are shown in Table 1, and the corresponding vibration modes are shown in Fig. 5 and Fig. 6.
Table 1Test values of frequency and damping ratio of each order
Order | 1 | 2 | 3 | 4 | 5 | |
Free-Free | Frequency (Hz) | 2610.6 | 4234.3 | 6072.2 | 6281.9 | 8552.8 |
Damping ratio (%) | 0.000 | 0.016 | 0.014 | 0.005 | 0.011 | |
Installation | Frequency (Hz) | 1313.8 | 2575.1 | 4607.1 | 6142.3 | 8096.4 |
Damping ratio (%) | 1.315 | 0.117 | 0.054 | 0.025 | 0.366 | |
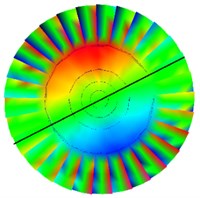
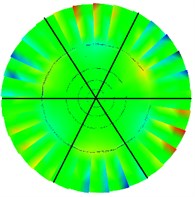
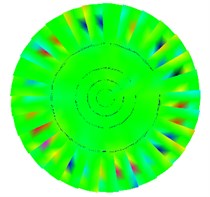
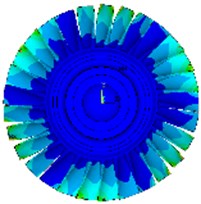
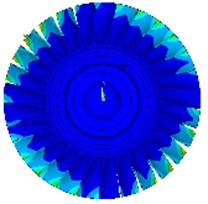
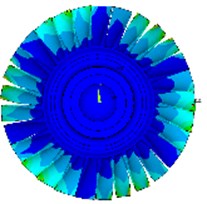
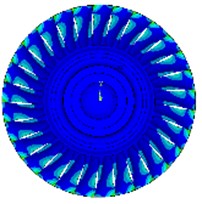
Fig. 5Test various modes of vibration under free boundary conditions
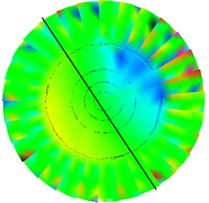
a) 1st order
b) 2nd order
c) 3rd order
d) 4th order
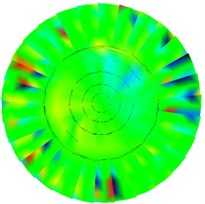
e) 5th order
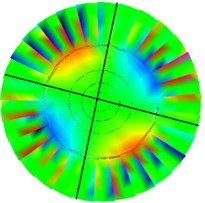
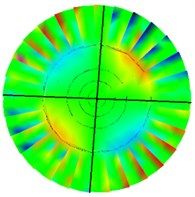
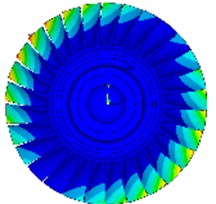
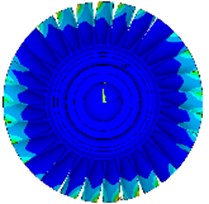
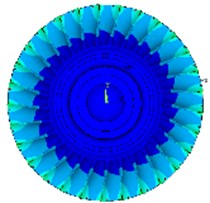
Fig. 6Test various modes of vibration under installation boundary conditions
a) 1st order
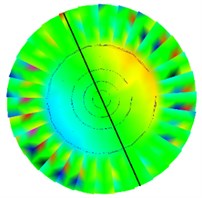
b) 2nd order
c) 3rd order
d) 4th order
e) 5th order
3. FEM calculation analysis
The processing of the model has a greater impact on the accuracy of the results [7]. In order to improve the calculation speed of the mesh quality, the model is pre-processed. Ignore arc end teeth, chamfers and holes, segment the turbine disk into a fan shape for periodic symmetric meshing. The first five natural frequencies and corresponding modes are solved under free-free boundary conditions and installation boundary conditions, as shown in Table 2, Fig. 7, and Fig. 8.
Table 2Basic size and style requirements
Order | 1 | 2 | 3 | 4 | 5 |
Free-Free | 2348.2 | 4772.5 | 5913.5 | 5420.3 | 8560.4 |
Installation | – | 2348.0 | 4771.6 | 5911.2 | 8537.7 |
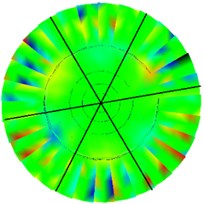
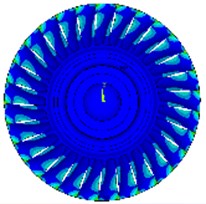
Fig. 7Calculation of various modes of vibration under free boundary conditions
a) 1st order
b) 2nd order
c) 3rd order
d) 4th order
e) 5th order
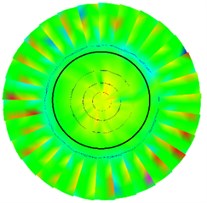
Fig. 8Calculation of various modes of vibration under installation boundary conditions
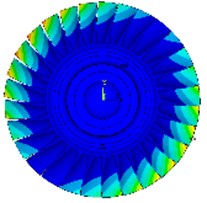
a) 2nd order
b) 3rd order
c) 4th order
d) 5th order
4. Comparison of test and calculation results
The comparison between the test and calculation results under free-free boundary conditions is shown in Table 3, under the installation boundary conditions is shown in Table 4.
Table 3Comparison of experimental and calculated values under free boundary conditions
Order | Frequency (test value) | Frequency (calculated value) | Relative error |
1 | 2610.6 Hz | 2348.2 Hz | 10.1 % |
2 | 4234.3 Hz | 4772.5 Hz | 12.7 % |
3 | 6072.2 Hz | 5913.5 Hz | 2.6 % |
4 | 6281.9 Hz | 5420.3 Hz | 13.7 % |
5 | 8552.8 Hz | 8560.4 Hz | 0.1 % |
It can be seen from Table 3 that the calculation results of the modes of the various modes under the free boundary conditions are consistent with the experimental results, but the frequency is slightly different, this may be due to the simplification of the model and the noise caused during the test. From Table 4, it can be seen that the theoretical calculation does not yield the first-order mode shape obtained under the installation boundary condition. It is speculated that the mode shape is the fixture mode measured by the lower stiffness of the fixture. For the remaining modes and frequencies, the calculated values agree well with the experimental values.
Table 4Comparison of test values and calculated values under installation boundary conditions
Order | Frequency (test value) | Frequency (calculated value) | Relative error |
1 | 1313.8 Hz | – | – |
2 | 2575.1 Hz | 2348.0 Hz | 8.8 % |
3 | 4607.1 Hz | 4771.6 Hz | 3.6 % |
4 | 6142.3 Hz | 5911.2 Hz | 3.8 % |
5 | 8096.4 Hz | 8537.7 Hz | 5.5 % |
5. Conclusions
The comparison between the finite element calculation and the modal test of the turbine disk proves the validity of the test results and calculated values, and the static frequency characteristics of the turbine disk are obtained. The first-order frequency of the turbine disk under free boundary conditions is much higher than its operating speed, which provides a basis for further improvement of the design.
References
-
Deng Ming Aero Engine Structural Analysis. First Edition, Northwestern Polytechnical University Press, Shaanxi, 2006.
-
Tao Chunhu, Zhong Peidao, Wang Renzhi Failure and Prevention of Rotating Parts of Aero-Engines. First Edition, National Defense Industry Press, Beijing, 2008.
-
Lu Wenhai, Liu Liyu, Bai Mingyuan Engine gas turbine blade fracture analysis. Failure Analysis and Prevention, Vol. 4, Issue 5, 2010, p. 252-256.
-
Li Zhao Fault analysis of engine turbine blade fracture. Failure Analysis and Prevention, Vol. 6, Issue 8, 2013, p. 361-365.
-
Yu Qizhi, Chen Danye Yan Chen Comparison between finite element and experimental modal analysis of vehicle body. Journal of Donghua University, Vol. 4, Issue 37, 2011, p. 493-496.
-
ZhangLi Modal Analysis and Experiment. First Edition, Tsinghua University Press, Beijing, 2011.
-
Li Chao, Ai Likun, Liu Yanfeng Finite element analysis of dynamic mode of high speed turboexpander impeller. Chinese Journal of Power Engineering, Vol. 3, Issue 30, 2010, p. 161-165.
About this article

