Abstract
This work presents an automated and optimized methodology for detection and tracking real-time rolling bearings defects. It contains three sequential loops. The first loop is the initialization, as well as the constitution of a class called healthy. It starts by extraction of features from the acquisition signals, then select the most correlated features to reduce the unimportant features by the Relief method, normalization data by z-score, and reduce the dimension by -SNE method, ended with a calculation of OPTICS parameter’s Epsilon and Minpts. The second loop is the detection, which has the same initialization steps, besides, OPTICS for data classification. The third loop is the follow-up: this phase consists of projecting the matrix of defect features into the final base that has made it possible to detect the defect class and to track the evolution of this class over time. The proposed methodology has been validated numerically and experimentally for rolling bearing in the outer race.
Highlights
- Automating the OPTICS the input parameters, the minimum number of points (Minpts), and the given radius (Epsilon).
- Changing the Euclidean distance by Manhattan distance, which is better for a huge amount of data.
- Using Relief method to filtration the features, then to choose the most correlated to use in classification and detecting defects.
- Using the T-distributed Stochastic Neighbor Embedding (t-SNE) method to reduce the dimension of data.
- All this modification leads to detecting the defect in rolling bearing with accuracy 100%.
1. Introduction
Nowadays, both efficiency and the sustainability of the production processes of high-tech manufacturing products depend on the implementation of advanced manufacturing strategies in the production processes. In particular, the development of advanced solutions for zero-defect application metrology is considered a robust technology capable of delivering a wide competitive advantage to manufacturing industries, which is the motor of the 4th industrial revolution (Industry 4.0). Rotary machines are presently prevalent in applications involving power transmission systems. As demand increases, the importance of timely repair of defects increases due to the importance of reducing losses due to interruption of work, so it was necessary to use several methods of detecting defects, including mention of vibration analysis [1]. The vibration analysis of these types of equipment is an accurate method because they give remarkable results in maintenance programs. At present, vibration analysis plays a role in manufactures to maintain and increase the condition of available machines. The classification has used recently to detect defects in the rolling bearing [2] based on the extracted vibratory signals. The OPTICS (Ordering points to identify the clustering structure) [3] is an efficient method utilized to classify data, has a weakness in the determination of parameters epsilon the radius of the cluster, and Minpts the minimum number of data points needed for clustering. Both have a considerable effect on the clustering results because the parameter values affect the detection of the defect. Besides, to the parameters epsilon and Minpts, the Euclidean distance shows the limitation of the use of large amounts of data. To solve these problems, we suggested the optimization and automating of the classification. The procedure used in this methodology leads to reach the parameter automatically. The automating consist of the calculation of parameters Minpts and Epsilon. The optimization is the applying of the Relief method and the distance Manhattan. Then the Relief method for calculating the correlation between features and extracting the most important, to use in the detection of the defect. It also replaced the Euclidean distance by the Manhattan distance [4]. The dimension reduction of features by method t-SNE [5] to optimize and thus make reliable real-time detection and the tracking of rolling defects. In particular, the methodology applied to numerical and experimental data in the outer race of the rolling bearing.
2. Optics method
OPTICS (Ordering Points to Identify Clustering Structure) is an algorithm founded by [6], it has been used in many fields of biology, astronomy, topology, and recently in the mechanical area especially for the detection of defects in the rolling bearings in rotary machines by [7].
OPTICS is a density-based cluster algorithm that can classify the objects, by their density, the dense regions separated from the noises which are the less dense. The two concepts of OPTICS are:
– Core distance. The database has a point object , and distance , the is distance-neighbor of , MinPts is a numeric number, and () is the distance from to its MinPts neighbor. The core-distance of is defined in Eq. (1):
– Reachability distance. The database has two points object , and , be the distance-neighbor of , MinPts is a numeric number. The reachability-distance of concerning o defined in Eq. (2):
3. Proposed method: AOM-OPTICS
3.1. Principe
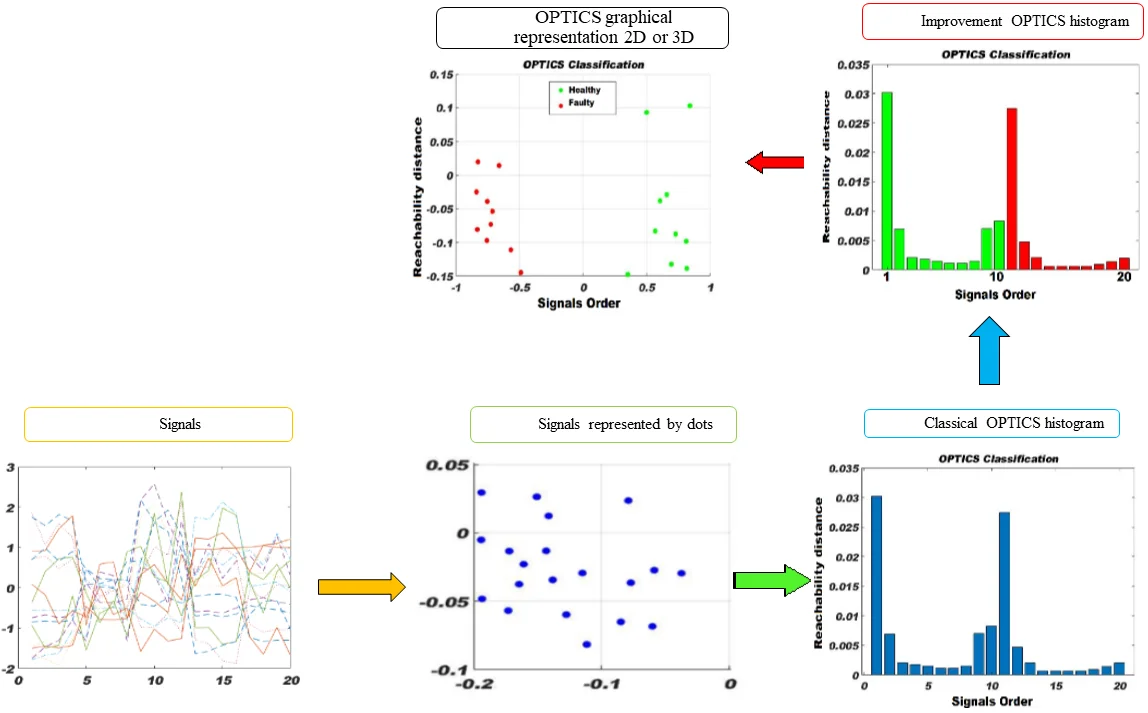
The proposed AOM-OPTICS methodology organized into three loops: initialization, detection, and follow-up. The initialization phase, in general, summarizes it; it consists of a defined number of signals, which aim to build a health class state. The detection phase is the step where the defect is detected. The follow-up used for the monitoring of the degradation state of the equipment.
The loop of the initialization starts with the calculation and extraction of the features from the acquisition signals. The use of the Relief method comes after the features extraction, to extract the correlation between them, which can reduce the number of features and give the best detection of the defect. Then normalization by the -score method, and then was reduced the dimension by the -SNE method [8]. The final step in this loop is the calculation of the OPTICS parametersMinPts and Epsilon. The second loop is defect detection. This loop has the same idea and steps of initialization. Besides, the OPTICS method to classify data, the classification makes it easy to detect the defect. In this loop, two classes appear the first one is a healthy state, and the second one the defective or faulty, here the loop ended and started the follow-up loop. The loop monitoring or follow-up has the goal of observing the degradation state. The used parameters for monitoring the degradation state are the Davies-Bouldin index and Calinski-index. This parameter can reach by calculating the features extraction, normalization, reduction of dimension, then projecting in the final base, which founded in the loop of detection.
3.2. Features extracted
Extracting the characteristic parameters of the operating state for a rotating machine consists of calculating the features in the time domain, frequency, and frequency-scale domain. In this study, seventeen features calculated. The eight features are extracting from the time domain: root means square (rms), kurtosis (Ku), peak (PIC), peak factor (CF), Skewness (Sk), Impulse factor (IF), Standard deviation (Std), Talaf, Thikhat [9]. The six features extracting from the frequency domain: the mean square frequency (frms), the mean square frequency brut (frmsb), the center frequency (fc), Standard deviation frequency brut (fstdb), the root mean square value (rmsf), Power envelope [10]. Two features have extracted from the scale domain are the sufficient value of the frequencies (wrms) and the average value of the envelope spectrum amplitudes (pcwt) [11].
3.3. Relief method
Relief is a supervised algorithm [12]. Using many features is good, but this becomes ineffective and can lead to an inability to identify crashes in time. Therefore, it is essential to use this method to delete the unimportant features. Relief computes a score for each feature that can then be applied to rank and select the top-scoring features for the feature selection. These scores can also be used as features weighting to help guide downstream classification. The scoring of raised features is based on finding the differences in feature values between the closest pairs of instances. If a difference in feature value is observed in a pair of neighboring instances having the same class, the feature score is reduced. This method reduces the number of extracted features from seventeen to ten. The ten features are Std, rms, SK, frms, pcwt, frmsb, wrms, fstdb, frms, and Power envelope.
3.4. Features reduction (-SNE)
Among several dimension reduction methods, -distributed stochastic neighbor embedding (-SNE) has been used for its reliability. After extracting the features and with large amounts of data, the importance of the selection becomes apparent, as it reduces the time and storage space required without losing valuable information [13, 14]. This method makes it easier to visualize data when reduced in 2D or 3D.
3.5. Calculation of epsilon and
To detect the value of Epsilon, we must identify MinPts, which is 1/2 of the initial matrix. To determine the Epsilon value must have two concepts: the MinPts and the slope of the calculated distance. Starting by calculating the distance values of all points in the initial matrix, then sorting the distance by ascending order and plotting the calculated distance. The plot distance has slops, but the first slop having the numbers equal to MinPts is the Epsilon value [15].
3.6. Follow-up
The follow-up phase consists of projecting the matrix of defect features into the final base, which makes it possible to create the “defect class” and to track the evolution of this class over time. This follow-up phase intended to predict the failure state and to provide the replacement of the defective component. For this, we used evaluated characteristics such as the Davis-Bouldin index, Calinski-index [16] of the defect class. Tracking the development of parameters can make it possible to quantify the degradation of a bearing or change due to the evolution of the defect.
4. Experimental validation
The experimental validation was carried out at the University of Reims Champagne-Ardenne in France. The testing bench in Fig. 1(a). has an electric motor which delivers a maximum power of 10 kW across a shaft held with two bearings: a healthy 6206 ball bearing and a N.206.E. G15 rolling bearing, which is being damaged. The rotation is regulated by a speed controller. A steel cable actuation is used to load the shaft radially. The defects are generated by an engraving pen on the outer race of the roller bearing. The defects are slightly varying and their sizes are measured using PlastiformTM paste. The defect sizes are shown in Table 1. The collected database for each defective measurement size, using 5 different loads varying from 100 to 220 daN, with a 30 daN step, and with 5 different rotational speeds varying from 1405 to 1560 rpm and with a step of 50 rpm. A Piezo-electric sensor positioned radially on the bearing is taken as the best measuring point. We have used the OROS OR34 acquisition system. The database that was created (9×10×8), composed of 9 states, one healthy and eight have different defect sizes, the single state has five different speeds as well as five different loads, which results to give us a set of 10 signals, the signal split into eight parts. The database has 720 values. The same methodology with the simulated data used here in the experimental. The Relief method and -SNE used for the reduction of dimension, then the AOM-OPTICS methodology applied.
Fig. 1a) Test bench, b) defected N.206.E. G15 rolling bearing, c) N.206.E. G15 rolling bearing
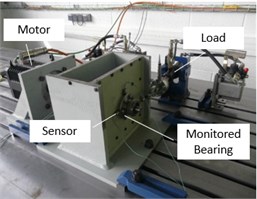
a)

b)
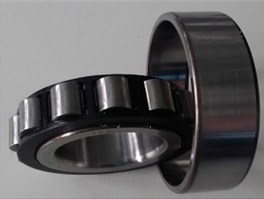
c)
Table 1Fault measurements: roughness arithmetic (Ra) and roughness total (Rt)
Faults | Healthy | 1 | 2 | 3 | 4 | 5 | 6 | 7 | 8 |
(μm) | – | 2.42 | 3.00 | 8.25 | 10.50 | 10.55 | 18.17 | 18.67 | 21.42 |
(μm) | – | 0.33 | 0.41 | 0.73 | 1.32 | 1.52 | 1.82 | 2.36 | 2.97 |
Width (mm) | – | 0.16 | 0.21 | 0.45 | 0.74 | 1.09 | 1.78 | 2.03 | 2.32 |
The healthy state in rolling bearing, which is represented by one cluster with the dispersed points surround, shown in Fig. 2(a). The detection of defect lead to appear the second cluster that correspond to defect number one observed in the Fig. 2(b). The growth in the defect, with eighteen amplitudes, corresponding to defect number eight, can show in the Fig. 2(c).
Fig. 2a) #10 Healthy, b) #11 faulty, c) #18 faulty
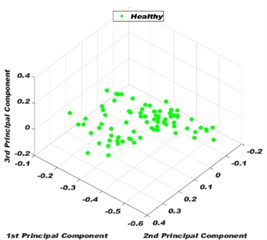
a)
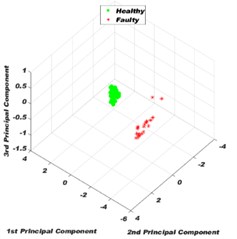
b)
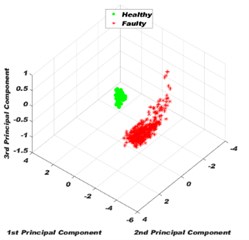
c)
4.1. Follow-up
Follow-up is the final step in monitoring the development of defects over time. The second cluster evolution is obtained from the characteristic parameters (Calinski index, Davies-Bouldin index). The experimental results of follow-up, for the Calinski index, the curve grows with the number of the signal. Otherwise, the Davies Bouldin increase with the signals, that means the defect growing with the signals value the results shown in Fig. 3(a-b).
Fig. 3a) Calinski-index, b) Davies-Bouldin index
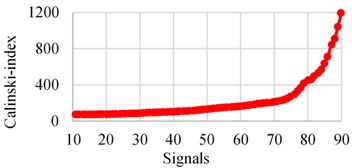
a)
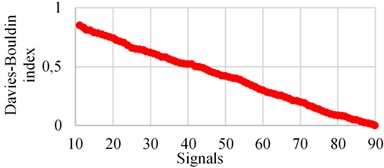
b)
5. Conclusions
Based on a dynamic classification by OAM-OPTICS methodology, an unsupervised classification method developed to monitor bearings by the vibration signals has been proposed. The proposed methodology validated through the simulated and experimental signals. This automatic implantation and optimized methodology used in the classification, allows us to detect the defects, with a high accuracy equal to 100 %. The performance of the method is very efficient; it can detect small variations. The influence of the load and speed cannot lead to discovering the defect, which improved numerically and experimentally, by the variety of load and speed. The characteristic parameters facilitate observing the evolution of errors with time. The follow-up makes it easier to monitor the influence of the defect growth over time.
References
-
Malla C., Panigrahi I. Review of condition monitoring of rolling element bearing using vibration analysis and other techniques. Journal of Vibration Engineering and Technologies, Vol. 7, 2019, p. 407-414.
-
Kerroumi S., Leti C., Chiementin X., Rasolofondraibe L. Online classification for spalling detection and vibratory behavior monitoring online classification for spalling detection. Mechanics and Industry, Vol. 15, Issue 6, 2014, p. 517-524.
-
Kriegel H. P., Kröger P., Sander J., Zimek A. Density-based clustering. John Wiley and Sons, WIREs Data Mining Knowl Discov, Vol. 1, 2011, p. 231-240.
-
Loohach R., Garg K. Effect of distance functions on simple K-means clustering algorithm. International Journal of Computer Applications, Vol. 49, 2012, p. 7-9.
-
Zhang Y., Zuo H., Bai F. Classification of fault location and performance degradation of a roller bearing. Measurement: Journal of the International Measurement Confederation, Vol. 46, 2013, p. 1178-1189.
-
Ankerst M., Breunig M. M., Kriegel H., Sander J. OPTICS: ordering points to identify the clustering structure. Proceedings of the 1999 ACM SIGMOD International Conference on Management of Data, 1999.
-
Benmahdi D., Rasolofondraibe L., Chiementin X., Murer S., Felkaoui A. RT-OPTICS: real-time classification based on OPTICS method to monitor bearings faults. Journal of Intelligent Manufacturing, Vol. 30, 2019, p. 2157-2170.
-
Maaten L. Van Der, Hinton G. User’s Guide for t-SNE Software, 2008.
-
Shukla S., et al. Analysis of Statistical Features for Fault Detection. IEEE International Conference on Computational Intelligence and Computing Research (ICCIC), 2015.
-
Zhang Y., Tang B., Han Y., Deng L. Bearing performance degradation assessment based on time-frequency code features and SOM network. Measurement Science and Technology, Vol. 28, Issue 4, 2017, p. 045601.
-
Nguyen K. T. P., et al. Analysis and comparison of multiple features for fault detection and prognostic in ball bearings. Proceedings of the European Conference of the PHM Society, Vol. 4, 2018.
-
Khelf I., Laouar L., Bendjama H. Combining RBF-PCA-ReliefF filter for a better diagnosis performance. Condition Monitoring of Machinery in Non-Stationary Operations, Springer, Berlin, Heidelberg, 2012, p. 285-292.
-
Zheng J., Jiang Z., Pan H. Sigmoid-based refined composite multiscale fuzzy entropy and t-SNE based fault diagnosis approach for rolling bearing. Measurement, Vol. 129, 2018, p. 332-342.
-
Chen J., Zhou D., Lyu C., Lu C. Feature reconstruction based on t-SNE: an approach for fault diagnosis of rotating machinery. Journal of Vibroengineering, Vol. 19, Issue 7, 2017, p. 5047-5060.
-
Gaonkar Naik M., Sawant K. AutoEps DBSCAN: DBSCAN with eps automatic for large dataset. International Journal on Advanced Computer Theory and Engineering (IJACTE), Vol. 2, Issue 2, 2013, p. 11-16.
-
Thomas J. C. R., Peñas M. S., Mora M. New version of Davies-Bouldin index for clustering validation based on cylindrical distance. 32nd International Conference of the Chilean Computer Science Society (SCCC), 2013.
About this article

