Abstract
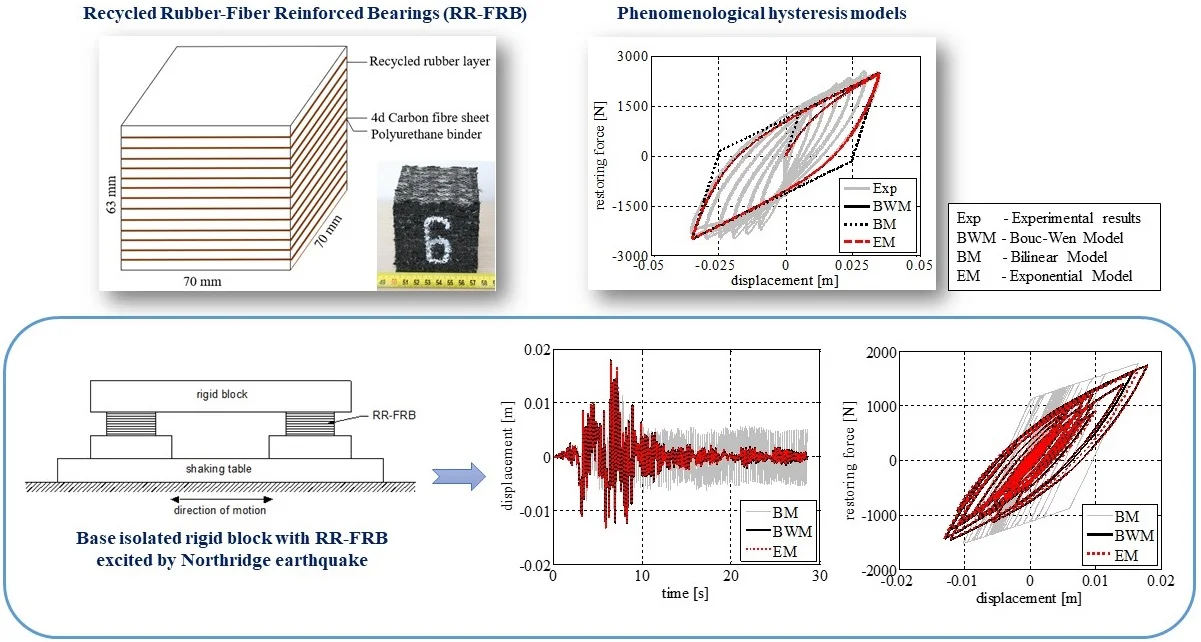
The present study investigates the capability of different hysteresis models in representing the nonlinear behaviour of Recycled Rubber-Fibre Reinforced Bearings (RR-FRBs). A recently developed class of uniaxial phenomenological models is considered along with the Bouc-Wen Model (BWM). In particular, Bilinear Model (BM) and Exponential Model (EM), belonging to the class of above-mentioned phenomenological models, are used. The restoring force-displacement loops of RR-FRBs obtained from the different models are compared with the experimental studies retrieved from the literature. These first results show that the EM not only can accurately predict the behaviour of RR-FRBs, but it also requires a significantly lower computational time. Furthermore, to investigate the capability of the models in predicting the complete response of base-isolated structures, nonlinear time history analyses are carried out on a base-isolated rigid block with RR-FRBs. The response time histories of the rigid block and the restoring force-displacement loops obtained by using the EM are found to be in close agreement with the results obtained by adopting the BWM. In addition, the EM computational time is only 0.25 % of BWM. This clearly demonstrates the efficiency of EM in the seismic response analyses of base-isolated structures with RR-FRBs.
Highlights
- Nonlinear behavior of Recycled Rubber-Fibre Reinforced Bearings (RR-FRBs) is presented using different hysteresis models.
- The comparison of recently developed uniaxial phenomenological models with Bouc-Wen model is presented.
- The efficiency of the phenomenological models in the seismic response analyses of base isolated structures is demonstrated.
1. Introduction
Base isolation is one of the most innovative technologies that allows for a better control of the seismic response of structures by introducing isolation bearings between the superstructure and its foundation [1, 2]. The number of base-isolated buildings is increasing in the recent years due to the development of innovative and cost-effective seismic isolation devices [3, 4] and the introduction of efficient analysis methods [5].
Fibre-Reinforced Bearings (FRBs), which are manufactured by bonding rubber layers with thin layers of fibre reinforcement, are one such promising low-cost technologies typically employed in base isolation systems [6, 7]. FRBs with Recycled Rubber (RR) layers have been recently proposed to improve the economic feasibility of FRBs and to promote their implementation in economically weaker regions of the world [8, 9]. Indeed, the use of low cost recycled elastomeric materials aids in reducing the total cost of RR-FRBs. In addition, as the steel shims used in the conventional laminated rubber bearings are replaced with fibre sheets, the RR-FRBs are also lighter than the conventional devices. The simple manufacturing process of this type of bearings also helps in the mass production of devices with large dimensions. Several studies that demonstrates the feasibility of FRBs in base isolation of structures can be found in the literature [10-12].
The cost-effective RR-FRBs studied in the present paper can be considered a promising low-cost seismic isolation technology for ordinary residential and commercial buildings. Considering the better performance of RR-FRBs in comparison with conventional rubber bearings, potential application of this technology as a base isolation device to minimize damages in buildings of historical importance, art-objects, bridges, buildings with strongly vibrating and sensitive equipment [13-17].
The behaviour of base-isolated structures is highly influenced by the restoring force characteristics of the isolation system, which in turn need to be carefully investigated prior to the design of structures. The studies on elastomeric bearings, most commonly used in seismic isolation, had demonstrated their stability when subjected to design-basis earthquake excitations. However, there exist strong nonlinearities in the behaviour of such devices under greater deformation levels [18]. Due to the difficulties associated with the detailed finite element models of elastomeric bearings, several studies were carried out to identify a suitable hysteresis model capable of reproducing a more realistic behaviour of rubber bearings.
Nonlinear hysteretic models, such as piecewise linear, modified piecewise linear, and curved models, are adopted to represent the bearing restoring force-displacement hysteresis loops obtained from experimental standard cyclic tests [19, 20]. Bilinear hysteretic models are employed in many studies due to the simple formulation and physical interpretation [21, 22]. However, the absence of energy dissipation in smaller hysteresis loops after large deformation results in erroneous response of base-isolated structures after main shock [23]. Another well-known and widely used hysteresis models is the Bouc-Wen Model (BWM) because of its capability of simulating the curved hysteretic behaviour. Unfortunately, the interpretation of the BWM parameters is not straightforward due to its peculiar formulation [24]. Some studies have also reported the violation of plasticity conditions and drift under unsymmetrical displacement or load cycles [25].
Several other models have been also developed for the application on elastomeric bearings. Toopchi et al., 2008 developed a simplified mathematical approach to describe the load-displacement behaviour of unbonded FRBs; in this model the bearing restoring force is simulated using a fifth-order polynomial in terms of lateral displacement [26]. Manzoori and Toopschi, 2017 proposed an extended BWM for the seismic response prediction of base-isolated structures with stable unbonded FRBs. Reasonably accurate peak lateral displacements with errors ranging from 1.50 to 16 % were obtained [27]. Despite the accuracy of the reported models, the computational time and physical interpretation of model parameters remain as a major difficulty in response analyses of base-isolated structures.
In order to address these specific issues, a recently developed class of uniaxial phenomenological models is considered in the present study. Such a family, formulated by Vaiana et al., is found to be advantageous when compared to other models due to its reduced computational effort. Indeed, this class of models leads to a solution of scalar equations for evaluating the bearing restoring force [28-31]. A comparative study of these different type of phenomenological models with specific application to the special type of innovative passive control device such as RR-FRB is not available in the literature.
In this context, the present study aims at investigating the applicability of different hysteresis models in simulating the behaviour of RR-FRBs. In comparison with conventional FRBs, RR-FRBs demonstrated stronger nonlinearity due to porous media of the recycled compound. For this reason, modelling of hysteretic behaviour of this type of devices is deemed particularly challenging from the computational point of view. In this perspective, uniaxial phenomenological models, belonging to the above-described family, are considered along with the most commonly used BWM. The model parameters are calibrated using the Particle Swarm Optimization algorithm [32]. Followed by the system identification, nonlinear time history analyses of a base-isolated rigid block are then carried out to demonstrate the accuracy and computational efficiency of the different employed models. The novelty of the research lies in the demonstration of the performance of different hysteresis models in terms of comparative accuracy of results and computational time in representing the behaviour of RR-FRBs. In addition to this comparative assessment of the recently developed BM and EM with the Bouc-Wen model, another significant contribution of the present study is the identification of the remarkable advantages in using EM in the nonlinear time history analyses of structures.
2. Experimental behavior of RR-FRBs
The experimental investigations on the RR-FRB considered in the study were performed by Losanno et al. (2019) [8]. The recycled rubber compound used in the manufacturing of RR-FRBs, has a shear modulus of 1.1 MPa at 100 % shear deformation. The recycled rubber compounds are produced from scrap tires and industrial leftovers by a comparatively less labour-intensive manufacturing process. These RR-FRBs, produced by Isolgomma S.R.L, costs only one-tenth of the equivalent traditional rubber isolators. The reduced cost of RR-FRBs, in comparison with conventional ones, can be mainly attributed to the high cost of natural rubber and the vulcanization process involved in the production of the conventional rubber bearings and other laminated steel reinforced devices. In addition, RR-FRBs are lighter than conventional rubber bearings and had proven to offer remarkable recentering capacity as base isolators. Being cost effective, a considerable use of this technology may be expected in many parts of the world, especially in the developing nations [9, 33].
Each bearing was manufactured by bonding 12 layers of recycled rubber and 11 sheets of quadriaxial carbon-fibre sheets with a polyurethane adhesive. The manufacturing process includes the following simple steps: (i) Impregnation of rubber grains in polyurethane adhesive to form the elastomeric layers, and (ii) superimposing the layers of fibre and recycled rubber with the adhesive and iii) pressing for a certain period at room temperature [34]. The bearings are 63 mm thick, with a plan dimensions of 70 mm × 70 mm. A schematic diagram and a picture of RR-FRB sample used in the experiments is shown in Fig. 1(a) and Fig. 1(b). The equivalent lateral stiffness of the bearing is 80 kN/m at a design displacement of 30 mm (50 % target shear strain). The design vertical pressure of the bearings is 3.85 MPa.
Fig. 1a) Schematic diagram of RR-FRB, b) sample of tested RR-FRB; c) direction of applied lateral displacement [8]
![a) Schematic diagram of RR-FRB, b) sample of tested RR-FRB; c) direction of applied lateral displacement [8]](https://static-01.extrica.com/articles/21493/21493-img1.jpg)
a)
![a) Schematic diagram of RR-FRB, b) sample of tested RR-FRB; c) direction of applied lateral displacement [8]](https://static-01.extrica.com/articles/21493/21493-img2.jpg)
b)
![a) Schematic diagram of RR-FRB, b) sample of tested RR-FRB; c) direction of applied lateral displacement [8]](https://static-01.extrica.com/articles/21493/21493-img3.jpg)
c)
Fig. 2a) Applied displacement time history; b) experimental hysteresis loops of the tested RR-FRB obtained in 45° loading direction [8]
![a) Applied displacement time history; b) experimental hysteresis loops of the tested RR-FRB obtained in 45° loading direction [8]](https://static-01.extrica.com/articles/21493/21493-img4.jpg)
a)
![a) Applied displacement time history; b) experimental hysteresis loops of the tested RR-FRB obtained in 45° loading direction [8]](https://static-01.extrica.com/articles/21493/21493-img5.jpg)
b)
Dynamic shear tests were carried out by Losanno et al. (2019) [8] on the unbonded RR-FRB by imposing a horizontal displacement of increasing amplitude from 10 mm to 45 mm, with a frequency of 0.87 Hz. The stable response of the bearing, obtained by applying the displacement along its diagonal, is shown in Fig. 1(b). The applied displacement time history and the restoring force-lateral displacement loops displayed by the tested RR-FRB are shown in Fig. 2(a, b), respectively. It can be noted that the peak transverse displacement of the bearing is 40.4 mm, which is approximately equal to , where is the base width of the bearing. Full details on the experimental study is available in Losanno et al. (2019) [8], where the reader is referred to.
3. Hysteresis models
The dynamic properties of the rubber bearings highly influence the response of base-isolated structures. Therefore, the identification of a suitable hysteresis model, to represent the nonlinear behaviour of such bearings, is necessary. Several hysteresis models are available in the literature, from simple bilinear models to more complex models developed for specific applications [35, 36].
The most commonly used BWM and a novel class of uniaxial phenomenological models are considered in the present study to simulate the behaviour of the tested RR-FRB illustrated in Section 2. In particular, the BWM and two specific cases of the uniaxial phenomenological model family, namely the Bilinear Model (BM) and the Exponential Model (EM), are briefly presented in the following subsections.
3.1. Bouc-Wen model
The BWM is based on the Duhem hysteresis operator and it is governed by a first-order nonlinear ordinary differential equation characterized by six parameters that govern the size and shape of the hysteresis loops. The model offers the possibility of simulating a smooth transition between elastic and post-elastic states [37, 38].
According to such a differential model, the generalized force of a mechanical system is given by:
where is a dimensionless parameter, and are parameters with dimensions of stiffness and displacement, respectively, is the generalized displacement, whereas is a dimensionless variable which can be obtained from:
where , , , and are dimensionless parameters which control the shape of the hysteresis loops.
It is evident that the BWM needs seven parameters (, , , , , , and ) to be calibrated according to the experimental hysteresis loops.
3.2. Bilinear and exponential models
The proposed uniaxial phenomenological models belong to a family of models recently developed by Vaiana et al. (2018) to simulate the hysteretic behaviour of mechanical systems and materials [29]. The major advantage of this formulation is the requirement of a reduced number of parameters, having mechanical significance, and the need of a small computational effort compared to other widely used hysteretic models available in the literature.
The generalized tangent stiffness characterizing a generic model of such a family can be obtained by the sum of and which represent, respectively, the generalized tangent stiffness of an elastic spring and the generalized tangent stiffness of a hysteretic spring that is put in parallel to the previous one.
Specifically, the general form of the generalized tangent stiffness is given by:
where is the generalized displacement, and is the history variable, which is represented as and for the generic loading and unloading cases, respectively.
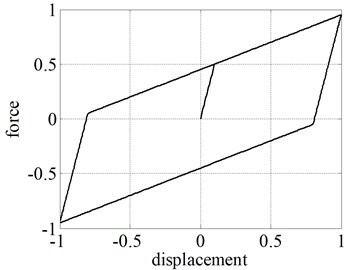
The two instances of the class of models considered in the present study, namely the BM and the EM are developed, based on the general formulation, by selecting suitable tangent stiffness functions. The BM is the simplest model and it can simulate only hysteresis loops limited by two parallel straight lines. On the contrary, the EM can effectively reproduce the hysteretic behaviour of complex systems with hysteresis loops limited by two parallel straight lines or curves.
3.2.1. Bilinear model
The generalized tangent stiffness functions of the BM are as follows:
The three parameters that require to be calibrated are , , and , with the following assumptions: > , > 0, and > 0.
The expressions for the upper and lower limiting curves are given by:
The generic loading and unloading curves are represented by:
where is an internal model parameter that can be derived from the following expression:
The expressions of the history variable for the loading and unloading cases can be obtained, respectively, from the following expressions:
With the above set of expressions, hysteresis loops limited by two parallel straight lines, as the one shown in Fig. 3, can be conveniently simulated by computing the generalized force, during the loading phase, as:
and, during the unloading phase, as:
Fig. 3Typical hysteresis loop limited by two parallel straight lines obtained from BM
3.2.2. Exponential model
The generalized tangent stiffness functions of the EM are given by the following set of expressions:
The four model parameters that need to be calibrated from the experimental tests are , , , and , with > , > 0, > 0, > 0, and a real number.
The expressions for upper and lower limiting curves are as follows:
The generic loading and unloading curves are represented by:
The internal model parameter is given by:
Finally, the history variable expressions for the loading and unloading cases are, respectively, as follows:
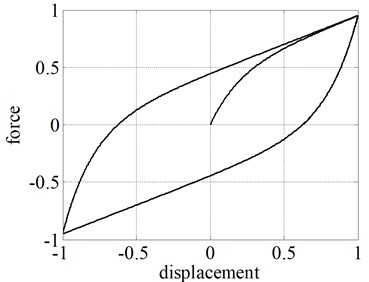
The EM can effectively simulate the hysteretic behaviour of mechanical systems with hysteretic loops limited by two parallel straight lines or curves. The size and shape of the hysteresis loops, reproduced by using Eqs. (14-15), are highly influenced by the four model parameters. A typical hysteresis loop limited by two parallel straight lines, simulated from EM for , is shown in Fig. 4.
Fig. 4Typical hysteresis loop limited by two parallel curves obtained from EM
4. Calibration of models and comparison with experimental results
The model parameters are identified using the Particle Swarm Optimization (PSO) algorithm [32, 39]. As other identification procedures available in the literature [39], this evolutionary computation technique has been proved to be efficient in parameter identification of hysteresis models [40]. In the algorithm, the model parameters are initialized randomly within certain boundaries, which are then modified to reach the optimum solution by iterations. The algorithm allows one to find the best solution by also taking into account the interaction of each parameter with the other ones. The Root-Mean Square Error (RMSE) between the restoring force from the experimental results and the one simulated by the model under consideration is selected as objective Function F, which is given by:
where is the experimental value of the restoring force of RR-FRB, whereas is the restoring force calculated according to the hysteresis model.
The following PSO parameters are used to avoid premature convergence of the solution in the local optimum points:
– population size: 100,
– number of iterations: 500,
– accelerations factors: ,
– maximum and minimum inertia weights: and .
The experimental hysteresis loops corresponding to the displacement of 35 mm are considered for the calibration of model parameters. The hysteresis loops obtained for bigger displacement values are not taken into consideration since they are characterized by a negative tangent stiffness and, consequently, are related to an unstable behaviour of RR-FRBs.
At each iteration, the algorithm runs the particular hysteresis model under consideration with a randomly selected values of model parameters and calculates the objective function. At successive iterations, the model parameters that better represents the experimental behaviour of RR-FRM will be obtained with the reduction in the objective function.
The parameters of the BWM, BM, and EM, that allow one to represent the hysteretic behaviour of the tested RR-FRB, are listed in Table 1, 2, and 3, respectively. The comparison of hysteresis loops is shown in Fig. 5. It can be clearly seen that the BWM and EM represent accurately the behaviour of the bearing. The comparison of results is given in Table 4. However, there exists significant difference in terms of computational effort between the two models.
Table 1BWM parameters
(N/m) | (m) | |||||
150000.00 | 0.2667 | 0.01 | 1.00 | 1.00 | 0.00 | 1.00 |
Table 2BM parameters
(N/m) | (N/m) | (m) |
255840.98 | 39597.39 | 0.0052 |
Table 3EM parameters
(N/m) | (N/m) | (1/m) | (N/m) |
255840.98 | 39597.39 | 96.89 | 0.00 |
Fig. 5Calibration of hysteretic models on the basis of the experimental results
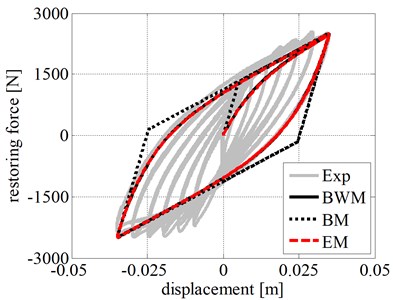
The models programmed in MATLAB were run in a computer with an Intel®Core™ i5-5200U processor and 2.20 GHz CPU with 8.00 GB RAM. The computational time of BWM is 17.23 s, whereas the EM requires only 0.04 s, namely the 0.2 % of the BWM computational time. In addition to the reduced run time, the smaller number of the EM parameters and their physical significance helps in making the calibration process much easier. On the other hand, the computational time of the BM is only 0.002 s, but the representation of hysteresis loops with smooth curves is not possible with this model being less accurate than BM and BWM. Despite this disadvantage, BM can be conveniently used for applications with preliminary simplified modelling of bearings to reduce the computational effort of the analyses.
5. Nonlinear time history analyses
The calibration of the adopted hysteretic models, illustrated in Section 4, clearly indicates that both the BWM and the EM can effectively represent the behaviour of RR-FRBs. In this section, the main results of some nonlinear time history analyses are presented to demonstrate the accuracy and the computational features of the different models when employed in the response analyses of base-isolated structures with RR-FRBs.
Table 4Comparison of experimental and numerical results
Model | Restoring force [N] | |||
Max | % Error | Min | % Error | |
Experimental | 2515.50 | – | 2488.60 | – |
BWM | 2498.80 | –0.66 | 2498.80 | +0.41 |
BM | 2510.40 | –0.20 | 2510.40 | +0.87 |
EM | 2499.30 | –0.64 | 2499.30 | +0.43 |
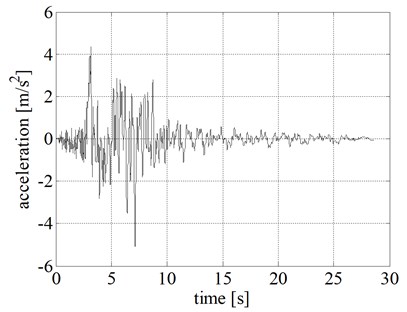
A rigid block of mass 1000 kg, resting on two RR-FRBs, is considered in the analyses. The base-isolated rigid block is shown in Fig. 6. The system is excited by imposing the Northridge acceleration time history record, shown in Fig. 7, and the equation of motion of the base-isolated structure is numerically solved using the central difference method with a time step of 0.005 s. Such a time integration method represents one of the most efficient methods available in the literature [41, 42].
Fig. 6Base-isolated rigid block with RR-FRBs
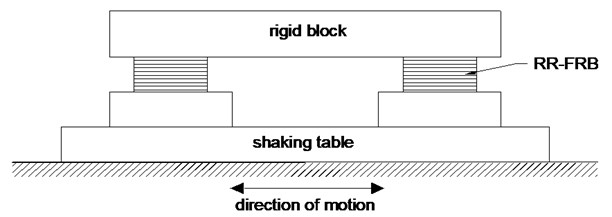
Fig. 7Ground acceleration time history of Northridge earthquake
The results of the nonlinear time history analyses are listed in Table 5. We can observe that the maximum and minimum rigid block relative displacements (), velocities (), and accelerations () obtained by adopting the BWM and the EM are almost equal. On the contrary, the BM underestimates the peak displacement and velocity values and overestimates the peak acceleration values. The computational effort of the models is compared in terms of total computational time (tct) and normalized total computational time (tctp) that provide the most relevant measure of the advantage of the BM and EM compared to BWM. Specifically, a significant reduction in the run time is observed in both BM (0.70 % of BWM) and EM (0.25 % of BWM), compared to BWM.
Table 5Nonlinear time history analyses results – Northridge Earthquake
Model | tct (s) | tctp | (m) | (m/s) | (m/s2) | |||
max | min | max | min | max | min | |||
BWM | 115.763 | – | 0.018 | –0.013 | 0.247 | –0.286 | 5.368 | –6.581 |
BM | 0.809 | 0.70 % | 0.017 | –0.010 | 0.235 | –0.209 | 6.834 | –6.427 |
EM | 0.286 | 0.25 % | 0.018 | –0.013 | 0.245 | –0.284 | 5.314 | –6.628 |
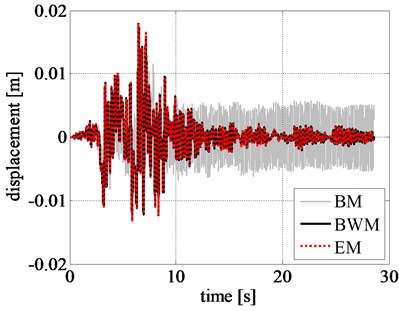
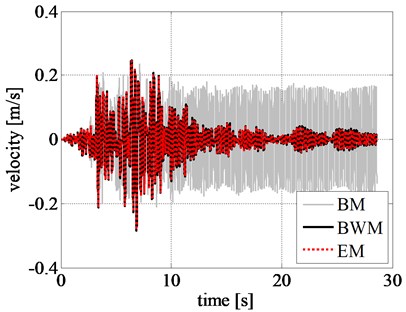
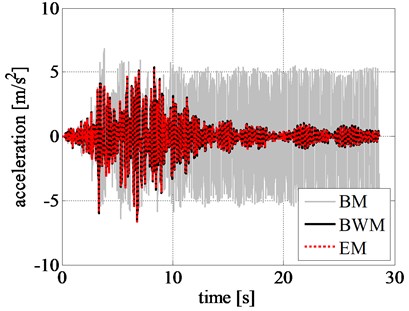
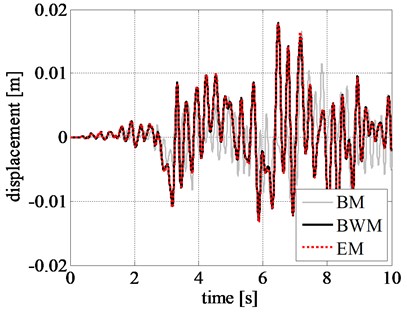
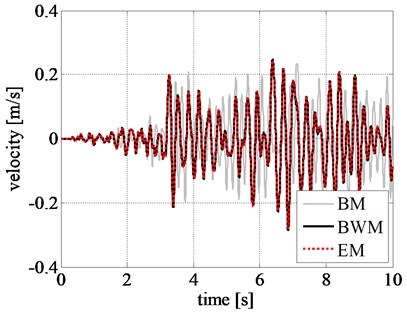
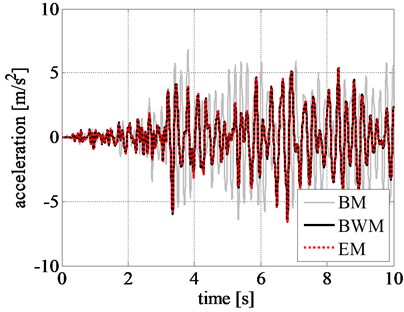
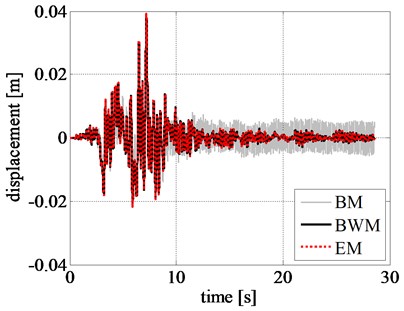
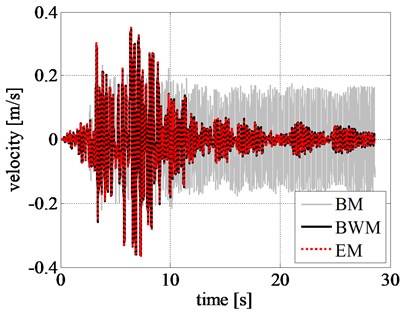
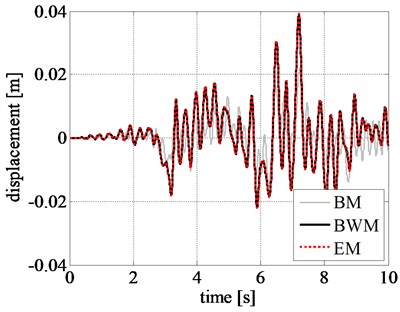
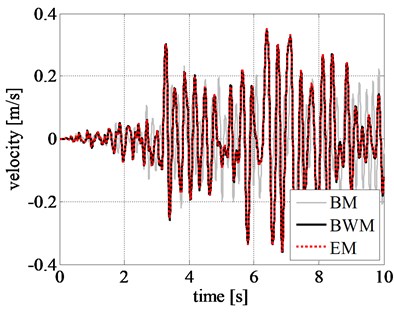
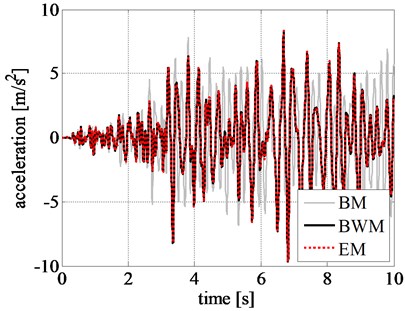
The displacement, velocity, and acceleration time histories of the rigid block obtained by using different models are shown in Figs. 8(a), 8(b), and 8(c), respectively. Comparing the displacement time histories of the phenomenological models, the ones related to EM and BWM show a good agreement.
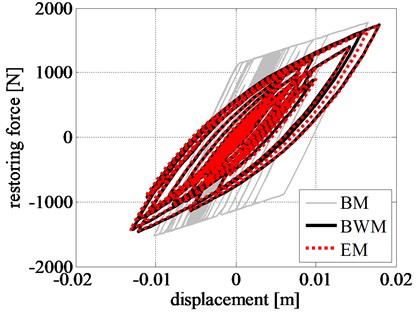
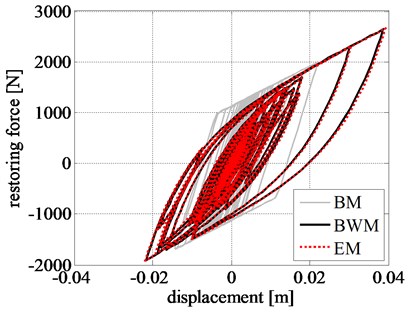
The restoring force-displacement hysteresis loops of the left RR-FRB are shown in Fig. 8(d). Restoring force estimated from EM and BWM are in very good agreement throughout the time history, whose peak value is also well approximated by BM with an error of 2.20%. The curve shape obtained from the BM clearly remarks loss of accuracy in predicting a softer transition between linear and nonlinear range.
Fig. 8Comparison of rigid block: a) displacement time history, b) velocity time history, c) acceleration time history, and d) left RR-FRB force-displacement loops obtained for the Northridge earthquake
a)
b)
c)
d)
In addition, the pattern of response time histories of rigid block, obtained by BM, considerably differs from that of BWM. Although the maximum displacement values from BM are close to that from BWM in the initial stage of excitation, namely during the first 9 seconds, as shown in Fig. 9, the results are highly inconsistent after 10 s where a larger displacement is observed from BM. The same trend is also observed in the velocity and acceleration time histories of the rigid block.
Fig. 9Comparison of rigid block relative response at initial excitation: a) displacement time history, b) velocity time history, and c) acceleration time history obtained for the Northridge earthquake
a)
b)
c)
In order to check the accuracy of the hysteresis models in simulating the rigid block response at larger displacements, nonlinear time history analyses are also carried out by imposing the Northridge earthquake acceleration time history record amplified by a factor of 1.50; the related analysis results are listed in Table 6.
Table 6Nonlinear time history analyses results – Amplified Northridge Earthquake
Model | tct (s) | tctp | (m) | (m/s) | (m/s2) | |||
max | min | max | min | max | min | |||
BWM | 139.968 | – | 0.0387 | –0.0217 | 0.3456 | –0.3625 | 8.2673 | –9.6678 |
BM | 0.989 | 0.71 % | 0.0221 | –0.0143 | 0.2326 | –0.2417 | 7.7861 | –6.8543 |
EM | 0.298 | 0.21 % | 0.0392 | –0.0219 | 0.3495 | –0.3668 | 8.3435 | –9.6536 |
The normalized total computational times of BM and EM are still significantly smaller, highlighting the advantage of the class of phenomenological models in terms of computational efficiency.
The maximum and minimum values of rigid block relative displacements, velocities, and accelerations obtained by adopting EM are in good agreement with the results obtained by BWM. In case of BM, it underestimates the peak displacement, velocity, and acceleration of rigid block in comparison with the values estimated from BWM, with a variation of 42.90 %, 32.70 %, and 5.50 %, respectively. This shows the disadvantages associated with BM in simulating the response at larger displacements, typically providing higher stiffness and damping than smoother transition models.
The corresponding response time histories and the restoring force-displacement hysteresis loops are shown in Fig. 10. The hysteresis loops estimated from BWM and EM closely match with each other, whereas the loops obtained from BM are far inconsistent from that of BWM. The maximum restoring force estimated by BM is 24.30 % smaller than the value estimated by BWM, whereas the discrepancy in case of EM is only 0.70 %.
The displacement, velocity, and acceleration time histories of BWM and EM are in good agreement throughout the length of the record. Specifically, the maximum absolute value of the percentage errors, evaluated as the difference between the peak values, in terms of displacement, velocity, and acceleration, computed by the EM and the BWM, divided by the peak value given by the BWM and multiplied by 100, is smaller than 1.3 %.
On the contrary, the results obtained by adopting BM differs considerably. The difference can be observed even in the initial stage of excitation, unlike the previous results without amplification of ground acceleration. The reduced peak displacement, velocity, and acceleration estimated from BM, at the initial excitation stage, can be seen from Figs. 11(a), 11(b), and 11(c), respectively. This clearly specifies the inefficacy of BM in simulating the nonlinear responses.
Fig. 10Comparison of rigid block: a) displacement time history, b) velocity time history, c) acceleration time history, and d) left RR-FRB force-displacement loops obtained for the amplified Northridge earthquake
a)
b)
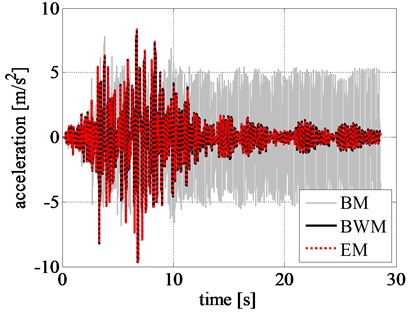
c)
d)
Fig. 11Comparison of rigid block relative response at initial excitation: a) displacement time history, b) velocity time history, and c) acceleration time history obtained for the amplified Northridge earthquake
a)
b)
c)
6. Conclusions
A preliminary comparative study on the use of a class of uniaxial phenomenological models (Bilinear model and Exponential model) and of the Bouc-Wen model has been carried out. In particular, the accuracy and the computational properties of such models have been assessed when they are employed to predict the experimental nonlinear restoring force displayed by recycled-rubber fibre-reinforced bearings.
The comparisons show that the exponential model is capable of reproducing experimental hysteresis shapes as done by the Bouc-Wen model, with the advantage of requiring a significantly reduced computational effort.
Nonlinear time history analyses have been carried out to identify the overall accuracy and computational features of the models. The hysteresis curves and response time histories of the exponential model are found to be in very good agreement with that of Bouc-Wen model. Considering the advantage of reduced run time of the exponential model (0.25% of BWM), it represents a very convenient option for the nonlinear time history analyses of base-isolated structures with RR-FRBs.
References
-
Losanno D., Hadad H. A., Serino G. Seismic behavior of isolated bridges with additional damping under far-field and near fault ground motion. Earthquakes and Structures, Vol. 13, Issue 2, 2017, p. 119-130.
-
Losanno D., Hadad H. A., Serino G. Design charts for eurocode-based design of elastomeric seismic isolation systems. Soil Dynamics and Earthquake Engineering, Vol. 119, 2019, p. 488-498.
-
Vaiana N., Sessa S., Paradiso M., Rosati L. Accurate and efficient modeling of the hysteretic behavior of sliding bearings. Proceedings of the 7th ECCOMAS Thematic Conference on Computational Methods in Structural Dynamics and Earthquake Engineering, 2019.
-
Vaiana N., Spizzuoco M., Serino G. Wire rope isolators for seismically base-isolated lightweight structures: experimental characterization and mathematical modeling. Engineering Structures, Vol. 140, 2017, p. 498-514.
-
Sessa S., Marmo F., Vaiana N., Rosati L. A computational strategy for Eurocode 8-compliant analyses of reinforced concrete structures by seismic envelopes. Journal of Earthquake Engineering, 2018, https://doi.org/10.1080/13632469.2018.1551161.
-
Losanno D., Spizzuoco M., Calabrese A. Bidirectional shaking‐table tests of unbonded recycled‐rubber fiber‐reinforced bearings (RR‐FRBs). Structural Control and Health Monitoring, Vol. 26, Issue 9, 2019, p. e2386.
-
Sierra I. E. M., Losanno D., Strano S., Marulanda J., Thomson P. Development and experimental behavior of HDR seismic isolators for low-rise residential buildings. Engineering Structures, Vol. 183, 2019, p. 894-906.
-
Losanno D., Sierra I. E. M., Spizzuoco M., Marulanda J., Thomson P. Experimental assessment and analytical modeling of novel fiber-reinforced isolators in unbounded configuration. Composite Structures, Vol. 212, 2019, p. 66-82.
-
Spizzuoco M., Calabrese A., Serino G. Innovative low-cost recycled rubber–fiber reinforced isolator: experimental tests and finite element analyses. Engineering Structures, Vol. 76, 2014, p. 99-111.
-
Losanno D., Sierra I. E. M., Spizzuoco M., Marulanda J., Thomson P. Experimental performance of unbonded polyester and carbon fiber reinforced elastomeric isolators under bidirectional seismic excitation. Engineering Structures, Vol. 209, 2019, p. 110003.
-
Russo G., Pauletta M., Cortesia A. A study on experimental shear behavior of fiber-reinforced elastomeric isolators with various fiber layouts, elastomers and aging conditions. Engineering Structures, Vol. 52, 2013, p. 422-433.
-
Toopchi‐Nezhad H., Tait M. J., Drysdale R. G. Testing and modeling of square carbon fiber‐reinforced elastomeric seismic isolators. Structural Control and Health Monitoring: The Official Journal of the International Association for Structural Control and Monitoring and of the European Association for the Control of Structures, Vol. 15, Issue 6, 2008, p. 876-900.
-
Al-Anany Y. M., Tait M. J. Fiber reinforced elastomeric isolators for the seismic isolation of bridges. Composite Structures, Vol. 160, 2017, p. 300-311.
-
Anvar V., Alexey Z., Artem T. Study of application of vibration isolators with quasi-zero stiffness for reducing dynamics loads on the foundation. Procedia Engineering, Vol. 176, 2017, p. 137-143.
-
Lupășteanu V., Soveja L., Lupășteanu R., Chingălată C. Installation of a base isolation system made of friction pendulum sliding isolators in a historic masonry orthodox church. Engineering Structures, Vol. 188, 2019, p. 369-381.
-
Pauletta M., Di Luca D., Russo E., Fumo C. Seismic rehabilitation of cultural heritage masonry buildings with unbonded fiber reinforced elastomeric isolators (U-FREIs) – A case of study. Journal of Cultural Heritage, Vol. 32, 2018, p. 84-97.
-
Valeev A., Kharisov S. Application of vibration isolators with a low stiffness for the strongly vibrating equipment. Procedia Engineering, Vol. 150, 2016, p. 641-646.
-
Iizuka M. A macroscopic model for predicting large-deformation behaviors of laminated rubber bearings. Engineering Structures, Vol. 22, Issue 4, 2000, p. 323-334.
-
Furukawa T., Ito M., Izawa K., Noori M. N. System identification of base-isolated building using seismic response data Journal of Engineering Mechanics, Vol. 131, Issue 3, 2005, p. 268-275.
-
Wada A., Kinoshita M. Elastic plastic dynamic 3-dimensional response analysis by using multiple shear spring model Part 1 and Part 2. Summaries of Technical Papers of Annual Meeting, 1985, p. 313-316.
-
Nagarajaiah S., Xiaohong S. Response of base-isolated USC hospital building in Northridge earthquake. Journal of structural engineering, Vol. 126, Issue 10, 2000, p. 1177-1186.
-
Naeim F., Kelly J. M. Design of Seismic Isolated Structures: from Theory to Practice. John Wiley & Sons, 1999.
-
Feng D., Miyama T., Torii T., Yoshida S., Ikenaga M., Shimoda I. A new analytical model for the lead rubber bearing. Proceedings 12WCEE, 2000.
-
Charalampakis A. E., Koumousis V. K. Identification of Bouc-Wen hysteretic systems by a hybrid evolutionary algorithm. Journal of Sound and Vibration, Vol. 314, Issues 3-5, 2008, p. 571-585.
-
Thyagarajan R. S., Iwan W. D. Performance characteristics of a widely used hysteretic model in structural dynamics. 4th US National Conference on Earthquake Engineering, 1990.
-
Toopchi-Nezhad H., Tait M. J., Drysdale R. G. A novel elastomeric base isolation system for seismic mitigation of low-rise buildings. Proceedings of the 14th World Conference on Earthquake Engineering, 2008.
-
Manzoori A., Toopchi-Nezhad H. Application of an extended Bouc-Wen model in seismic response prediction of unbonded fiber-reinforced isolators. Journal of Earthquake Engineering, Vol. 21, Issue 1, 2017, p. 87-104.
-
Vaiana N., Sessa S., Rosati L. A generalized class of uniaxial rate-independent models for simulating asymmetric mechanical hysteresis phenomena. Mechanical Systems and Signal Processing, Vol. 146, 2021, p. 106984.
-
Vaiana N., Sessa S., Marmo F., Rosati L. A class of uniaxial phenomenological models for simulating hysteretic phenomena in rate-independent mechanical systems and materials. Nonlinear Dynamics, Vol. 93, Issue 3, 2018, p. 1647-1669.
-
Vaiana N., Sessa S., Marmo F., Rosati L. An accurate and computationally efficient uniaxial phenomenological model for steel and fiber reinforced elastomeric bearings. Composite Structures, Vol. 211, 2019, p. 196-212.
-
Vaiana N., Sessa S., Marmo F., Rosati L. Nonlinear dynamic analysis of hysteretic mechanical systems by combining a novel rate-independent model and an explicit time integration method. Nonlinear Dynamics, Vol. 98, Issue 4, 2019, p. 2879-2901.
-
Kennedy J., Eberhart R. Particle swarm optimization. Proceedings of International Conference on Neural Networks, Vol. 4, 1995, p. 1942-1948.
-
Calabrese A., Losanno D., Spizzuoco M., Strano S., Terzo M. Recycled rubber fiber reinforced bearings (RR-FRBs) as base isolators for residential buildings in developing countries: The demonstration building of Pasir Badak, Indonesia. Engineering Structures, Vol. 192, 2019, p. 126-144.
-
Losanno D., Calabrese A., Madera-Sierra I. E., Spizzuoco M., Marulanda J., Thomson P., Serino G. Recycled versus natural-rubber fiber-reinforced bearings for base isolation: review of the experimental findings. Journal of Earthquake Engineering, 2020, https://doi.org/10.1080/13632469.2020.1748764.
-
Lubliner J. Plasticity Theory. Courier Corporation, 2008.
-
Tsai C. S., Chiang T. C., Chen B. J., Lin S. B. An advanced analytical model for high damping rubber bearings. Earthquake Engineering and Structural Dynamics, Vol. 32, Issue 9, 2003, p. 1373-1387.
-
Wen Y. K. Method for random vibration of hysteretic systems. Journal of the Engineering Mechanics Division, Vol. 102, Issue 2, 1976, p. 249-263.
-
Wen Y. K. Equivalent linearization for hysteretic systems under random excitation. Journal of Applied Mechanics, Vol. 47, Issue 1, 1980, p. 150-154.
-
Eberhart R. C., Shi Y. Comparison between genetic algorithms and particle swarm optimization. International Conference on Evolutionary Programming. Springer, Berlin, Heidelberg, 1998, p. 611-616.
-
Ye M., Wang X. Parameter estimation of the Bouc-Wen hysteresis model using particle swarm optimization. Smart Materials and Structures, Vol. 16, Issue 6, 2007, p. 2341.
-
Greco F., Luciano R., Serino G., Vaiana N. A mixed explicit–implicit time integration approach for nonlinear analysis of base-isolated structures. Annals of Solid and Structural Mechanics, Vol. 10, Issues 1-2, 2018, p. 17-29.
-
Vaiana N., Sessa S., Paradiso M., Marmo F., Rosati L. An efficient computational strategy for nonlinear time history analysis of seismically base-isolated structures. Conference of the Italian Association of Theoretical and Applied Mechanics, Springer, Cham 2020, p. 1340-1353.
Cited by
About this article

This research was carried out in the frame of Programme STAR (2017 LO-CO-ISO project), financially supported by UniNA and Compagnia di San Paolo.
