Abstract
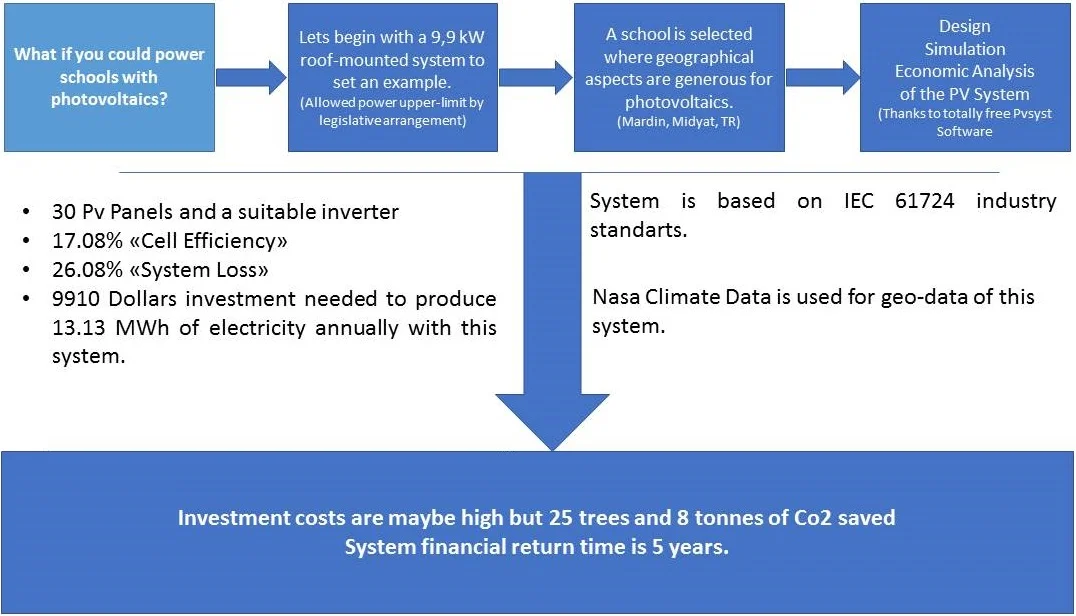
Turkey has a young population. Accordingly, 66849 schools are serving under the Ministry of National Education. This amount of school naturally causes large amounts of electrical energy demand. Supporting even a small part of these schools with renewable energy sources will provide enormous economic and environmental contributions. Moreover, school buildings often share a template architecture, so a design can be reused, with some modifications over and over again. In this study, the PVsyst software is used to design a 9.9 kWp, roof-mounted, and grid-connected photovoltaic system. The technical and economic consequences of the study are widely reported within. IEC 61724 standards, which is a framework solar industry standard, is applied. Depending on the results, the system can generate 13.13 MWh of electricity annually, 6.43 MWh of which the consumer uses, and 6.70 MWh could be sold to the network. Selling electricity is limited by legislative regulations. But the demand for energy is a fact that never changes. As a result, PV cell efficiency is 17.09 %, and total system loss was approximately 26.18 %. The project cost was calculated as roughly $9912 in the year 2020, based on current prices for a standard system. Total economic earnings from sales are determined as approximately $1375. The return period of the investment was calculated as five years. It is anticipated that the engineering practice carried out in this study will prevent 8 tons of CO2 emissions annually and will save approximately 25 trees per year. It is recommended that this study be put into practice and disseminated.
Highlights
- Economic and environmental benefits are great and results are highly beneficial long term.
- Design and analysis of photovoltaic systems for a school.
- The technical and economic consequences of the Solar Energy.
- The PVsyst software is used to design a 9.9 kWp, roof-mounted, and grid-connected photovoltaic system.
- The system can generate 13.13 MWh of electricity annually, 6.43 MWh of which the consumer uses, and 6.70 MWh could be sold to the network.
- Investment costs are maybe high but 25 trees and 8 tons of CO2 saved System financial return time is 5 years.
1. Introduction
The energy cycle is described as the basic building block of nature. With the discovery and utilization of energy, the quality and form of human life also changed and enhanced. Societies that can satisfactorily handle the energy live in prosperity. Today, energy is considered as the main indicator of economic and social development. The need for energy is increasing gradually due to technological developments and industrial production [1-3]. Fossil, nuclear, renewable energy sources are used in the production of electric energy, Fossil resources are variable such as coal, oil, and natural gas. They are expected to be depleted soon. Renewable energy sources can be classified as Hydraulics, Biomass, Geothermal, Tidal, Wind, and Solar energy [4-6]. Renewable energy sources are at the center of the transition to a sustainable energy system. Also, these sources are considered environmentally friendly as they cause fewer carbon emissions than fossil sources [7]. According to the International Energy Agency (IEA-International Energy Agency), 2018 data, electricity production from renewable energy sources increased by 7 %, while wind and solar PV technologies account for 60 % of the increase in this production [8]. Besides, due to the high energy demand in 2018, global CO2 emissions reached 33.1 Gt (Gigaton), with an increase of 1.7 %. While emissions from fossil fuels continue to increase, it is stated that the energy sector accounts for approximately two-thirds of this emission increase. [9] This situation requires renewable energy applications and a rapid transition to clean energy. Solar energy is the energy released during the conversion of hydrogen gas in the sun's core into helium. The intensity of this radiation energy is approximately 1370 W/m2 (Watt / square meter) outside the world atmosphere; however, the part reaching the earth changes between 0 and 1100 W/m2 due to factors such as the Earth's atmosphere and clouding [10]. Cells that convert sunlight into electrical energy are defined as photovoltaic (PV- photovoltaics) cells. Photovoltaic cells are produced from semiconductor materials [11]. PV panels are produced by joining these cells in serial or parallel form. Also, PV systems include inverters that convert DC electric current into AC. [12]. Solar energy potential is quite high in Turkey and the study area.
According to the International Energy Agency's November 2019 report, the current energy system is still far from the climate change targets set in the Paris Climate Agreement. [13] In this context, in Turkey, and the World, deploying roof type Pv panels to schools is expected to contribute to the rapid energy transition. Furthermore, such an initiative may create maybe millions of jobs and contribute to education and awareness-raising at schools.
2. Methodology
2.1. Solar energy potential and related values in Turkey and the study area
This study is simply is a “what if” work about meeting the energy demands of a regular school building with a roof-installed photovoltaic system. Although renewable energy transition is the ultimate goal of mankind, and Pv is such a popular topic, researchers should consider that Pv applications are yet expensive, and Pv cells are only produced by a few countries, so it is an import item. This study, apart from pure science, takes these constraints as limiting elements. With Pvsyst software, the system is designed on-grid to respond to the needs in case of insufficient daylight and to supply the surplus of production to the network. System performance analysis is specified in IEC 61724 standards. Up to 10 kWp (kilowatt peak) installed power within the framework of the legislation determined by the Energy Market Supervision Agency for “Unlicensed Production Applications and Evaluation of Excess Demand Energy” is allowed. So 9.9 kWp as output targeted, design, and analysis are carried on accordingly [14]. A large part of Turkey is located in the sunbelt. No doubt that Turkey has a very favorable geographic location from the aspect of solar power. Fig. 1 shows that the whole country has a prospering and promising solar potential. The dark orange areas show the regions receiving the highest solar radiation. Yellow areas represent regions with less radiation. There is a little part of a green color code that can be neglected when discussing solar potential. The study area, Mardin Midyat, is marked with a star that is located in a region with grand potential.
Fig. 1Turkey solar energy potential atlas [15]
![Turkey solar energy potential atlas [15]](https://static-01.extrica.com/articles/21499/21499-img1.jpg)
Fig. 2Global radiation values and sunbathing hours in Turkey
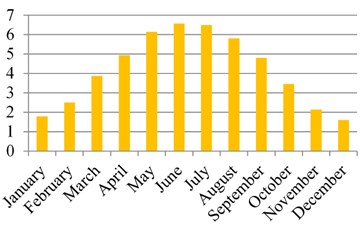
a) Turkey global radiation values (kWh/m2-day)
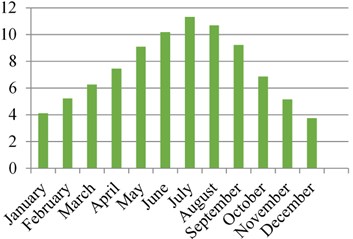
b) Turkey sunbathing times (Hours) [10]
Fig. 2 show global radiation values and sunbathing hours in Turkey. The highest daily global radiation average is 6.57 kWh/m2 day (kilowatts hour/square meter-day) in June, and the lowest value is 1.59 kWh/m2 day in December. The longest sunbathing time is in July with 11.31 hours, and the shortest time is in December with 3.75 hours. Also, the average annual sunshine duration was calculated at 7.5 hours.
Fig. 3 shows the amount of total theoretical energy production could be achieved in the field, without economic or technical constraints. Mono-crystalline cells have the highest values, followed by polycrystalline cells; these cells (mono and poly) have a higher energy production capacity than other cell types.
Fig. 3Turkey PV panel type-area (m2) – annual energy that can be produced (kWh-Year)
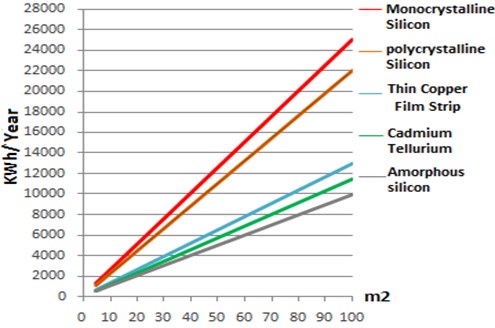
Fig. 4Midyat monthly average sunbathing times
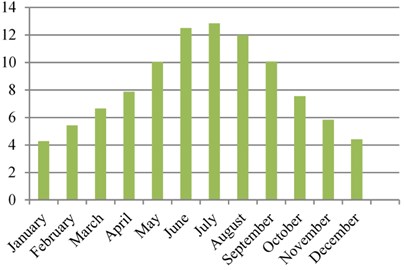
Study area; Midyat is located in the Southeastern part of Turkey is a county of Mardin. With a daily average of 8.29 hours of sunshine and an annual average of 1874 kWh/m2 per year, the county is located in the most suitable part of Turkey by means of horizontal irradiation values. The inclined irradiation value at the optimum angle for Midyat is 2139 kWh/m2-year [15]. As satellite data submits, direct typical radiation values for Midyat are found in June with the highest average 9,011 kWh/m2-day and in January with the lowest 3,221 kWh/m2-day. On an annual basis, the days average is calculated as approximately 5,773 kWh/m2-day. Fig. 4 shows that the longest sunbathing period is 12.84 hours/day in July, and the shortest period is 4.28 hours/day in January. The annual average sunshine duration is 8.29 hours/day.
Fig. 5 presents the highest energy production in PV panel efficiency is mono-crystalline cells in Midyat. However, due to the high cost of this type of cell, polycrystalline cells are widely favored in the World. For this reason, Poly-crystalline cells will be preferred rather than mono-crystalline cells.
Fig. 5Midyat PV panel type-area (m2) – producible annual energy (kWh-Year) [16]
![Midyat PV panel type-area (m2) – producible annual energy (kWh-Year) [16]](https://static-01.extrica.com/articles/21499/21499-img6.jpg)
2.2. About the software
PVsyst is a Pv system design and simulation software developed by the University of Geneva, Switzerland. Software is capable of designing both on-grid or off-grid PV systems. The geographic data needed to design the Pv system is offered with a built-in feature in software with Meteonorm 7.2 or NASA-SSE databases. Besides, the software allows the user to simulate and analyze the Pv system and generates economic reports. This user-friendly and free software is a powerful decision support system [17, 18].
2.3. System components of a photovoltaic system
A photovoltaic (PV) system consists of a PV array (connecting PV panels in series or parallel), energy storage and power conditioning elements (Inverter, Battery charger, etc.). The PV system converts solar energy into DC (Direct Current) electrical energy. In case of system, loads use AC (Alternating current) or the energy is going to be sold to the network. An inverter must be used in the system to convert the direct current DC into alternating current AC.
There are two types of PV systems, on-grid or off-grid systems. These systems are either connected or not connected to the grid. Grid-connected systems supply energy directly to the grid in the absence of. In the absence of production, the energy needs are met from the grid [19]. In a standalone system, the power produced in PV modules is directly connected to the DC load or AC load using an inverter. In the absence of a load to draw power from the PV array, DC electrical energy produced by PV panels can be stored using storage elements such as batteries [20, 21, 22]. However, since the energy storage elements increase the system cost, they will not be used in this project.
2.4. Designing the exemplary system to be analyzed
In this section, the design steps of a grid-connected PV (Photovoltaics-Photovoltaic) system with the PVsyst program is summarized.
2.4.1. Processing the geo-data with PVsyst software
The geo-data for the study area is gathered from the built-in feature of software through NASA-SSE database, Weather parameters are selected from “Project Design” and “Grid Connected” system sections from the program home page and selecting the “Fetch” tab shown in Fig. 6 through the “Weather Database” section.
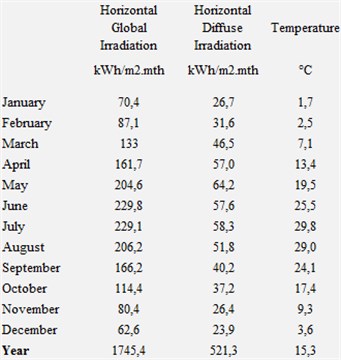
The project analysis will be made based on the Global Horizontal Radiation values specified in Figs. 6 and 7, and the results will be interpreted according to these data.
Fig. 6Geographic location and acquisition of location parameters via NASA-SSE in PVsyst software
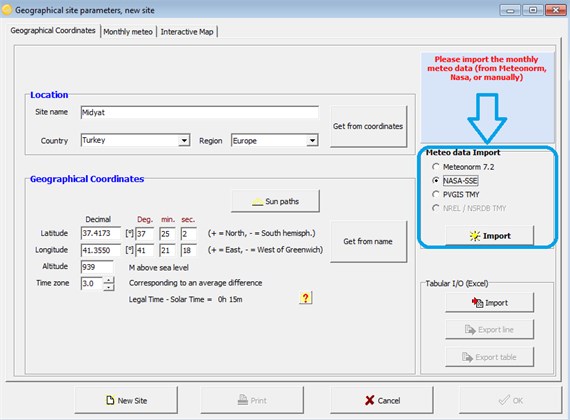
Fig. 7Global horizontal radiation values received through NASA-SSE
2.4.2. Calculation of the azimuth angle
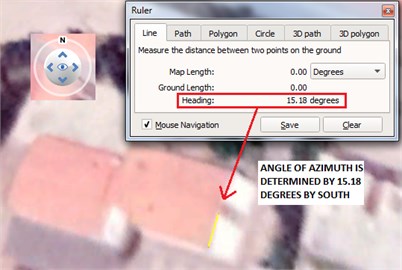
The Sun Azimuth angle is the angle value made by the projection of the Sun-Earth direction in the horizontal plane with the North-South direction, which is taken as a positive clockwise direction [23]. In this study, the azimuth angle was determined as approximately 15 degrees via the “Google Earth Pro” program, as shown in Fig. 8.
Fig. 8Azimuth and Tilt angles used in PV panel routing
2.4.3. Calculation of the PV panel tilt angle
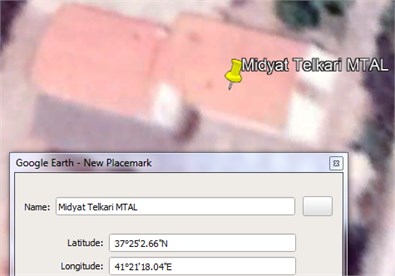
The tilt angle is the value between the PV panel and the ground [23]. In other words, it can be defined as the angle between the floor with a slope of 0 % and PV panels that are positioned. The tilt angle of the PV panels varies on the latitude value of the desired system location. Since the tilt angle significantly affects the efficiency of the PV system, it is necessary to have the appropriate tilt angle to achieve maximum efficiency. The latitude value of the project location is 37 ° 25'2.66 "N through Google Earth Pro, as seen in Fig. 9.
Fig. 9Finding latitude value via Google Earth Pro
In this project, the Pv system will be installed on the school roofing. The roof slope is calculated as 14.74° Optimum panel tilt angle is calculated as 35,5° by latitude. To achieve 35,5° panel tilt on a 14.74° sloped roof, steel construction will be required. But as the budgeting is a concern for this study to be feasible, PV panels will be positioned at zero angles to the school roof floor. So the roof slope angle of 14.74° will be considered as the PV panel tilt angle. However, since the tilt angle data input must be an integer in the PVsyst analysis program, the angle value will be taken as an approximate value of 15° instead of 14.74°. The software calculates the annual losses that will occur as a result of entering the estimated azimuth and tilt angles to the PVsyst “Guidance” section.
2.5. PV panel and inverter selection
While designing the system, calculations are going to be based on the upper legal limit of 9.9 kWp (kilowatt peak). An inverter will be added to the system because of the need for AC. In economic analyses, actual electric consumption of the school will be handled. The school building has a working and healthy electric network. Silicon polycrystalline PV cells are preferred as PV technology. These cells are common-wide because their prices are relatively affordable and have the highest productivity after mono-crystalline PV cells [24]. The PV panel parameters selected based on the IEC 61724 Standards are given in Table 1.
Table 1Electrical and mechanical values of the selected PV panel
Reference Temperature 25 C°, Reference Radiation 1000 w/m2 | |
PV panel technology | Silisyum Polycrystal |
Nominal PV panel power | 330 Wp (Watt peak) |
VOC (Open circuit voltage) | 45.9 Volt |
Vmpp (Nominal voltage) | 37.3 Volt |
Impp (Nominal current) | 8.85 Amper |
Length × Width × Thickness, Area, Weight | 1956×992×40 mm, 1,940 m2, 22,50 kg |
To produce 9.9 kWp nominal electric power, a total of 30 pieces of 330 Wp PV panels are needed, in the form of 2 parallel arrays 15 modules will be placed to each line. An area of approximately 58 m2 is needed for total of 30 PV panels. The total roof area is measured as approximately 157 m2 by Google Earth Pro in Fig. 10. In this case, the total roof area is adequate to establish the PV system.
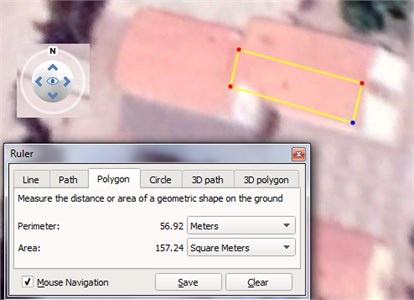
Fig. 10. Calculation of the area to be applied with Google Earth Pro
There are types of inverters since this proposed system is on-grid, the inverter must be grid-connected. Grid-connected inverters must supply current to the grid in the form of sine, and in the event of a power failure, it must be disconnected from the grid. However, these inverters should ensure maximum power withdrawal from photovoltaic panels continuously [25-26]. The electrical data of the inverter selected over PVsyst are given in Table 2.
The selected inverter is grid-connected and has MPPT (Maximum Power Point Tracker) feature.
Table 2Electrical data of the selected inverter
Reference Temperature 25 C°, for 1 | |
Input parameters | 175-850 , 17 A |
Output parameters | Three-phase 400 , 50 Hz, 10 kW, productivity max = % 97,60 |
Inverters used | One piece |
2.6. Consumption data
Design can be made in the PVsyst software according to consumption data on a daily, monthly, or annual basis. Design is made by inputting the power and power usage periods of the buyers at the consumption point. For this study, monthly consumption data given in Table 3 is taken into consideration as kWh/month.
Fig. 11Monthly electricity consumption data (kWh / month)
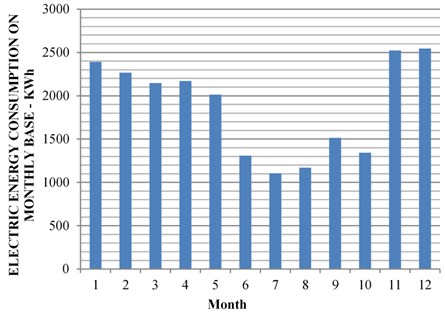
Table 3Monthly electricity consumption data (kWh / month)
January | 2392 | July | 1103 |
February | 2267 | August | 1171 |
March | 2148 | September | 1514 |
Engagement | 2170 | October | 1344 |
May | 2014 | November | 2523 |
June | 1308 | December | 2546 |
2.7. Determining the distant shading effect in the horizon line diagram
In the PVsyst software, remote shadowing can be performed over the horizon line diagram by selecting the “Horizon” tab among the additional options. This can be achieved by entering the values of “Sun Azimuth” and “Sun Altitude” determined in different periods. For this project, “Sun Azimuth” and “Sun Altitude” values are taken from the address suncalc.org.
2.8. Results and discussions on the simulation
As a result of the simulation made by PVsyst software, annual global horizontal irradiation is determined as 1745.5 kWh/m2, useful energy obtained at the PV array output is 13575 kWh/year, and the yearly average temperature value is 15.32 °C. The consumption values included in the monthly electricity bill belonging to the consumer are entered into the system; the annual consumption is calculated as 22500 kWh/year. While the PV system covered 6429 kWh/year of this consumption, 16071 kWh/year was covered by the grid. PV system injected 6701 kWh/year electric power into the grid during the periods when the receivers are not active is on an annual basis. The yearly net energy produced by the PV system has been determined as 13130 kWh. This solar system has supplied 6429 kWh of the annual electricity is provided to the consumer while injecting the remaining 6701 kWh into the grid. The ratio of energy was calculated as 0.287. Accordingly, the user met 28.6 % of his energy needs from the PV system. If the amount of electricity sold to the grid is included in this ratio, the ratio of total production (13130) to total consumption (22500) will be 0.584 (58.4 %). Considering the Photovoltaic System Performance Parameters (Reference Temperature 25 C0, Reference Radiation 1000 W/m2) specified in the IEC 61724 Standards, the ratio of the final efficiency () to the reference efficiency () will give the performance ratio [17, 27].
Equation Showing the Productivity Rate: .
For this study, the value is 3.63, and the value is 5.25. Annual average PR (Performance Ratio) is 0.692 (69.2 %). Besides, the average monthly PR value was observed the lowest (0.544) in December and the highest (0.752) in March. Performance Rates are lower in the summer months compared to March and April. In summer months, although the sunbathing time and solar radiation are higher than in other months, the increase in the temperature causes the lower PR value, so the efficiency of PV cells decreases.
Fig. 12Useful energy/losses chart by months
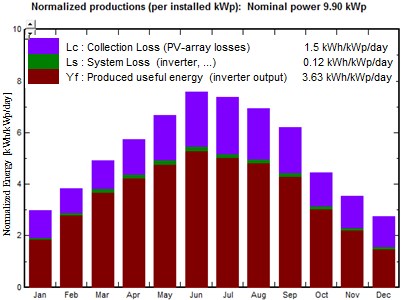
Fig. 12 shows that purple colored areas are PV array losses, green-colored areas represent system losses, and dark red areas represent useful energy (). The system losses increase depending on the temperature in the hot summer months. From the flow chart of system losses, it can be seen that the “Global Horizontal Irradiation” value is 1745.5 kWh/m2-year. After deducting the 10.94 % losses stated in the diagram, effective irradiation hitting the panels is 1555 kWh/m2-year. Since the total PV panel area is 58 m2, the total effective irradiation hitting the collector is 1555×58 = 90.19 MWh / m2-year. Since PV panel efficiency is determined as 17.09 % in standard test conditions (STC), ideally, the annual nominal energy amount of PV array will be calculated as 15.42 MWh-year. When the total of 12 % PV array and ohmic losses are deducted, it is concluded that the annual energy amount that can be given to the inverter input from the array output is 13.57 MWh-year. When the inverter losses (3.24 %) are removed, the amount of useful energy gained 13.13 MWh-year. In the previous sections, the consumer’s annual energy need is stated as 22.5 MWh-year. It was determined that the energy produced by the PV system and offered to the consumer is 6.43 MWh-year. This amount constitutes 28.6 % of consumption [(6.43/22.5)×100]. The electricity sold or injected into the grid during the periods of no consumption is 6.70 MWh-year. The energy needs of the consumer are met from the network during the periods when the daylight is insufficient.
3. Financial analysis of the system
The cost values shown in Table 4 were obtained by researching the current market prices for the rooftop type PV system with an installed power of 9.9 kWp. As a result of the analysis made in Table 5, the average annual earning value to be obtained from the system was calculated as $1375. Unit costs are written based on the monthly electricity bill dated April 2020. The decision that the cost of energy distribution in the sales direction will not be taken from the manufacturer for ten years after the commissioning of the facility is published in the official newspaper dated 26/06/2019 [28].
As shown in Table 6, the system’s return period is five years.
Table 4Average installation cost of the system
Costs | |||||
No. | Qty | Unit | Name of the product | Unit price ($) | Total ($) |
1 | 1 | Piece | Project costs and feasibility study | 1300 $ | 1300 |
2 | 30 | Piece | 330 wp solar panel single row vertical layout | 0,25 $/wp | 2475 |
3 | 1 | Piece | Grid-connected ten kW inverter (double mppt) | 1500 $ | 1500 |
4 | 1 | Set | Mechanical parts and parts required for assembly | 1100 | |
5 | 200 | Meters | Cabling | 1,20 $ | 240 |
6 | 1 | Set | Electrical panels and contents, mc4 connectors and other electrical system mounting elements | 270,00 $ | 270 |
7 | 1 | Piece | Surge protector | 125,00 $ | 125 |
8 | 10 | Meter | 5×4 nhxmh cable | 10,00 $ | 100 |
9 | 1 | Piece | Bidirectional digital counter | 100 $ | 100 |
10 | 1 | Meters | Shipping cost | 240,00 $ | 240 |
11 | 1 | Meters | Installation cost | 950,00 $ | 950,00 |
Vat excluded | 8400 $ | ||||
Vat % 18 | 1512 $ | ||||
Total | 9912 $ | ||||
Table 5Annual earnings calculation table resulting from sales and savings analysis
Production and savings analysis | |||||||||
Year | Consumption amount met from PV system (saved energy) | Energy cost TL / kWh | Energy distribution cost (in the direction of traction) TL / kWh | Misc. Taxes TL/kWh | Taxes and funds TL / kWh | Annual saving amount-TL | |||
1. Yıl | 6430 kWh/year | 0,5074 | 0,2355 | 0,1817 | 0,925 | 5948 | |||
Sales direction analysis – annual earnings in sales direction | |||||||||
Year | The amount of energy sold from the PV system to the grid | Unit sales price TL / kWh | Energy distribution cost × (in the direction of sales) TL / kWh | Annual earnings TL | |||||
1.yıl | 6700 kWh/year | 0,5074 | 0 | 3400 | |||||
Total annual earnings = saving amount + annual sales amount = 5948 + 3400 = 9348 TL | |||||||||
22/05/2020 1 Us dollar/ Turkish Lira exchange rate 6,80; Total Earnings in Dollars = 1375 $ | |||||||||
Table 6Return of the investment by years
Annual electricity price raise prediction | Year distribution | Annual investment recovery | Annual total | Annual investment recovery total |
% 10 | 1.yearl | $1.375,00 | $1.375,00 | –$9.912,00 |
% 10 | 2.year | $1.512,50 | $2.887,50 | –$7.024,50 |
% 10 | 3. year | $1.663,75 | $4.551,26 | –$5.360,74 |
% 10 | 4. year | $1.830,13 | $6.381,39 | –$3.530,61 |
% 10 | 5. year | $2.013,14 | $8.394,53 | –$1.517,47 |
% 10 | 6. year | $2.214,46 | $10.608,98 | $696,98 |
% 10 | 7. year | $2.435,90 | $13.044,88 | $3.132,88 |
% 10 | 8. year | $2.679,49 | $15.724,37 | $5.812,37 |
% 10 | 9. year | $2.947,44 | $18.671,81 | $8.759,81 |
% 10 | 10. year | $3.242,18 | $21.914,00 | $12.002,00 |
4. Conclusions
Turkey is located in a very convenient location in terms of renewable energy. Midyat, the study area, is located in Turkey’s most prosperous region in terms of solar energy. However, PV investments are meager in the area. For this reason, this study tries to exemplify a 10 kWp rooftop PV system design within the framework of legal regulations. The electric bills decide the actual monthly consumption data of the school. Due to the production of unlicensed electricity regulations, the PV system production power has been selected as 9.9 kWp, and the necessary operations have been made on this number. The whole study is performed with the PVsyst software, regarding the IEC 61724 standards, an estimation of 13.13 MWh of net energy annually is a successful result. 28.6 % of the annual consumption was met from the PV system, and the surplus 6,70 MWh-year generated is injected into the grid. The annual average performance rate of the system is 69.2 %. Monthly performance rates were highest in March as 0.752 and the lowest in December as 0.544. The decrease in the performance in the summer months, caused by increasing temperatures, eventually resulting in a decrease in the total efficiency of PV cells. PV array losses were 9.8 %, wiring losses were 1.4 %, and inverter losses were 3.24 % due to temperature. The efficiency of the PV panels used was determined as 17.09 % overall. The project installation cost was calculated as $9912 on 22/05/2020 based on current prices. Researchers kindly remark upon the USD/TL exchange rate will fluctuate the financial results. The total amount of annual savings and earnings is determined to be $1375. The guaranteed turnaround period of the investment cost is five years. This study finds Pv systems for schools to be useful if initial investment costs are compensated.
References
-
Sevim U., Ve Karaman G. Renewable energy investment and financing methods in turkey: investigation of past to present trends. Asia Studies-Academic Social Studies/Academic Social Research, Vol. 8, 2019, p. 97-109.
-
Bulut N., Kuncan M., Horoz S. Türkiye’de güneş enerjisinin kullanım alanları ve Siirt güneş enerji potansiyeli. Ahtamara 1st International Multidisciplinary Studies Congress Proceedings Book, Gevaş, Van-Türkiye, 2018.
-
Ayım Otu B., Kuncan M., Horoz S. Research on renewable energy (solar) in Ghana. International Science and Engineering Symposium, Siirt, Türkiye, 2019.
-
Koç E., Şenel M. C. In Turkey and the world energy situation - overall evaluation. Engineering and Machinery, Vol. 54, Issue 639, 2013, p. 32-44.
-
Kandilli İ., Minaz M. R., Kuncan M., Kuncan F. Design of Cooling and Heating System in Cars with Solar Energy. International Conference on Multidisciplinary, Science, Engineering, and Technology, Bitlis, Türkiye, 2017.
-
Kandilli İ., Karakaş E., Kuncan M. Solar powered boat design. International Advanced Technologies Symposium, Elazığ, Türkiye, 2017.
-
Akcan E., Kuncan M., Minaz M. R. Modeling and simulation of 30 kW grid connected photovoltaic system with PVsyst software. European Journal of Science and Technology, Vol. 18, 2020, p. 248-261.
-
Renewable Energy, International Energy Agency (IEA-International Energy Agency), https://www.iea.org/fuels-and-technologies/renewables
-
Climate change, The energy sector is central to efforts to combat climate change, https://www.iea.org/topics/climate-change.
-
Solar Energy and Technologies. Renewable Energy Department of Turkey, http://www.yegm.gov.tr/yenilenebilir/g_enj_tekno.aspx.
-
Öztürk H. H., Kaya D. Electricity Generation from Solar Energy: Photovoltaic Technology. Umuttepe Publications, 2013.
-
Erdoğan Y., Dinçler T., Kuncan M., Ertunç H. M. Güneş panelleri için yüksek verimli maksimum güç noktası izleyicisi (MPPT) tasarımı. Türk Otomatik Kontrol Toplantısı, TOK, Kocaeli-Türkiye, 2014, p. 1055-1060.
-
World Energy Outlook 2019, https://www.iea.org/reports/world-energy-outlook-2019.
-
Energy Market Regulatory Authority official website, https://www.epdk.org.tr/Detay/SiteSearch?st=elektrik%20%C3%BCretimi.
-
Global Solar Atlas, https://globalsolaratlas.info/map?c=39.554883,35.551758, 5&s=37.417333,41.355046&m=site.
-
Renewable Energy Department, http://www.yegm.gov.tr/MyCalculator/Default.aspx.
-
Aksangör Nazmiye Nazlı Performance Analysis of a Photovoltaic System with the Help of PVsyst Program in Ankara Conditions. M.Sc. Thesis, Gazi University, Institute of Science, Energy Systems Engineering Department, 2019.
-
The Pvsyst software, https://www.pvsyst.com/download-pvsyst/.
-
Kandasamy C. P., Prabu P., Niruba K. Solar potential assessment using PVSYST software. International Conference on Green Computing, Communication, and Conservation of Energy, 2013.
-
Iftikhar Uddin T. M., Md Abrar Saad, Husnain Albustam, Md Zakaria Mahbub Computational modeling of a grid-connected system using PVSYST software. International Journal of Scientific and Engineering Research, 2012.
-
Jankowiak Corentin, Zacharopoulos Aggelos, Brandoni Caterina, Keatley Patrick, MacArtain Paul, Hewitt Neil The role of domestic integrated battery energy storage systems for electricity network performance enhancement. Energies, Vol. 12, 2019, p. 3954.
-
Siyuan Dong, Enrique Kremers, Maria Brucoli, Rachael Rothman, Solomon Brown Techno-enviro-economic assessment of household and community energy storage in the UK. Energy Conversion and Management, Vol. 205, Issue 1, 2020, p. 112330.
-
Abuşka Mesut Solar Energy and Applications Lecture Notes.
-
Hayder Ali, Hassan AbbasKhan Techno-economic Evaluation of Two 42 kWp Polycrystalline-Si and CIS Thin-Film Based PV Rooftop Systems in Pakistan. Renewable Energy, Vol. 152, 2020, p. 347-357.
-
Sefa İbrahim, Altin Necmi Solar-powered grid interactive inverters – an overview. Journal of the Faculty of Engineering and Architecture of Gazi University, Vol. 24, Issue 3, 2009, p. 409-424.
-
Singh B. P., Goyal S. K., Siddiqui S. A. Analysis and classification of maximum power point tracking (MPPT) techniques: a review. Intelligent Computing Techniques for Smart Energy Systems, Lecture Notes in Electrical Engineering, Springer, Singapore, Vol. 607, 2020.
-
Besheer A. H., Eldreny M. A., Rashad H., Bahgat A. Status Monitoring and Performance Investigation of a 5.1 kW Rooftop Grid-Tie Photovoltaic Energy System in Egypt. Modern Maximum Power Point Tracking Techniques for Photovoltaic Energy Systems, Green Energy and Technology, Springer, Cham, 2020.
-
Official newspaper of Turkey, https://www.resmigazete.gov.tr/eskiler/2019/06/20190626-5.pdf.
-
Number of Schools in Turkey 2018-2019 Statistical Report of the Ministry of Education, Ministry of Education, http://sgb.meb.gov.tr/www/icerik_goruntule.php?kno=361.
Cited by
About this article

The authors would like to thank Siirt University Automation and Control Systems Laboratory staff and Midyat Telkari MTAL staff for their support. And even more special and profound thanks to those who develop opensource software.
