Abstract
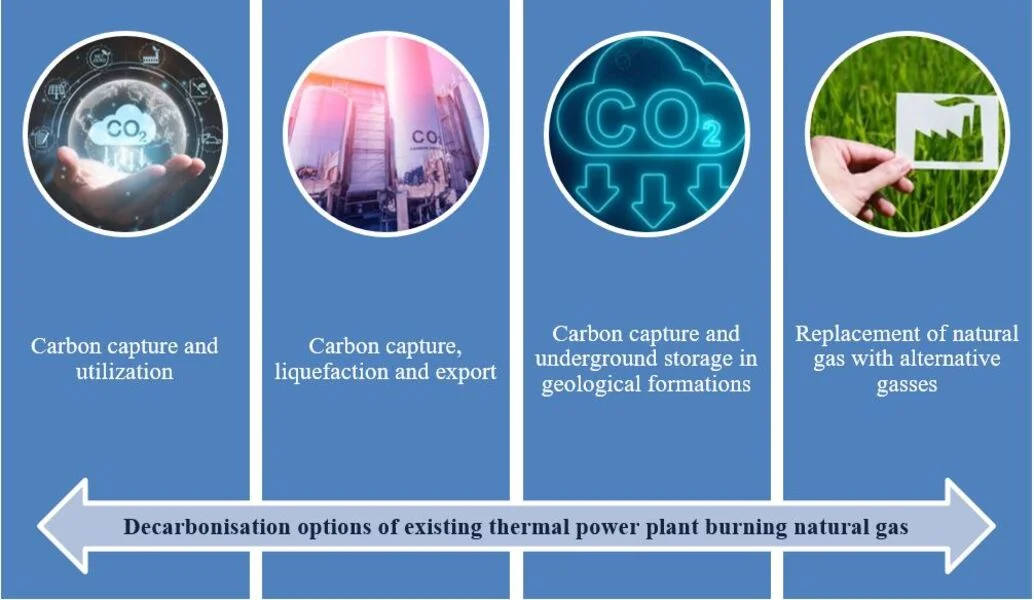
Nowadays power industry faces deepest crises ever with unprecedented prices shocks and climate challenges at the same time. From one hand we realise the need of energy transformation of power industry towards more sustainable future with climate neutral technologies. From the other hand it become obvious that this change could not happen immediately and transition period is needed with some fossil fuel technology still playing an important role as a back-up for renewable energy sources. The biggest question what is the best and cost-efficient way to decarbonise existing thermal power generation. We try to address it on the example of existing combined cycle gas turbine (CCGT) power plant fuelled by natural gas. Clearly the following possible options were identified: 1) replacement of natural gas with alternative gases, such as green hydrogen, bio or synthetic methane, 2) carbon capture and underground storage (CCS) in geological formations, 3) carbon capture, liquefaction and export, 4) carbon capture and utilisation (CCU). US giant General Electric in its publication “Decarbonizing gas turbines through carbon capture” is considering similar options for decarbonising of gas turbines. They divide it into two approaches: 1) pre-combustion by using a zero or carbon neutral fuels, such as hydrogen, synthetic methane, biofuels or ammonia and 2) post-combustion by removing carbon from the plant exhaust, using liquid or solid sorbents or -fuel cycles. In this publication we try to compare these different options, despite they are not clearly comparable. For the analysis we take natural gas fired CCGT plant Riga TPP-2 in Latvia with installed capacity of 881 MW (in condensing mode).
Highlights
- There are different options for thermal power plant decarbonization, the appropriate must be selected through the evaluation process (technical and economical evaluation).
- It is expected that the combination of decarbonisation solutions or their "modular" implementation can be cost-effective approach.
- The costs of decarbonization solutions, the lack of government support and the restriction in legislation are the bottlenecks to develop and implement appropriate decarbonization solutions.
1. Replacement of natural gas with alternative gasses
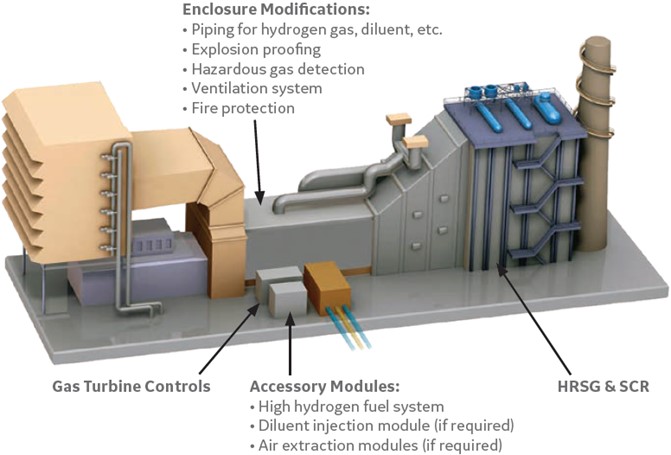
In order to completely (100 % in energy values) replace natural gas in Riga TPP-2 by green hydrogen, we need electrolizers with capacity of at least 2600 MW, gas compressors, large storage volumes and other equipment. Very roughly this is an investment of at least 2,6 billion EUR for hydrogen production, storage and supply. Additionally, we shall take into account necessary modernisation of CCGT plant to be capable for 100 % hydrogen firing. According to gas turbine manufacturers, CCGT plant does not require any modernisation, if hydrogen share in natural gas-hydrogen mixture does not exceed 5 % (volume). For higher blending of hydrogen, such aspects as higher flame speed (270 cm/s for H2, 30 cm/s for CH4), high adiabatic flame temperature, higher flashback risk, lower explosion limit, lower Wobbe index (40.90 MJ/Nm³ for H2, 48.17 MJ/Nm³ for CH4), higher volume flowrate (3.3 times higher than for CH4), lower density (0.09 kg/Nm³ for H2, 0,717 kg/Nm³ for CH4). It requires a serious upgrade of gas turbine fuel system (Fig. 1): air and fuel supply systems, compressors, burners, combustion chambers (multi cluster DNL or diffusion combustors), materials, sealings, gas leakage monitoring systems, fire protection, combustion monitoring systems.
The effect of co-firing of the mixture of hydrogen and natural gas on carbon dioxide emissions was studied using the formula, which is used by Latvian Environment, Geology and Meteorology Centre for CO2 emission calculations:
where: – CO2 emission factor (tCO2/TJ), – carbon content of fuel by mass (%), – CO2 molecular weight (44.0098 g/mcl), – C molecular weight (12.011 g/mcl), – lower heating value (LHV) of fuel mixture (GJ/1000m3), – conversion from GJ to TJ, – conversion to percentage (%), – density of fuel mixture for transition from volume to mass.
Fig. 1Potential impact of hydrogen fuel conversion on gas turbine systems
Results of calculations (Table 1) shows gradual reduction of carbon dioxide emission with increasing share of hydrogen in the natural gas and hydrogen blend. The breakthrough in reduction of CO2 emission is achieved at higher blends (more than 70 %).
Table 1Reduction of CO2 emission with increasing share of hydrogen in the fuel mixture
H2 share in the mixture (%, volume) | 0 % | 1 % | 3 % | 5 % | 10 % | 30 % | 50 % | 70 % |
H2 share in the mixture (%, mass) | 0.00 % | 0.16 % | 0.49 % | 0.83 % | 1.74 % | 6.38 % | 13.73 % | 27.08 % |
Density of the mixture (kg/m3) | 0.523 | 0.518 | 0.510 | 0.501 | 0.479 | 0.391 | 0.303 | 0.215 |
LHV of the mixture (MJ/nm3) | 34.08 | 33.84 | 33.38 | 32.91 | 31.75 | 27.09 | 22.44 | 17.78 |
Emission factor (g[CO2]/MJ) | 41.87 | 41.74 | 41.47 | 41.19 | 40.45 | 36.87 | 31.80 | 24.07 |
CO2 emission reduction (%) | 0.0 % | 0.3 % | 1.0 % | 1.6 % | 3.4 % | 12.0% | 24.1% | 42.5 % |
Production of green hydrogen requires substantial wind and solar resources to supply power to electrolizers. Electrolizers output shall be coordinated with output of wind and solar power, while use of produced hydrogen shall be planned at “Dunkelflaute” (no wind, no sun periods). It means that substantial hydrogen storage capacity shall be ensured.
Depending on CCGT and subsequently electrolizer capacity factor, the amount of necessary renewable resources is determined. For example, in the case capacity factor is 34 %, capacity of on-shore wind shall be 1400 MW, off-shore wind 800 MW and solar power 400 MW to secure work of electrolizers (Table 2).
Conversion efficiency from power to gas is approximately 60 %, while from gas to power – around 55-57 %. Overall conversion efficiency is 33-35 %.
The main advantages of this option: a) possibility for wide use of renewable energy sources (wind and solar) in hydrogen production, b) avoidance of carbon dioxide emissions during the electricity production, c) possibility to supply a surplus of hydrogen to transport sector and industry, d) avoidance of all problems associated with CCS option, including the ban for geological storage of CO2. The main disadvantages of this option: a) very high costs of hydrogen production, b) very low conversion efficiency, c) necessity to convert CCGT plant for hydrogen combustion and to install considerable wind and solar capacity.
Table 2Necessary capacity of renewable resources to power electrolizers
Power input, MW | 2600 | 2600 | 2600 | 2600 |
Hours | 1000 | 2000 | 3000 | 4000 |
% | 11 % | 23 % | 34 % | 46 % |
Power demand of electrolizers, GWh | 2600 | 5200 | 7800 | 10400 |
Capacity of RES-E, MW | ||||
On-shore wind | 400 | 1000 | 1400 | 1950 |
Off-shore wind | 250 | 500 | 800 | 1000 |
Solar power | 400 | 200 | 400 | 500 |
Total | 1050 | 1700 | 2600 | 3450 |
Production of RES-E, GWh | ||||
On-shore wind | 1226 | 3066 | 4292 | 5979 |
Off-shore wind | 986 | 1971 | 3154 | 3942 |
Solar power | 403 | 201 | 403 | 504 |
Total | 2615 | 5238 | 7849 | 10424 |
2. Carbon capture and underground storage (CCS) in geological formations
There are three ways of capturing carbon dioxide emissions from fossil fuel-based power generation or industrial installations (Fig. 2): post-combustion, pre-combustion, and oxy-fuel combustion. Post-combustion methods include chemical absorption, where CO2 is separated using amine-based absorbent solution or membrane separation, where CO2 is effectively separated by synthetic membranes made from polymers. Cost of CO2 capture from coal-fired power plants using amine-based absorption is around 50-100 EUR/t, while membrane technology is cheaper is about 25 EUR/t. Membranes are suitable for low CO2 concentrations and ensure high purity of CO2. In pre-combustion methods CO2 is captured from fuel before combustion by gasifying, oxidising or reforming fuel to produce CO and H2. In the oxy-fuel method, fuel is burned with pure oxygen, which results in higher concentration of CO2, which is easier to capture.
The cost of CO2 capture varies depending on types of power and industrial processes. NGCC (natural gas combined cycle) has the highest cost of carbon capture in power generation. It is approximately 70-120 USD/t or 72-123 EUR/t (Fig. 3).
According to preliminary estimation, the cost of carbon capture for the 881 MW combined cycle power plant could be in the range of 0,7 to 1,2 billion EUR. It could also result in reduction in electric efficiency of the plant from 55 % to 50 % due to high energy demand (steam and electricity) for CO2 capture.
Storage is the final stage of the CCS value chain and an ultimate way to keep captured CO2 away from the atmosphere in a permanent manner. In most cases, CO2 is injected into geological formations such as saline aquifers. Alternatives to aquifers include depleted oil and gas fields, igneous rocks or coal beds (Table 3).
Fig. 2Different CO2 capturing and utilisation methods
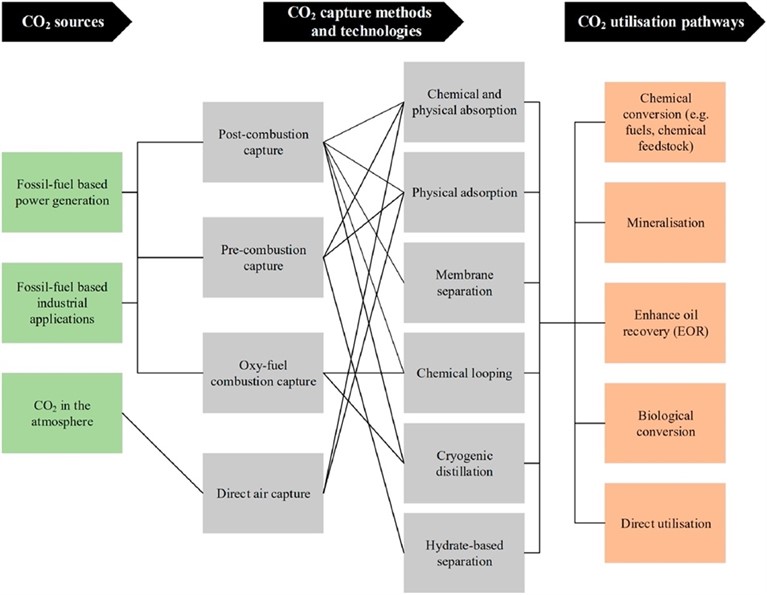
Fig. 3Cost of carbon capture in various types of power and industrial processes
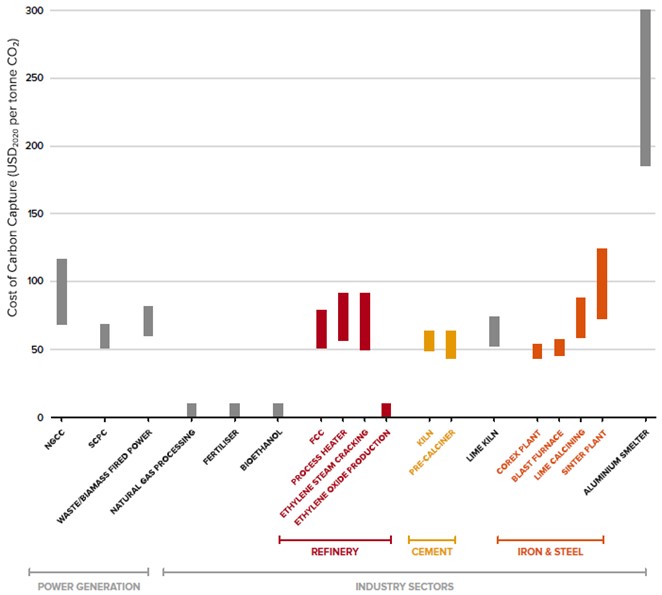
Table 3CO2 permanent storage options
Resource type | Pros and cons | Mechanisms |
Saline aquifers | Mature Usually not constrained Requires significant survey work | CO2 storage as dense phase Displaces brine to other connected formations (plus pressure rise) Dissolution (solution trapping) Entrapment in pores (residual trapping) Reaction to form minerals (mineral trapping) |
Depleted O&G reservoirs | Geology usually well understood Pilot & demonstration projects Usually smaller & more constrained Potential for leaks from old wells | Reservoir pressure usually lower: storage as gas Storage mainly by pressurization of the reservoir: transition to dense phase |
Basaltic / ultramafic rocks | Rapid mineralization Pilot scale (US, Iceland) Very low permeability Monitoring requires new techniques | CO2 reacts to form carbonate minerals (within months) |
Coal beds | Coal seams have natural fractures and abundant micropores Methane production (enhanced coal bed methane) No active projects (4 completed pilots) Permeability reduces quickly | CO2 diffuses into micropores and displaces coal-bed methane |
When it comes to CO2 storage, the key to success is to map, model and evaluate the specific site for storage in terms of its ability to contain the required volumes of injected CO2 in a stable state over centuries and millennia.
The situation with carbon storage is different in countries. There are countries, where the storage of CO2 is not allowed (Latvia, Lithuania, Slovenia), partly (Estonia up to 100 kt only R&D, Czech Republic up to 1 Mt) or fully allowed (Slovak Republic, Croatia, Romania, Hungary).
Fig. 4Baltic states – main energy and industry emission and carbon storage location
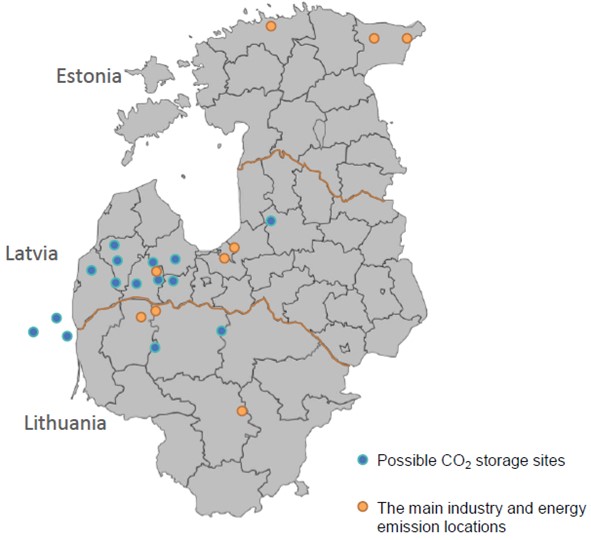
The situation in Baltic States is presented below (Fig. 4):
1) The main industries that make up the most significant part of emissions in Estonia – energy and chemical production; in Latvia – energy production, cement manufacturing; in Lithuania – fertilizer production, oil refining, cement manufacturing.
2) Estonia: CO2 storage permitted up to 100 kt (R&D only) by low. However, due to the geological formation, Estonia has no geological potential for carbon storage on land or offshore.
3) Latvia: CO2 storge is not permitted yet, but changes in the Climate act were initiated to permit geological storage of CO2 in Latvia. Several geological structures (onshore and offshore) have been identified where CO2 storage would be theoretically possible. However further geological research should be conducted to get more accurate information.
4) Lithuania: CO2 storage not allowed by low, but Lithuania has identified some potential location for CO2 storage (depleted oil fields, Vaškai, Syderiai).
Fig. 5Potential sites for CO2 geological storage in Latvia
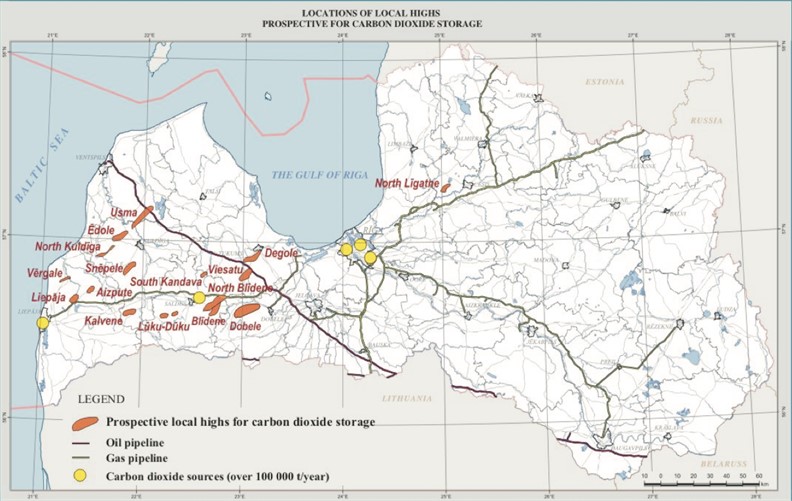
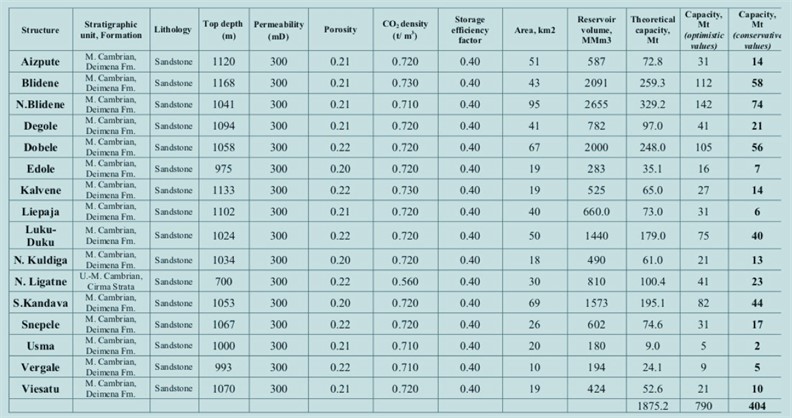
According to Latvian Environment, Geology and Meteorology Centre evaluation, there is a number of potential sites for CO2 geological storage in Latvia (Figure 5). The overall volume of CO2 storage is estimated in the range from 404 to 790 Mt. For CO2 storage from Riga TPP-2 plant the most suitable locations are Dobele (56-105 Mt), Blidene (58-112 Mt) and North Blidene (74-142 Mt) structures. The transportation of CO2 is suggested along the newly built pipeline adjusted to existing gas transportation network. The length of pipeline is accordingly 110 km to Dobele and 135 km to Blidene. In case of Dobele it is planned to reactivate and inspect two wells drilled during the exploration aimed at the establishment of underground natural gas storage. In case of Blidene 2 new wells at the dome of the Blidene structure is foreseen. The total cost of implementation of the project was estimated at 88.5 million EUR in case of Dobele and 99.5 million EUR in case of Blidene.
According to Alla Shogenova et al. the total cost of CO2 transport and storage from Riga TPP-2 to North Blidene is 40 million EUR – total CAPEX and 12.8 – total OPEX.
During the study of Dobele structures for development of underground storage of natural gas in 2010, Danish company COWI, based on SIA “Konsorts” evaluation, has reported the overall cost of establishment of underground gas storage 1,165 billion EUR for 7.7 bcm gas storage and 1.403 billion EUR for 10 bcm. Almost 75 % of these costs are attributed to acquisition of cushion gas, 10 % – for wells drilling works, ~6 % – for technological equipment (filters, compressors) and ~7 % – for construction and assembling works, 2 % – others costs, including land acquisition.
The main advantages of this option: a) avoidance of carbon dioxide emissions during the electricity production, b) possibility to store CO2 emissions, if CO2 utilisation is not possible in full extend, c) possibility to develop national or regional infrastructure for CO2 transportation and storage in Latvia, which would be shared among different stakeholders
The main disadvantages of this option: a) existing ban for geological storage of CO2 and uncertainty with future legislation, b) necessity to make full scale geological investigation to validate the suitability for storage site, c) very high costs of carbon capture, d) uncertainty on how to deliver CO2 from the plant to storage site.
3. Carbon capture, liquefaction and export
Safely and reliably transporting CO2 from where it is captured to a storage site is an important stage in the carbon capture and storage (CCS) process. Transport of CO2 occurs daily in many parts of the world however, significant investment in transportation infrastructure is required to enable large-scale deployment.
Pipelines today operate as a mature market technology and are the most common method for transporting CO2. Gaseous CO2 is typically compressed to a pressure above 8 MPa. CO2 also can be transported as a liquid in ships, road or rail tankers that carry CO2 in insulated tanks at a temperature well below ambient, and at much lower pressures.
The first long-distance CO2 pipeline came into operation in the early 1970s. In the United States, over 2,500 km of pipeline transports more than 40 Mt of CO2 per year from natural and anthropogenic sources, mainly to sites in Texas, where the CO2 is injected into existing oil fields. The process is well-known as “enhanced oil recovery” (EOR) – the addition of CO2 increases the overall pressure of an oil reservoir, forcing the oil towards production wells.
The CO2 shipping chain starts after the CO2 capture and lasts until storage (Fig. 6). The chain involves liquefaction, buffer storage, loading/unloading, shipping transport and reconditioning. In practice, the CO2 could be transported under different transport conditions (temperature and pressure).
For Riga TPP-2 one of the possible options could be transportation of CO2 to the port of Riga (the area of Kundziņsala) through the 25-30 km long CO2 pipeline, CO2 liquefaction, loading to CO2 transport ships and transporting it to the final disposal area, for example, to depleted oil and gas fields in the Northern Sea. For example, such CO2 storage area is developed by Equinor, Shell and TotalEnergies in the Norwegian shelf, the project is known as Northern Lights. Phase 1 includes capacity to transport, inject and store up to 1.5 million tonnes of CO2 per year. At the later stage, the storage capacity could be substantially increased.
During the evaluation of liquefied natural gas (LNG) terminal construction in Riga the possible pipeline route for natural gas supply to gas transmission network was identified (Fig. 7). The same route with minor changes could be considered for CO2 transport to the port CO2 export facilities.
Fig. 6The components of the CO2 shipping chain
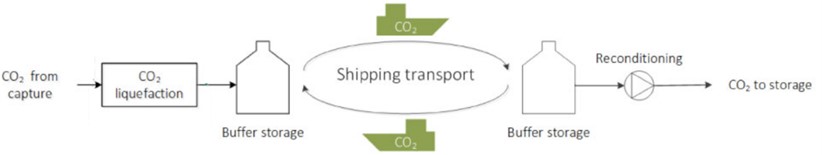
Fig. 7Possible route of CO2 transport from Riga TPP-2 to Kundziņsala in the port of Riga
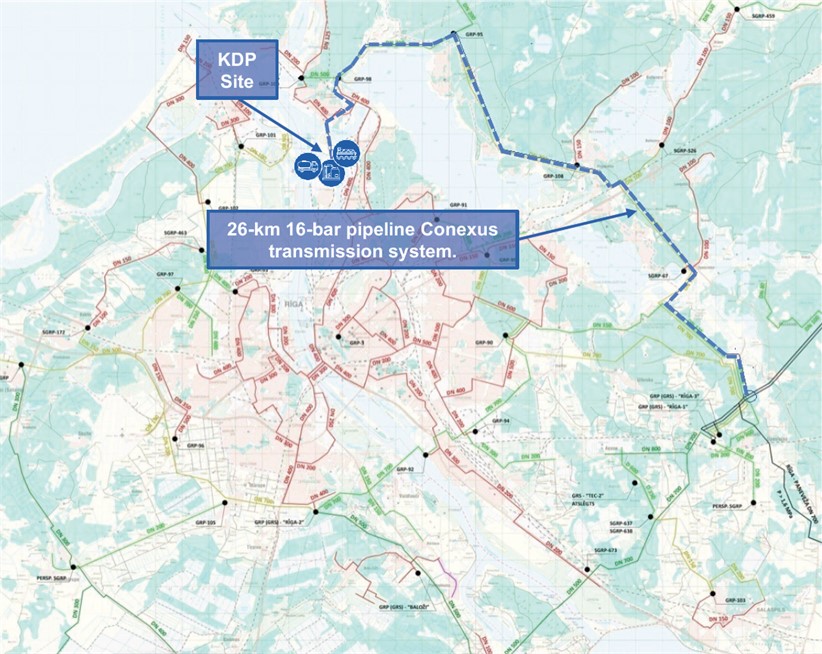
Table 4 presents (on the example of cement industry), that the cost of carbon capture is a part of total CCS costs. In this case (on the example of cement industry) the CO2 capture cost is approximately 33-50 % from total costs of CCS. The total costs are estimated 75-180 EUR/t. In addition to carbon capture cost it includes compression or liquefaction cost, transportation cost (both pipeline and by ship), cost of CO2 injection and geological storage and cost of monitoring geological storage.
Table 4Value chain components of CCS with cost ranges
Value chain components | Estimated cost range / € per t |
Carbon capture (cement kiln) | 50-90 |
Carbon compression and dehydration | 10-20 |
CO2 transport pipeline (150-300 km) | 5-25 |
CO2 transport by ship (150-1500 km) | 15-20 |
CO2 injection and geological storage | 5-20 |
Monitoring of geological storage | 5 |
Total | 75-180 |
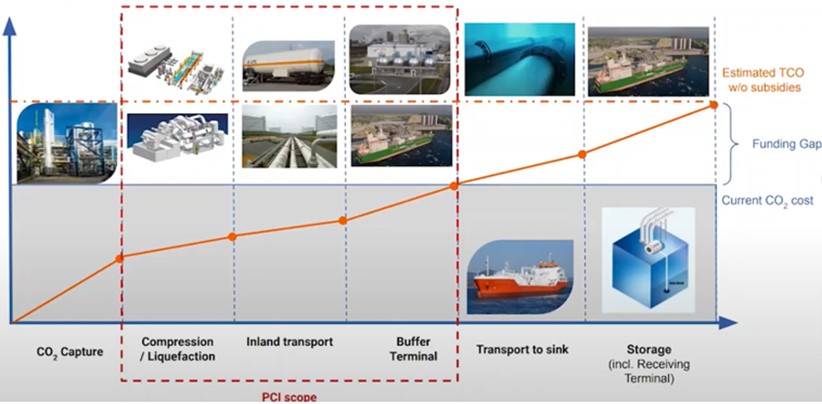
Current CCS total costs exceed the price of CO2. According to Fig. 8 the current CO2 price is equal to the total CSS costs, which include capture, transportation, compression/liquefaction, buffer terminal cost without transportation cost to sink and storage cost, which are part of total CSS costs. That is why European grants and funding are to support CSS project.
Fig. 8The costs of CCS value chain (TCO – total cost of ownership)
The main advantages of this option: a) avoidance of carbon dioxide emissions during the electricity production, b) not necessary to look for storage location in Latvia, c) flexibility to balance CO2 storage and utilisation strategies.
The main disadvantages of this option: a) expansive CO2 liquefaction and maritime transportation, b) uncertainty with storage capacity and availability of CO2 storage site overseas, c) very high costs of carbon capture, d) uncertainty on how to deliver CO2 from the plant to the CO2 export terminal in the port.
4. Carbon capture and utilization (CCU)
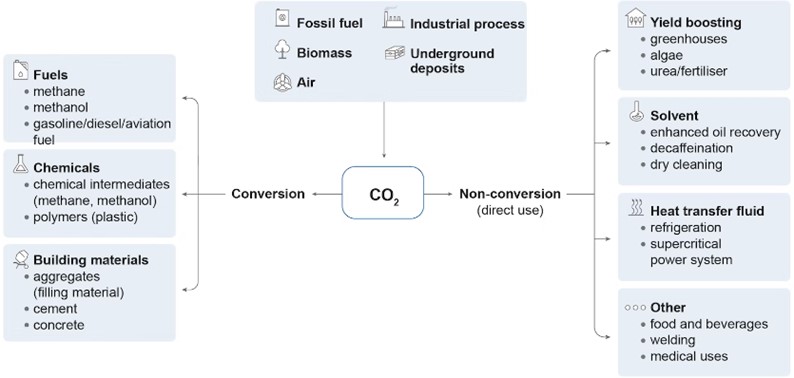
The range of potential CO2 use applications is very large and includes direct use, by which CO2 is not chemically altered (non-conversion) and the use of CO2 by transformation (via multiple chemical and biological processes) to fuels, chemicals and building materials (conversion) (Fig. 9).
For example, from conversion branch, SNG (synthetic natural gas) is natural gas’s green relative and is produced by converting carbon dioxide and green hydrogen into methane in a process called methanation. Therefore, SNG can be converted into liquefied natural gas (LNG) and compressed natural gas (CNG) in the same way as natural gas. Thanks to SNG composition, it can be mixed and used interchangeably with natural gas in all applications. Liquefied or compressed SNG can be transported or stored in the gas grid.
Fig. 9The options of CO2 utilization
At this moment it is very difficult to evaluate how big investments could be necessary for CCU project. Some indicative figures show the CAPEX and OPEX for some power-to-X processes: 1) Methanation: 1200 EUR/kW CAPEX, 42 EUR/kW OPEX, 2) Power to liquid via the methanol route 1000 EUR/kW CAPEX, 50 EUR/kW OPEX, 3) Power to liquid via the Fischer Tropsch route 1555 EUR/kW CAPEX, 55 EUR/kW OPEX.
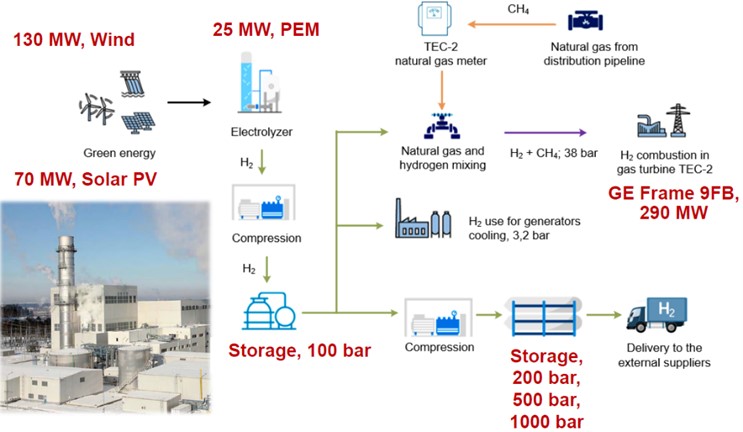
AS “Latvenergo” in cooperation with Latvian Hydrogen Association is developing the pilot project concept for production and use of hydrogen. The concept envisages the mixing of hydrogen and methane: up to 5 % – for the combustion of the mixture in gas turbines, up to 2 % – for injection into the gas grid, the supply of H2 to external customers (transport, industry) and the use of H2 for synthetic fuel production in Latvia.
The scope of the project includes RES electricity generation (130 MW wind and 70 MW solar PV), electrolysis equipment (25 MW PEM) for production of green hydrogen, equipment for hydrogen compression and storage, equipment for mixing of hydrogen with methane, hydrogen supply equipment (H2 cylinders and trailers) for distribution and 3-5 multi-filling stations (Fig. 10).
Fig. 10Concept and scale of hydrogen project (Riga TPP-2) (Photo of the power plant courtesy of Latvenergo AS)
In summer of 2021, AS “Latvenergo” cooperation was initiated with the Latvian cement producer SCHWENK Latvija SIA and SIA Ventspils naftas termināls on CO2 capture, storage and use (CCUS) technologies, including hydrogen and synthetic fuel production. On 24 January 2022 mentioned partners received the invitation from Tallinn University of Technology (TTU) and Kaunas University of Technology (KTU) to apply to the European Commission’s “Horizon” call HORIZON-CL5-2022-D3-01 (Decarbonising industry with CCUS) in order to implement the research project “CCUS Baltics”.
Within the scope of this study it was planned to implement CCUS demonstration as following:
1) AS “Latvenergo” in cooperation with the Latvian Hydrogen Association installs a PEM electrolyzer in Riga TPP-2 within the above mentioned pilot project.
2) CO2 delivery to the pilot project is provided from the Achemas Grupa factory in Lithuania, for example using the railway infrastructure or road transport.
3) As part of the “CCUS Baltics” project, AS “Latvenergo” install equipment for the production of synthetic fuel (for example, methanol) at Riga TPP-2 production plant.
4) Test injections of CO2 are made by Conexus on the site of Incukalns underground gas storage.
The main advantages of this option: a) possibility to sell CO2 for direct use (non-conversion), b) possibility to use CO2 (via multiple chemical and biological processes) to produce synthetic fuels, chemicals and building materials, c) synergy with green hydrogen production.
The main disadvantages of this option: a) very high costs of carbon capture, b) necessity to deliver sufficient amounts of hydrogen or nitrogen, c) necessity to install complicated and expensive equipment for hydrocarbon synthesis.
5. Overview of latest development in the Baltic states concerning CCU and CCS
According to latest developments in the Baltic states concerning CCU and CCS:
Estonia: CCS technologies will be included in the Environment Development plan 2030 as a measure to mitigate climate effects in Estonia. The limited potential of CCS and the current macroeconomic situation has put a stop to any planning and development of CCS implementation. Stakeholders slowly follow the recent development, but no concrete actions are taken or planned.
Latvia: Climate law is being developed in Latvia – in the current draft, it is planned to abolish the current prohibition on the storage of CO2, determine the basic principles for this field and delegate further of the regulatory framework. Interaction between stakeholders is going in various formats. The CO2 capture technology pilot project has been implemented at Schwenk Latvia.
Lithuania: is still considering CCS technologies as one of the tools in combating climate change and moving toward sustainability. Stakeholders are looking for solutions regarding the transportation of captured CO2 abroad.
6. Conclusions
1) It becomes obvious that every considered option has its benefits and drawbacks, that is why no single answer, which options is preferred does exist.
2) Most likely the right approach would be using the combination of options for decarbonising of CCGT plant, which would definitely include carbon capture, storage and utilisation.
3) Geological storage option depends on the removal of existing prohibition of this option in Latvian legislation and on results of geological investigation.
4) The option with liquefaction and export is less preferred, but could be considered if ban for geological storage in Latvia could not be removed.
References
-
“A pathway to lower CO2: decarbonizing gas turbines through carbon capture.” gegaspower.com, 2021. https://www.ge.com/content/dam/gepower/global/en_us/documents/future-of-energy/decarbonizing-gas-turbines-ccus-gea34966.pdf
-
Jeffrey Goldmeer. “Power to gas: hydrogen for power generation. Fuel flexible gas turbines as enables for a low or reduced carbon energy ecosystem.” gegaspower.com, 2019. https://www.ge.com/content/dam/gepower/global/en_us/documents/fuel-flexibility/gea33861%20power%20to%20gas%20-%20hydrogen%20for%20power%20generation.pdf
-
I. Ghiat and T. Al-Ansari, “A review of carbon capture and utilisation as a CO2 abatement opportunity within the EWF nexus,” Journal of CO2 Utilization, Vol. 45, p. 101432, Mar. 2021, https://doi.org/10.1016/j.jcou.2020.101432
-
David Kearns, Harry Liu, and Chris Consoli. “Technology readiness and costs of CCS.” Global CCS institute, 2021. https://www.globalccsinstitute.com/wp-content/uploads/2022/03/cce-ccs-technology-readiness-and-costs-22-1.pdf
-
“What is CCS.” CCS4CEE.eu, 2021. https://ccs4cee.eu/what-is-ccs/
-
“Carbon capture, utilization and storage,” Online Course, Infocus International, 2021.
-
“CCS Roadmaps for the Baltic states as a part of the CCS4CEE project,” Online Webinar, CCS4CEE.eu, 2022.
-
“Building momentum for CCS deployment in the CEE region.” CCS4CEE.eu, 2022.
-
A. Shogenova, K. Shogenov, M. Uibu, R. Kuusik, K. Simmer, and F. Canonico, “Techno-economic modelling of the Baltic CCUS onshore scenario for the cement industry supported by CLEANKER project,” in SSRN Electronic Journal, 2021, https://doi.org/10.2139/ssrn.3817710
-
U. Nulle and I. Nulle. “Potential sites for CO2 geological storage in Latvia”, https://www.meteo.lv/fs/ckfinderjava/userfiles/files/geologija/potential%20sites.pdf
-
“Transporting CO2.” Global Ccs Institute, 2015. https://www.globalccsinstitute.com/wp-content/uploads/2018/12/global-ccs-institute-fact-sheet_transporting-co2-1.pdf
-
“CO2 capture and storage.” Greenfacts: Facts on health and the environment, 2005. https://www.greenfacts.org/en/co2-capture-storage/l-3/4-transport-carbon-dioxide.htm
-
H. Deng, S. Roussanaly, and G. Skaugen. “Better understanding of CO2 liquefaction [Towards identifying optimal transport conditions for ship-based CCS].” SINTEF, 2019. https://blog.sintef.com/sintefenergy/co2-liquefaction-transport-conditions-ship-based-ccs/
-
“Accelerating decarbonization.” Northerm Lights, https://norlights.com/
-
“Putting CO2 to use. Creating value from emissions.” IEA, 2019. https://www.iea.org/reports/putting-co2-to-use
-
“Whitepaper on Synthetic Natural Gas.” Stargate Hydrogen, 2022. https://stargatehydrogen.com/news/whitepaper-on-synthetic-natural-gas/
-
“SNG – Synthetic Natural Gas.” C. Wilson – Man Energy Solution, 2022. https://www.man-es.com/discover/decarbonization-glossary---man-energy-solutions/synthetic-natural-gas
About this article

The authors have not disclosed any funding.
The datasets generated during and/or analyzed during the current study are available from the corresponding author on reasonable request.
The authors declare that they have no conflict of interest.
