Abstract
Carbon capture and storage (CCS) is proved to be effective measure for reducing CO2 emissions. whilst the world still highly depends on the use of fossil fuel energy, this method is necessary for reaching the world’s 1.5 °C goal. Saline aquifers among all possible underground formations are most common targeted ones for CO2 storage due to their frequent presence, and large storage capacity. However, this storage option suffers from sufficient well injectivity to inject large volumes of CO2 at acceptable rates through a minimum number of wells. The injectivity impairment/reinforcement happens through mineral dissolution, fine particle movement, salt precipitation and hydrate formation (known so far). Each of these mechanisms will be more dominant in injectivity alteration at different distance from the injection point depending on reservoir pressure and temperature, formation water salinity, rock mineralogy, and flow rate of CO2 injection as well as its dryness. In this study we have chosen a commercial software Eclipse 300 together with an open-source code to investigate the impact of formation characteristics, CO2 -Brine-Rock interaction, pressure, temperature as well as injection rate on injectivity alteration. The goal for this work is to provide a workflow which can help predicting injectivity alteration using the existing tools. Simulation results show that permeability is affected severely by salt precipitation during CO2 injection. Combined static and dynamic parameter study demonstrate that the injection rate plays a crucial role in size and expansion of CO2 plume as well as growth rate of dry out zone length, amount of salt precipitation and length of equilibrium region. The higher the injection rate, the quicker activation of the capillary and gravity force which leads to drag more brine to near well-bore resulting in higher volume fraction of salt precipitation. However, low injection rate could result in smaller CO2 plume, shorter dry out zone and longer equilibrium region in term of distance from injection point. Thus, optimizing the injection rate regarding reservoir parameters i.e., temperature, pressure and in-situ salinity, will lead to higher storage capacity as well as well performance and maintenance.
Highlights
- CO2 storage can be optimized not only regarding storage capacity but also well performance
- Using nonreactive transport simulator for near wellbore modeling in 3D radial flow is not advisable.
- It is possible to predict when CO2 injector will need stimulation by the E300 simulator providing representative data to use in tool is a big challenge
1. Introduction
The effectiveness of CO2 geological storage projects requires rather accurate estimation of the CO2/brine system parameters that affect the injectivity as well as ensuring the safety and the liability. These parameters include, but not limited to formation permeability and thickness (the phase mobilities) [3], mineral dissolution, fine particle movement, salt precipitation and hydrate formation. Each of these mechanisms will be more dominant in injectivity alteration at different distance from the injection point depending on reservoir pressure and temperature, formation water salinity, rock mineralogy, and flow rate of CO2 injection as well as its dryness.
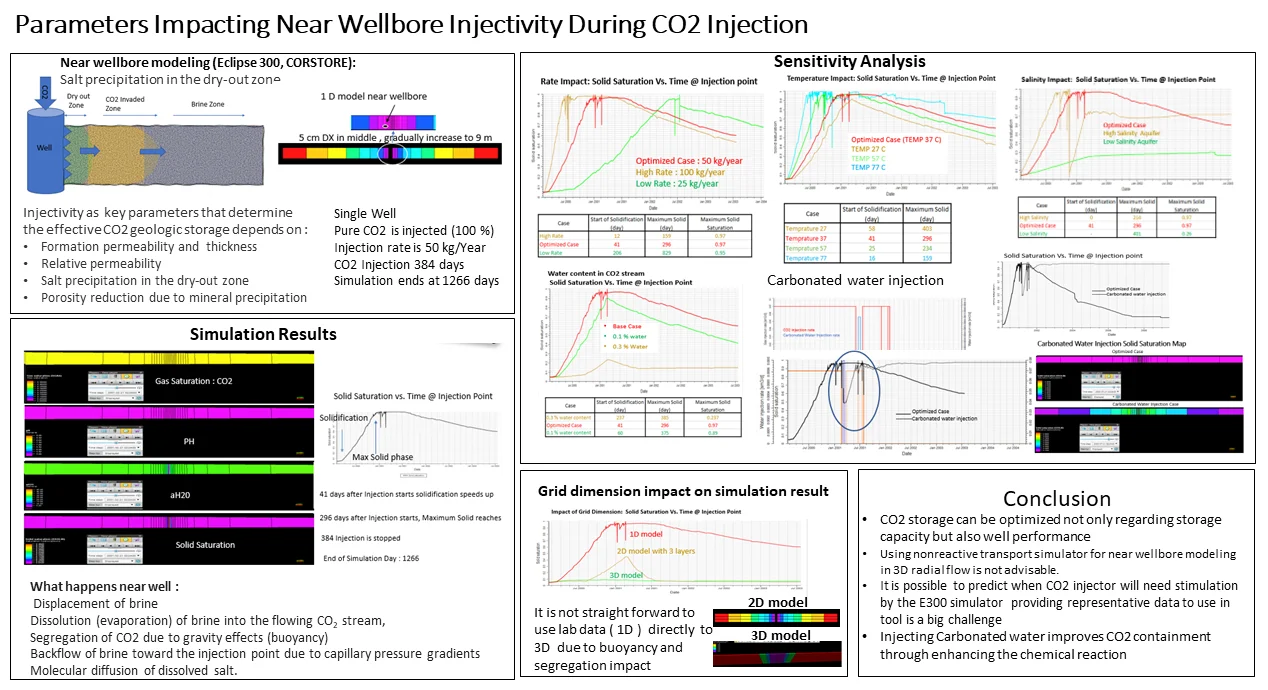
When a bulk of CO2 is injected into a well, 3 different zone is created around the well. at the injection point, the injected CO2 displaces the brine as well as vaporizes the water molecule. this creates a zone referred to as the salt dry-out zone where the dry CO2 occupies most of the pore space. Next to this zone, a zone of coexisting brine and CO2 forms (CO2 invaded / equilibrium zone), and it extends to the boundaries of CO2 plume. The plume is surrounded by a third zone which is the in-situ single-phase brine zone (Fig. 1). Over the time other mechanisms will be activated within the reservoir, backflow of brine toward the injection point due to capillary pressure gradients and molecular diffusion of dissolved salt. Both of which will play important rule in the CO2 saturation profile as well as solid saturation in the dry-out zone.
The injectivity variations are strongly dependent on the phase mobilities in the near-wellbore dry-out zone and the two-phase zone where CO2 and brine are in contact [3]. The injection of dry supercritical CO2 will displace the resident brine immiscibly, combined with the evaporation of water, which may eventually cause the aqueous phase dry-out and salt precipitation near the injection well [4]. Salt precipitation causes porosity and permeability alteration which affects the mobility in the same zone and consequently, the well injectivity [1, 1]. In addition to dry out zone, the acidification of the reservoir fluid in CO2 invaded zone will lead to fluid rock interaction which can impact also injectivity. Therefore, estimating the phase mobilities in the dry-out zone and the extent of the dry-out zone over time in wellbore vicinity is needed to predict the well injectivity as well as required well workovers.
Incorporating all the finding into simplified numerical simulation near wellbore will help gaining insight into the resultant of injectivity changes over time and distant from injection point. In current study we have chosen a commercial software Eclipse 300 to investigate the impact of formation characteristics, CO2-Brine-Rock interaction, temperature as well as injection rate on injectivity alteration near wellbore specially in salt dry-out zone. Current study tries to have a closer look into the dry-out zone and investigate the impact of reservoir dynamic and static parameters on the extent of this zone over time through a simplified numerical model.
Fig. 1A cross sectional schematic of CO2 saturation profile at injection point
2. Numerical simulation set up and results
2.1. Grid setup and simulation
A one-dimensional near well bore grid was set up to study the dry-out salt zone length and propagation. Later-on more dimensions has been added to the grid and results are compared to this grid as base study.
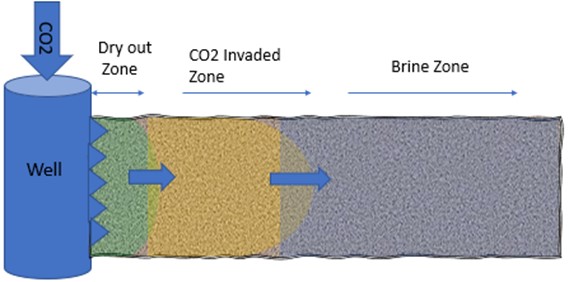
The model contains 40 grid cells in direction and 1 grid cell in both and dimension. In direction, grid resolution is small in the middle, 5 cm, and gradually increases to 9 m at the edges. Vertical resolution is 5 cm and unisized (Fig. 2). Horizontal permeability and porosity are considered constant and are 500 md and 25 % respectively. A constant vertical permeability of 100 md is also considered in grid. The pore volume of the two edge grid cells is multiplied by 300 to give the model enough volume to handle pressure limits.
Fig. 2One dimensional near wellbore Grid model
2.2. Model input data
Dynamic input data for example SCAL and PVT data, for the current model is taken from bunter model [1]. In addition, the grid depth is set at 1100 m with Initial pressure as 110 bar. Rock compressibility is also adapted from Bunter data set [1].
For modelling of CO2 injection, CO2STORE module in Eclipse 300 combined with SOLID option is used in current study. A total of 5 components including (‘H2O' 'CO2' 'NACL’ ‘CACL2' 'CACO3’) are considered present in the model. Few assupmtions in the modeling job have been made as listed below:
1) No component gradient vertically or horizontally.
2) Reservoir Temperature is 37.2 °C.
3) The injected CO2 is pure unless it is mentioned.
4) The diffusion is activated between all phases present.
5) Solid adsorption function is implemented through a table (SOLIDADS).
6) Mobility multiplier as a function of adsorbed solid Saturation (SOLIDMMS).
A Single vertical well is placed in the middle of the grid Fig. 2. Simulation is run for 1266 days. CO2 injection starts from first day with rate as 50 kg/year and it continues for 384 days.
3. Results and discussions
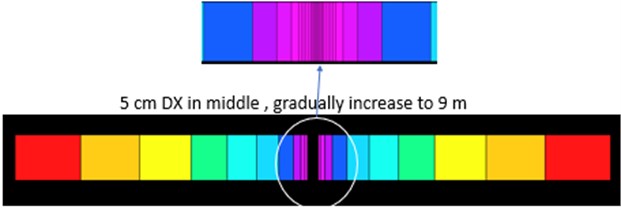
Fig. 3, shows solid saturation profile versus time, from injection start-up to the end of simulation run. As you can see in this simulation case that is called optimized case from now on, solid phase starts to build 41 days after CO2 injection starts. after 296 days of injection the solid saturation reached the maximum value (close to 1) and will plug the well by reducing the permeability at well vicinity. Despite injection continuation, injection rate gets unstable due to the reduced mobility of fluid until well shuts down at day 384. From graph one can see that the back flow of brine as well as molecular diffusion will cause the solid saturation to reduce over time after stopping CO2 injection.
Fig. 3Soldi saturation profile vs. time at injection point for 5 cm length near the wellbore
3.1. Sensitivity study
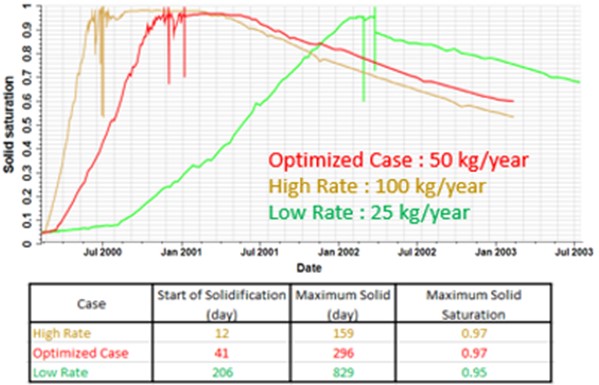
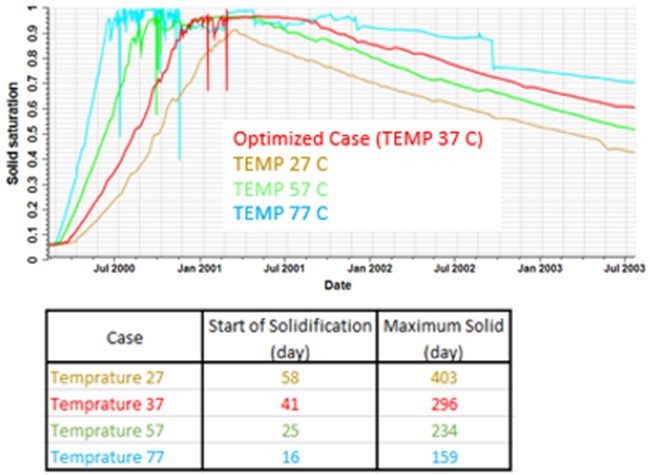
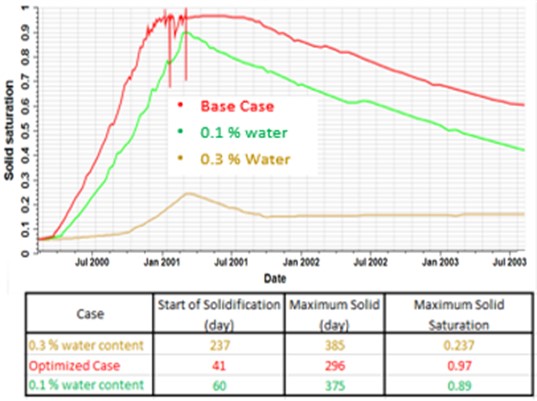
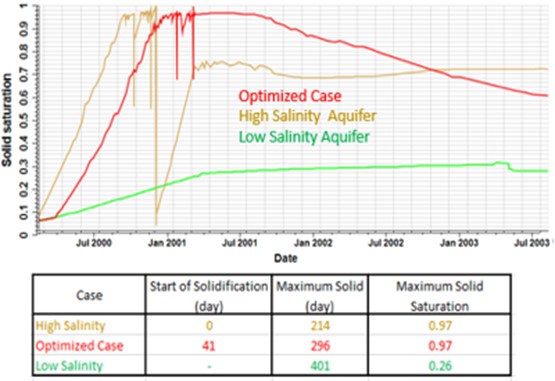
A sensitivity study is done to investigate the impact of the following parameters on the solid saturation in well vicinity. This parameters are, Injection rate, reservoir temperature, aquifer salinity and CO2 dryness. In Fig. 4, the impact of each parameter on solid saturation is illustrated.
As it is illustrated in the figure above, it is very important to optimize the CO2 injection rate with regards to the reservoir parameters to maximize the storage capacity as well as minimizing the injectivity impairment. In current study optimization is carried out both with regards to reservoir parameters and grid design and resolution.
Fig. 4a) Impact of the CO2 injection rate on solid saturation profile and timeline, b) impact of the Reservoir temperature on solid saturation profile and timeline, c) impact of water content in injected CO2 stream on solid saturation profile and timeline, d) impact of the aquifer salinity on solid saturation profile and timeline
a)
b)
c)
d)
3.2. CO2 segregation
One of the key elements that impact near wellbore activities is the segregation of CO2 due to gravity differences with in-situ brine. In next simulation attempts the impact of CO2 segregation on the solid saturation profile is investigated by adding more dimension into the base case grid and comparison of the results. The 2D and 3D models is built on the 1D model for sake of comparison. In the 2D grid is having layers in direction have been added stepwise to 3 layers to show the impact of segregation on the results. The 3D grid has 2 more row in direction in addition to the added layers in direction Fig. 5. The rest of the input data are kept the same as base case.
Fig. 5a) 2D grid model, increasing the number of layers in Z direction, b) 3D grid model, additional rows to the 2D model
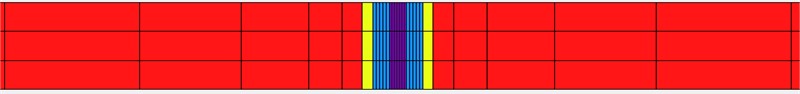
a)
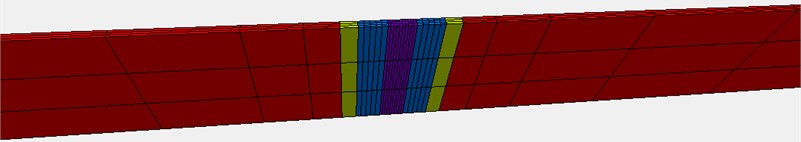
b)
The impact of segregation on solid saturation profile and timeline is simulated in the 2D grid cell with 2 and 3 layers in z direction is shown in Fig. 6. It is shown in the figure that CO2 segregation around the well, dramatically reduced the solidification profile and timeline.
Fig. 6The CO2 segregation impact in 2D grid with 2 and 3 layers on solid saturation profile and timeline versus time
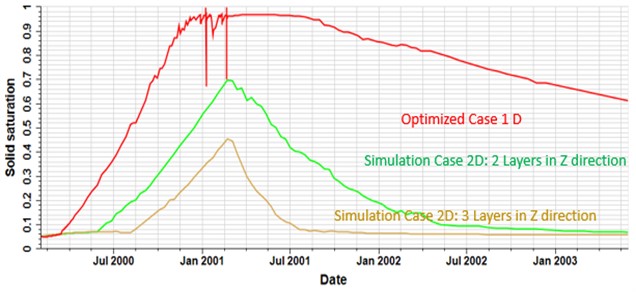
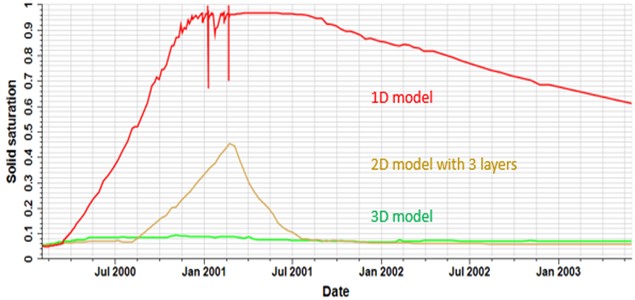
Fig. 7The impact of CO2 segregation on solid saturation profile and timeline in 3d grid model compared to 2D and 1D
4. Conclusions
Results of the current study can be summarized in following points:
1) The CO2 storage can be optimized not only regarding storage capacity but also well performance.
2) Using nonreactive transport simulator for near wellbore modeling in 3D radial flow is not advisable. First and foremost, since the impact of solid presence in the model is introduced to the model as tabulated data linked to the solid saturation eventually injected gas saturation. Hens it is not straight forward to use lab data (1D) directly for well data (3D) due to buoyancy and segregation impact.
References
-
S. Bachu et al., “CO2 storage capacity estimation: Methodology and gaps,” International Journal of Greenhouse Gas Control, Vol. 1, No. 4, pp. 430–443, Oct. 2007, https://doi.org/10.1016/s1750-5836(07)00086-2
-
C. A. Ehlig-Economides, A. Anchliya, and B. Song, “Pressure falloff test interpretation for leakage detection during CO2 injection in a deep saline aquifer,” in SPE EUROPEC/EAGE Annual Conference and Exhibition, Jun. 2010, https://doi.org/10.2118/131675-ms
-
M. Burton, N. Kumar, and S. L. Bryant, “Time-dependent injectivity during CO2 storage in aquifers,” in SPE Symposium on Improved Oil Recovery, Apr. 2008, https://doi.org/10.2118/113937-ms
-
J. P. Spivey and W. J. Lee, “Applied well test interpretation,” Society of Petroleum Engineers Richardson, TX, 2013.
-
X. Jiang, “A review of physical modelling and numerical simulation of long-term geological storage of CO2,” Applied Energy, Vol. 88, No. 11, pp. 3557–3566, Nov. 2011, https://doi.org/10.1016/j.apenergy.2011.05.004
-
S. A. Mathias, G. J. González Martínez de Miguel, K. E. Thatcher, and R. W. Zimmerman, “Pressure buildup during CO2 injection into a closed brine aquifer,” Transport in Porous Media, Vol. 89, No. 3, pp. 383–397, Sep. 2011, https://doi.org/10.1007/s11242-011-9776-z
-
H. Yamamoto, K. Zhang, K. Karasaki, A. Marui, H. Uehara, and N. Nishikawa, “Numerical investigation concerning the impact of CO2 geologic storage on regional groundwater flow,” International Journal of Greenhouse Gas Control, Vol. 3, No. 5, pp. 586–599, Sep. 2009, https://doi.org/10.1016/j.ijggc.2009.04.007
-
Q. Zhou, J. T. Birkholzer, C.-F. Tsang, and J. Rutqvist, “A method for quick assessment of CO2 storage capacity in closed and semi-closed saline formations,” International Journal of Greenhouse Gas Control, Vol. 2, No. 4, pp. 626–639, Oct. 2008, https://doi.org/10.1016/j.ijggc.2008.02.004
-
K.-Y. Kim, W. S. Han, J. Oh, T. Kim, and J.-C. Kim, “Characteristics of salt-precipitation and the associated pressure build-up during CO2 storage in saline aquifers,” Transport in Porous Media, Vol. 92, No. 2, pp. 397–418, Mar. 2012, https://doi.org/10.1007/s11242-011-9909-4
-
S. Mathias, J. Gluyas, Gerardo J. González Martínez de Miguel, and S. Hosseini, “Role of partial miscibility on pressure buildup due to constant rate injection of CO2 into closed and open brine aquifers,” Water Resources Research, 2011.
-
M. Zeidouni, M. Pooladi-Darvish, and D. Keith, “Analytical solution to evaluate salt precipitation during CO2 injection in saline aquifers,” Energy Procedia, Vol. 1, No. 1, pp. 1775–1782, Feb. 2009, https://doi.org/10.1016/j.egypro.2009.01.232
-
K. Pruess, “Formation dry-out from CO2 injection into saline aquifers: 2. Analytical model for salt precipitation,” Water Resources Research, Vol. 45, No. 3, Mar. 2009, https://doi.org/10.1029/2008wr007102
-
N. Muller, R. Qi, E. Mackie, K. Pruess, and M. J. Blunt, “CO2 injection impairment due to halite precipitation,” Energy Procedia, Vol. 1, No. 1, pp. 3507–3514, Feb. 2009, https://doi.org/10.1016/j.egypro.2009.02.143
-
J. Mahadevan, M. M. Sharma, and Y. C. Yortsos, “Water removal from porous media by gas injection: experiments and simulation,” Transport in Porous Media, Vol. 66, No. 3, pp. 287–309, Feb. 2007, https://doi.org/10.1007/s11242-006-0030-z
-
T. Giorgis, M. Carpita, and A. Battistelli, “2D modeling of salt precipitation during the injection of dry CO2 in a depleted gas reservoir,” Energy Conversion and Management, Vol. 48, No. 6, pp. 1816–1826, Jun. 2007, https://doi.org/10.1016/j.enconman.2007.01.012
-
“Strategic UK CCS Storage Appraisal Project,” DECC – ETI.
Cited by
About this article

The authors would like to thank Schlumberger for the use of the ECLIPSE and Petrel software package under an academic user license agreement.
The datasets generated during and/or analyzed during the current study are available from the corresponding author on reasonable request.
The authors declare that they have no conflict of interest.
