Abstract
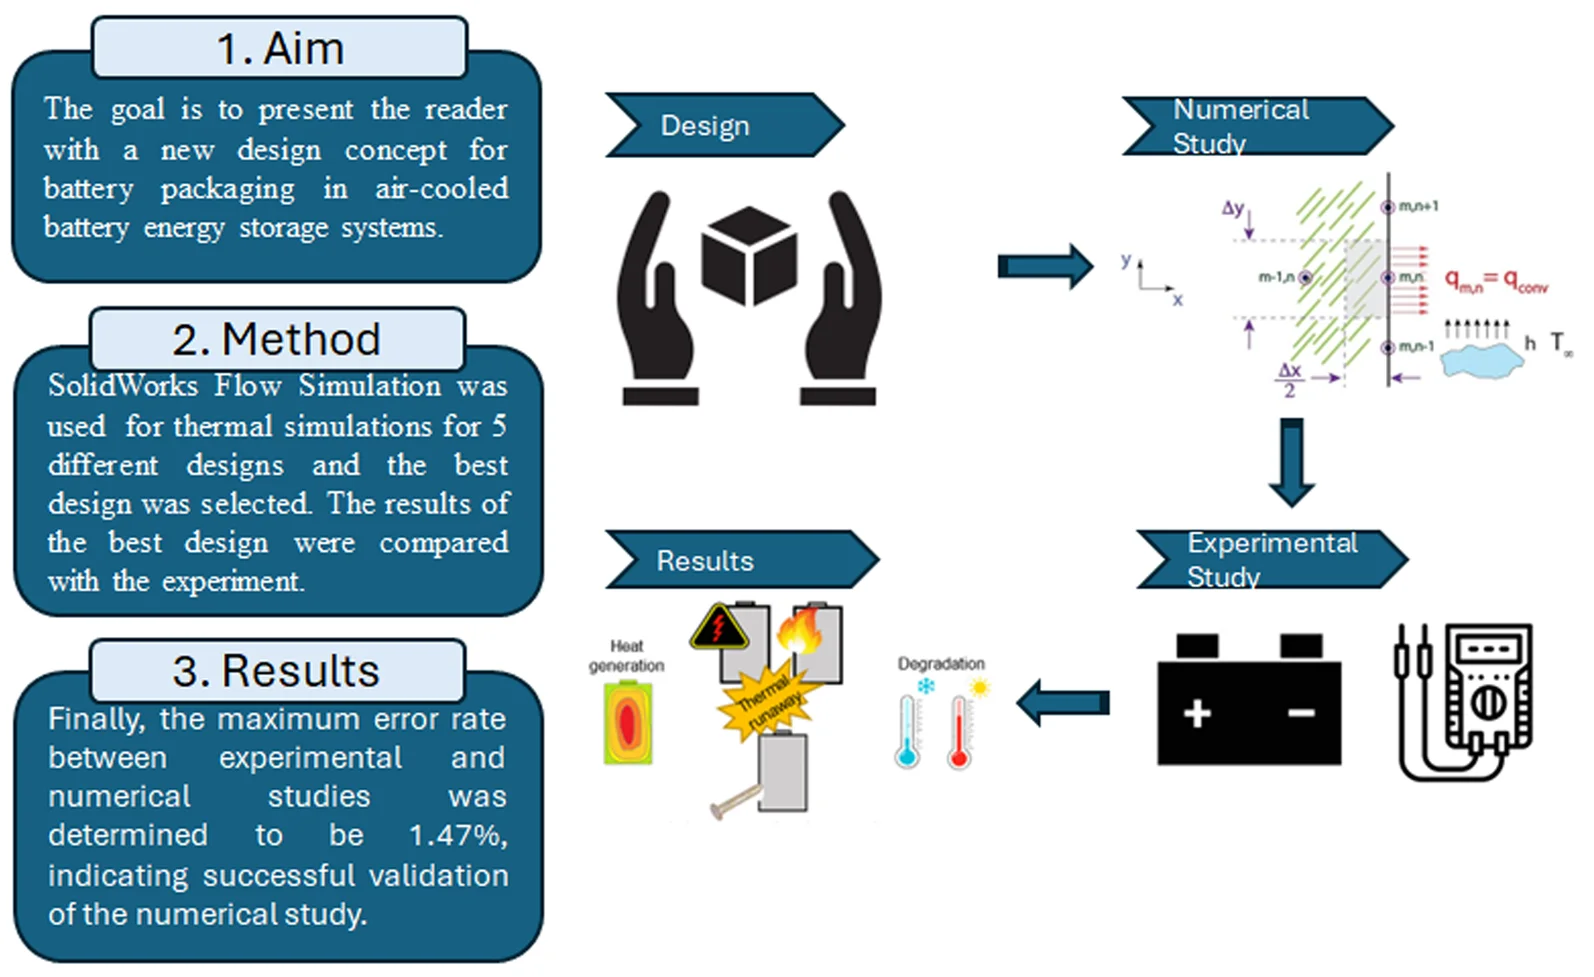
Energy storage systems enable the storage of energy and provide access to carbon-neutral, environmentally friendly energy whenever or wherever it is needed. Lithium-ion batteries are currently the most preferred type among various battery technologies and are widely used in energy storage systems. Some of the features that make lithium-ion batteries advantageous include high energy density, long life, low maintenance requirements, and high operating voltage. The growing demand for energy throughout the day increases the need for batteries with high storage capacity. However, the increased capacity also leads to heating issues in lithium-ion batteries. The heating problem in lithium-ion batteries can result in nonhomogeneous temperature distribution, shortened lifespan, thermal runaway, increased internal resistance, and performance loss. Therefore, an effective thermal management system is essential for cooling lithium-ion batteries. This study aims to provide insight into the forced air cooling of prismatic 280 Ah LiFePo4 batteries, which have limited information in the literature and are more prone to overheating compared to lower-capacity batteries. In this study, five different battery pack case designs, each with different sizes and numbers of air intake holes, were determined and modelled using the SolidWorks program. Within the battery pack cases, 16 280 Ah lithium-ion batteries are placed, and an axial fan is used to cool these batteries. Initially, computational fluid dynamics analyses of the five different designs were performed in the SolidWorks Flow Simulation program. An experiment was then conducted on the design that provided the most efficient thermal management to validate the numerical results. The selected design, fulfilling the purpose of homogeneous temperature distribution and having the minimum temperature difference between batteries, was designated as Design 5. It exhibited a 62 % improvement in cooling performance with a 0.25 °C temperature difference, indicating successful temperature homogeneity between batteries. During a two-hour experiment with a 140 A discharge current, temperature measurements were taken from the surfaces of the batteries using thermocouples. Finally, the maximum error rate between experimental and numerical studies was determined to be 1.47 %, indicating successful validation of the numerical study. The air intake hole optimization, a novel design approach, prevents temperature distribution inhomogeneity caused by the distance of the batteries to the fan and offers an effective way to cool down high-capacity 280 Ah batteries.
Highlights
- The study concludes that an optimized design significantly enhances cooling performance in the thermal management system of 280 Ah prismatic batteries, achieving a minimal temperature difference of 0.25 °C between the hottest and coldest batteries within a module.
- The article underscores the importance of experimental validation to complement analytical results, revealing discrepancies between experimental and analytical findings attributed to manufacturing defects in the module, emphasizing the ongoing significance of optimizing battery placement and air intake vent configurations.
- Practical challenges associated with real-world applications, such as potential misalignment of air intake holes due to the compression of battery modules with steel belts, stressing the need for future studies to address these challenges and consider compression force in order to optimize battery performance.
1. Introduction
For the long-term survival of our planet, the demand and awareness for environmentally friendly and clean energy sourced from natural resources such as sunlight, wind, and water are increasing day by day. It is crucial to support renewable energy sources, often referred to as clean or green energy, instead of relying on fossil fuels, which are non-renewable sources that harm the ecology. Energy storage systems play a vital role in promoting the use of renewable energy sources, reducing dependence on fossil fuels, and mitigating the environmental hazards associated with their usage [1].
In the manufacturing process of lithium batteries, resources and energy are consumed. The amount of carbon dioxide released into the environment varies depending on the battery chemistry [2]. Despite electric cars having zero emissions during operation, the manufacturing of batteries contributes to a carbon footprint. The life cycle assessment process (LCA) is employed to evaluate the environmental impact of battery manufacturing [3].
Energy storage types can be categorized in five different ways: mechanical, battery, thermal, pumped, electrical, and hydrogen-based storage. Important issues to look at to evaluate which storage system is the best option are charge and discharge profiles storage capacity and potential scalability [4].
Batteries are the oldest and most widely used type of energy storage [4]. They are devices that receive electricity from the power grid or power station, store this energy electrochemically, and provide it when needed. Beyond serving as simple emergency backup during power outages, battery storage offers versatile applications. It allows for the reduction of electricity consumption during peak power demand, known as peak shaving, and the storage of excess energy when generation exceeds consumption [5]. Another application is load shifting, involving the adjustment of electricity consumption from one time zone to another. Battery storage systems enable cost savings by providing customers with the flexibility to decrease grid demand during critical times without altering their electricity consumption, and they allow microgrids to disconnect from the main electricity grid when necessary [6]. These systems contribute to making renewable energy sources more reliable and viable. Various battery technologies are available for use in battery storage systems.
According to their chemistry, batteries are commonly divided into lithium-ion, lead-acid, and nickel-based batteries. Lithium-ion batteries, which have advantages such as high specific energy, relatively high operating voltage, long cycle life, high energy density, and are small and convenient, are considered one of the most promising energy storage devices and are preferred more than other battery types [7]. The increase in the production of electric vehicles, the demand for energy storage systems, and the use of high-energy density batteries in electronic components have put lithium-ion batteries at the forefront [8].
Fig. 1Lithium-ion battery market size between 2016 and 2027 (USD Billion) [9]
![Lithium-ion battery market size between 2016 and 2027 (USD Billion) [9]](https://static-01.extrica.com/articles/23583/23583-img1.jpg)
LFP (Lithium Ferrophosphate) batteries, which belong to the lithium-ion battery type, are preferred because they have low cost, high cycle life, and high specific power. However, their high discharge current brings the problem of unstable aging [10].
Due to their geometric differences, there are basically 3 types of LFP batteries: cylindrical, prismatic, and pouch batteries.
Pouch batteries are preferred due to their small size, lightweight, high packaging efficiency, and flexible dimensions. Some advantages of cylindrical batteries are that they can be produced very fast, they are cheaper than prismatic batteries, and the temperature management of cylindrical batteries is easy. Although cylindrical batteries with low initial cost are cheaper in the short term, compared to prismatic batteries, prismatic batteries are more advantageous than cylindrical batteries in terms of savings in the long term.
Fig. 2Different types of lithium-ion batteries: a) pouch battery, b) cylindrical battery, and c) prismatic battery [11]
![Different types of lithium-ion batteries: a) pouch battery, b) cylindrical battery, and c) prismatic battery [11]](https://static-01.extrica.com/articles/23583/23583-img2.jpg)
a)
![Different types of lithium-ion batteries: a) pouch battery, b) cylindrical battery, and c) prismatic battery [11]](https://static-01.extrica.com/articles/23583/23583-img3.jpg)
b)
![Different types of lithium-ion batteries: a) pouch battery, b) cylindrical battery, and c) prismatic battery [11]](https://static-01.extrica.com/articles/23583/23583-img4.jpg)
c)
Due to the large capacity and ease of design of prismatic batteries, there is an increase in demand for prismatic batteries. One of the most important points to be considered in prismatic lithium-ion batteries is the possibility of damage to the entire battery module if one of the batteries is damaged due to mechanical and electrical reasons. The most preferred battery type in electric vehicles, communication stations, energy storage, and medical fields is the prismatic battery. The market distribution of batteries is 40 % prismatic, 35 % pouch, 15 % cylindrical batteries.
There are several factors that affect the life of a lithium-ion battery. Some of these factors are charge/discharge rate, depth of discharge, and battery temperature. However, the main factor that determines the life of the battery is the cycle life. Discharging the battery to a certain depth and then fully charging it is called a cycle. The life of the battery is related to how many times it is discharged and how many times it is charged.
Discharge/Charge Rate- The C rate of a battery is defined by the time it takes to charge or discharge. 1C equals 60 minutes, 0.5C equals 120 minutes and 2C equals 30 minutes [12]. The more often a battery is charged and discharged, the shorter its life [13].
DOD (Depth of Discharge)- Depth of Discharge is defined as the capacity discharged from a fully charged battery divided by the battery’s nominal capacity [6]. As DOD increases, the number of cycles and capacity decreases [6]. The smaller the discharge (low DOD), the longer the battery lasts.
Battery Temperature- Another factor affecting battery life is battery temperature. Temperatures above 30 °C are considered a problem for lithium-ion batteries as they cause thermal degradation of the electrode and electrolyte [13]. Aging is much more accelerated at high temperatures [10].
The operating temperature of a lithium-ion battery should be in the range of 20 °C to 40 °C, while the temperature difference within a battery or from module to module should not be more than 5 °C [14]. The temperature difference between the ambient temperature and the internal temperature of the battery and the temperature difference between the batteries inside the module are important parameters to be considered as they can negatively affect the performance, reliability, and safety of the batteries [10]. Uniform temperature distribution in the module is crucial for effective cooling performance, as a temperature variation of about 10 °C to 15 °C in the module can cause 30-50 % degradation in power capacity [15]. Very low temperatures (< 15 °C) have a negative effect on the battery. The performance of the battery is adversely affected due to the inability of electrochemical reactions to occur normally during charging and discharging. When the temperature is too low below 15 °C, the diffusion rate of lithium ions in the electrolyte decreases due to the increase in the viscosity of the electrolyte. This significantly increases the internal resistance [16].
When the operating temperature is lower than 0 °C, the rate of electrochemical reactions decreases, which can trigger dendrite formation leading to thermal runaway [17].
Dendrites are solid structures that look like small branches. These dendrites threaten the safety of use as they can pierce the separator and cause a short circuit and battery explosion [16].
Fig. 3Dendrite growth [18]
![Dendrite growth [18]](https://static-01.extrica.com/articles/23583/23583-img5.jpg)
High temperatures above 40 °C can occur due to overcharging/discharging, mechanical failures, or short circuits and can cause exothermic reactions in battery materials. As a result, problems such as thermal runaway, internal resistance increase, and battery explosion may occur [19].
An optimum battery operating temperature range exists to avoid high internal resistance. That temperature range is 15 °C -40 °C for lithium-ion batteries. High internal resistance above the value declared by the supplier occurs leading to low current, voltage drops at load, and battery overheating [12].
Fig. 4Battery internal resistance- temperature graph [12]
![Battery internal resistance- temperature graph [12]](https://static-01.extrica.com/articles/23583/23583-img6.jpg)
If the battery temperature is not controlled, the risk of fire and explosion increases significantly. Hence, it is essential to implement a thermal management system to efficiently cool the batteries and ensure their operation within the normal temperature range, typically spanning from 20 to 40 degrees [10].
Battery thermal management systems can be implemented using three different systems: air cooling, liquid cooling, and phase change material based (PCM) cooling [10]. Air cooling is further classified into natural air cooling (passive cooling) and forced air cooling (active cooling). Passive cooling relies on natural convection, while active cooling involves the use of energy to cool the batteries. PCM cooling is a component of the passive cooling system. In PCM cooling, the latent heat generated during discharge is stored within the PCM. A cooler, which reduces the PCM load, helps transfer the accumulated heat in the material back to the battery [20]. If the PCM thickness is too large, the generated heat may not dissipate in time, leading to heat accumulation in the PCM. Therefore, selecting the appropriate PCM thickness is crucial to achieve optimum cooling performance [21]. Air cooling is widely preferred due to its simple structure and low cost. However, the efficiency, temperature reduction amount, and homogeneity of the air-cooling system are low. However, the module temperature decreases with increasing air velocity and distance between the batteries [22].
Compared to air cooling and PCM cooling systems, liquid cooling is relatively more efficient due to its high performance. Generally, liquid cooling is more complex, but this option provides a higher cooling capacity than air cooling [22]. Liquid cooling of battery modules usually uses a cold plate, and the battery is immersed in a dielectric liquid. The liquid cooling system has disadvantages such as increased weight, high cost, high pumping power requirement, potential for coolant leakage, and poor thermal contact between the cold plate and the battery [1].
In this study, since liquid-cooled systems are difficult to control and risky systems, and PCM systems require controlling the heat accumulation in the material and adjusting the thickness and thermal conductivity of the material, air cooling system, which is the most effective and easiest type of cooling of prismatic batteries, is used. The module with an air-cooling system was designed from LFP batteries by providing forced convection with the help of an axial fan.
Correct heat generation value knowledge is crucial to constituting the correct, reliable, and efficient battery thermal management system. Otherwise, the thermal management system cannot achieve the temperature distribution supposed to be managed successfully. Therefore, there are lots of studies on the battery heat generation finding.
Heat generation in the battery can be determined through a numerical method. Coupled thermal and heat generation models allow the estimation of temperature variation. Due to the nonlinearity of heat generation, determining this factor poses a challenge. N. Damay et al. developed a model that calculates both entropic heat and electrical losses by leveraging the internal temperature determined through the thermal model [23].
Fig. 5Lumped thermal model of the battery [23]
![Lumped thermal model of the battery [23]](https://static-01.extrica.com/articles/23583/23583-img7.jpg)
Heat generation of the battery can be found by using an artificial neural network (ANN). R. Cao et. al. predicted the heat generation rate at 0.5C, 1C, 1.5C at 25 °C, and 1C at 20, 30, and 45 °C with three different machine learning algorithms: ANN, SVM (Support Vector Machine), and GPR (Gaussian Process Regression) [24]. ANN performed better than the other two algorithms in predicting heat generation rates [24].
In another study conducted by P. Jindal et al., the applicability of the Bernardi equation was validated for NMC and LFP batteries. The Bernardi equation was found to predict heat generation with good accuracy during continuous discharge, but it overestimated heat generation by 26 % for LFP and 49 % for NMC batteries during pulse discharge [25]. For the purposes of this paper, the heat generation value was obtained directly from the battery supplier, and no further efforts were made to determine the heat generation value independently.
This paper focuses on designing a battery pack to ensure that the temperature difference between the maximum and minimum temperatures within a battery and among different batteries remains within the limit of 3 degrees for energy storage systems. A novel design element introduced in this study involves optimizing air intake holes on the sides of the battery pack based on this temperature difference limitation. The goal is to present the reader with a new design concept for battery packaging in energy storage systems and contribute to the ongoing efforts in enhancing the thermal management system of air-cooled battery packs. This contribution is particularly significant for high-capacity batteries that emit substantial heat to the surrounding environment.
Air is directly led to the cooling plates before being exposed to a high-pressure drop. This direct entrance to the cooling plate prevents cooling performance from being reduced. Despite in literature, z-type and u-type air ducts are common, and novel designs are proposed to improve z-type and u-type air duct designs’ performance, even maximum battery temperature, and max. temperature differences are found to be 53 °C and 1.19 °C in the best design proposed [26]. Updated z-type and u-type air duct designs still do not become enough. A 2.2 Ah LFP battery was used in this study and the temperature is still out of pointed out 20 °C and 40 °C limits. It was concluded that to keep the high capacity 280 Ah LFP battery temperature at 20-40 °C, a reliable and effective thermal management system is necessary. In order to eliminate the effect of fan distance because of its mounting location on the battery surface temperature distribution, battery position independent design should be constituted. That is why air intake holes were optimized to make sure that even the furthest battery to the fan is cooled down as much as the closest one to the fan. To address the impact of fan distance on the temperature distribution across the battery surface, a battery position-independent design was implemented. This involved optimizing the air intake holes to ensure that even the battery farthest from the fan receives adequate cooling, similar to the battery closest to the fan.
Initially, computational fluid dynamics analyses were conducted on five different designs using the SolidWorks Flow Simulation program. The primary objective was to maintain the temperature difference within a single battery and between batteries below 3 degrees Celsius. The goal was to achieve a uniform temperature distribution on the battery surfaces to prevent early aging and ensure capacity retention in these CFD analyses. In the cooling system, Cooling Plate 2 is responsible for cooling both Battery 1 and Battery 2, while Cooling Plate 1 exclusively cools Battery 1. Consequently, the required airflow to cool Battery 1 to the desired temperature is less than that needed for Battery 2. In light of this, the areas of the air intake holes are determined to provide the necessary airflow for the corresponding batteries.
When considering the battery pack size, air inlet from the sides of the battery pack and air outlet from the front side of the battery pack lead to a compact design. The compact design enables to use of more battery packs in a constrained volume. An increase in energy demand requires the use of a high-capacity battery such as a 280 Ah battery. Therefore, in order to increase the battery pack number that is used in an energy storage system, it is essential to use a battery pack that is advantageous in size. Because battery packs are placed on top of each other, the fan is placed on the front side of the battery pack. Air goes through the side air intake holes of the battery pack and sweeps the battery’s lateral surfaces where the thermal conductivity is high. Therefore, passing air from the side biggest surface of the battery is a more cooling efficient way. Air passes through the aluminium cooling plates which are rigid, durable to force, and have high thermal conductivity. This paper’s objective is to optimize the air intake holes to supply different air amounts according to the battery air needs to keep the temperature distribution homogeneous. In the literature, the cooling design for high-capacity batteries, such as the 280 Ah LFP, is not widely addressed. The 280 Ah battery is large and has significant dimensions. Maintaining the temperature balance of high-capacity prismatic batteries, like the 280 Ah, which are considered technologically advanced and relatively new, is critical. Special attention is required due to the associated risks of explosion and fire.
2. Material and method
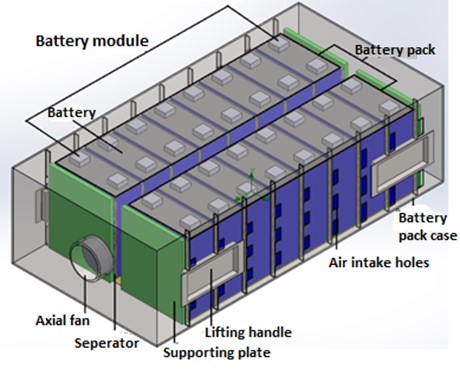
In this study, computational fluid dynamics analysis (CFD) was performed using SolidWorks Flow Simulation add-ins. Before the analyses, the design of five battery pack cases was decided. Two battery modules consisting of 8 batteries each and an axial fan providing turbulent flow cooling between the batteries were placed in the battery pack case and modelled in SolidWorks.
Fig. 6Components of battery module
Five different designs were analysed separately, and the optimum design was selected in terms of cooling performance. The best design was produced, and the experimental setup was set up. Tests were carried out at 0.5C charge and discharge rate and the temperatures on the surfaces of the batteries were measured. The results of the analysis and experiments were compared.
2.1. Analysis studies
In this section, the type of flow, computational fluid dynamics analysis, turbulence modelling technique, mathematical modelling of this turbulence model, and modelling and preparing the design for analysis in the SolidWorks program are mentioned.
2.1.1. Performing CFD analyses
Flow simulation solves the Navier-Stokes equations including the conservation of mass, conservation of momentum, and conservation of energy formulas. Since most of the flows encountered in practical applications are turbulent flows, Flow Simulation was developed mainly to simulate and study turbulent flows.
Since the Reynolds number calculated with the air inlet velocity is greater than 4000, the flow is turbulent. Turbulence occurs when the axial fan placed in the module overcomes the damping effect of the viscosity of the fluid and provides kinetic energy to the fluid.
2.1.2. CFD method
In turbulent flow, instantaneous values such as velocity, pressure, and temperature change continuously with time. These changes are completely random with irregular fluctuations. This leads to difficulties in solving the Navier-Stokes equations. To solve turbulent problems analytically or numerically, it is convenient to describe the mean and variable components of velocity, pressure, temperature, density, etc. Therefore, the Navier-Stokes equations consider the time-averaged effects of flow turbulence on the flow parameters. Eqs. (1), (2), (3) express the instantaneous velocity, pressure, and temperature as the sum of their mean and fluctuating components, respectively [27]. This is known as the Reynolds decomposition:
Fig. 7Variation of the velocity component (u) with time [28]
![Variation of the velocity component (u) with time [28]](https://static-01.extrica.com/articles/23583/23583-img9.jpg)
However, when the parameters in Eqs. (1), (2), and (3) are incorporated into the Navier-Stokes formulas, additional terms known as turbulence (Reynolds) stresses and heat fluxes emerge. To address these extra terms, a turbulence model was developed. SolidWorks Flow Simulation employs a two-equation model, specifically the - model, to solve the Navier-Stokes equations. In this model, represents the turbulent kinetic energy, determining the energy in turbulence, while stands for the turbulent propagation velocity, determining the propagation speed of turbulent kinetic energy. The - model is known for its reliability in free shear flows with small pressure gradients [28]. However, it may not be the most suitable model for problems involving inverse pressure gradients, large separations, and complex flows with strong curvatures. Despite these considerations, the - model is deemed appropriate for modelling the flow inside the module in this study, as it does not encounter significant flow separations and large pressure gradients. Chen et al. enhanced the cooling efficiency of an air-cooled lithium-ion battery thermal management system by designing the airflow path, analysing prismatic batteries using the - turbulence model, and validating the results through experimentation. The error rate between the measured temperatures in the experiment and the analysis was not more than 0.2 %, and the measured temperature difference was not more than 6.2 %. Given the good consistency of the Computational Fluid Dynamics (CFD) method with the experimental data, it was concluded that this CFD method is suitable and can be effectively utilized [15].
2.1.3. Mathematical model
In this section, 3 equations constituting the Navier-Stokes equations will be mentioned: continuity, momentum, and energy equations. In this study, the k- ε turbulence method was used. Therefore, formulations of and were shared. The computational fluid dynamics analyses were conducted using the SolidWorks Flow Simulation program. This software was employed to solve the numerical equations related to fluid flow and heat transfer within the battery pack cases. These are the formulations calculated by Flow Simulation program in the back side. There is no extra programming need.
2.1.3.1. Continuity equation
where and are the Reynolds-averaged velocity components of the flow.
2.1.3.2. Momentum equation
where is the density of air. is the Reynolds-averaged pressure. is the molecular dynamic viscosity. is the Kronecker delta function.
2.1.3.3. Turbulence kinetic energy transport equation
where is the turbulence eddy viscosity, is the turbulence kinetic energy, is the turbulence dissipation symbol. is the turbulence viscosity factor:
2.1.3.4. Turbulence propagation transport equation
The turbulence propagation transport equation was found as following simplifications:
The source terms and are expressed by Eqs. (10) and (11):
where is the distance to the wall. This function allows the change from laminar to turbulent to be considered.
represents turbulence formation due to buoyancy:
where is the component of the gravitational acceleration in the direction . is equal to 0.9. is equal to 1 when is greater than 0, otherwise it is equal to 0.
Calibrated constants for the standard - turbulence model are given in Table 1.
Table 1k-ε turbulence model constants
0.09 | 1.44 | 1.92 | 1.0 | 1.3 |
2.1.4. Creating the model and mesh structure
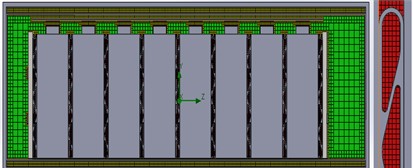
Sixteen lithium-ion batteries were modelled in two rows using the SolidWorks program. An axial fan was positioned to cool the lithium-ion batteries, creating forced convection within the battery pack. Air intake holes were drilled into the side sheets of the battery pack case to allow the fan to draw cooling air from the external environment and circulate it between the batteries. Cooling plates were installed between the two rows of batteries to prevent damage to the outer casings during packing and to ensure even compression force distribution. Additionally, support plates were placed on the sides of the end batteries.
Fig. 8Separator geometry
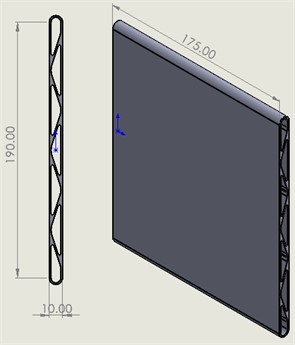
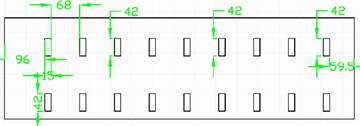
The 5 different designs were modelled, and these models are shown in Fig. 8. The total area of the air intake holes was kept 0.01125 m2 in all designs and the lengths and numbers of the air intake holes were changed. Detailed information of the designs is given in Fig. 8.
To capture the improved flow between two batteries in the model, a mesh structure was created with a minimum of 5 cells between the batteries. The mesh structure was optimized to reduce the analysis running time and to align with the computer’s performance. It was observed that the analysis results remained consistent even with an increased number of mesh elements.
Fig. 9Modeling of module case with different size and number of air intake holes from Design 5 to 1
a) 1
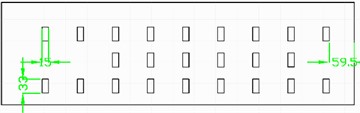
b) 2
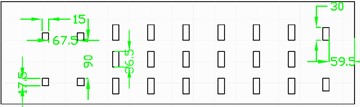
c) 3
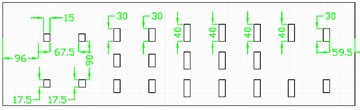
d) 4
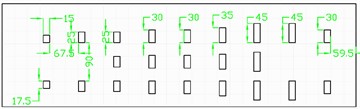
e) 5
Fig. 10Mesh structure between batteries

2.1.5. Determining the boundary and initial conditions
Technical specifications of the LF280K battery and axial fan are given in Table 2 and Table 3, respectively. Using these specifications, the initial and boundary conditions of the analysis were decided.
Table 2280 Ah battery technical specifications
Feature | Value |
Nominal capacity | 280 Ah |
Standard voltage | 3.2 V |
Standard charge / discharge current | 0.5C / 0.5C |
Battery dimension | 72.0×173.7×207.5 mm |
Battery weight | 5.42±0.3 kg |
Cycle life @ 25 °C | ≥ 6000 0.5C/0.5C |
Heat dissipation | 10.3 W |
Table 3Axial fan technical properties
Features | Values |
Fan dimension | 80×80×38mm |
Nominal current | 0.28 (Max: 0.42) A |
Nominal power | 6.72 (Max: 10.08) W |
Nominal speed | 5500 rpm/min ± 10 % |
Max air flow | 1.94 (Min: 1.75) m3/min |
An axial fan, which provides an air flow rate of 1.94 m3/min when not subjected to pressure, was selected to suck the hot air inside the module and exhaust it to the outside and the pressure loss curve of this fan was used in the analysis.
The inlet temperature of the air entering the module was determined according to the ambient conditions during the test.
Table 4Boundary and initial conditions
Condition | Inputs |
Air | 28.4 °C |
Battery heat generation | 10.3 W |
Fan type | External fan |
Fluid type | Air |
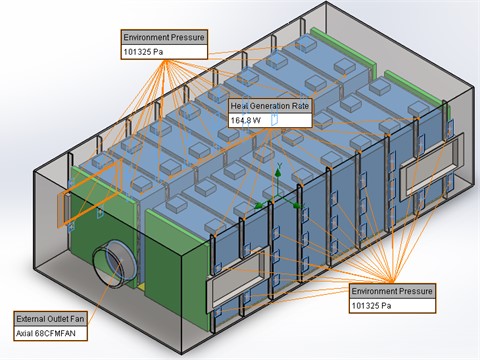
The data in Table 4 were entered into the Flow Simulation program as shown in Fig. 10. The material of the separator between the batteries, the lithium-ion battery, the module case, and the support part were defined in the analysis program.
Fig. 11Assignment of module boundary conditions
2.1.6. Experimental studies
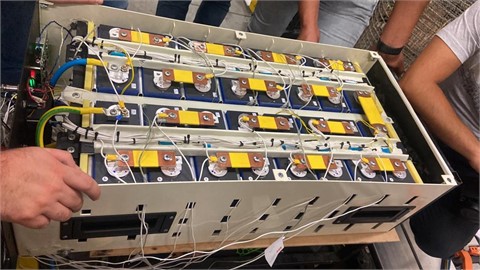
To validate the analysis results of design-5, identified as the optimal design for cooling performance after its analysis with Flow Simulation, the production processes of the design-5 module case were executed. An experimental setup was established for surface temperature measurements.
In the prepared module case, 16 lithium-ion batteries were arranged along with separators and support plates, interconnected with busbars. Electrical connections were established by integrating equipment such as the battery control system (BMS), sockets, cables, and rectifier.
The alternating current from the mains was converted into direct current by means of a rectifier. Data such as voltage, temperature, capacity, battery charge level were obtained by connecting to the BMS card via computer and the module was continuously monitored throughout the experiment.
The temperature measurements from the batteries were obtained using the HIOKI brand LR8402-20 model data logger. One end of the PT100 temperature sensor was connected to the port of the HIOKI device, while the other end was attached to the surface of the battery. As the battery pack featured two rows of battery modules with a symmetrical design, temperature measurements were taken from a single battery module.
For each battery to which the temperature sensors were connected, a channel was opened via HIOKI, and the temperatures of the batteries were monitored for two hours due to the 0.5C charge rate.
Fig. 12Schematic drawing of the experimental setup
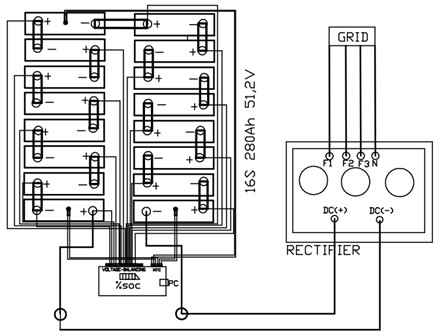
Fig. 13HIOKI LR8402-20

3. Results
In this section, the results of the computational fluid dynamics analysis of the five different designs are presented. Subsequently, tests were conducted on the fifth design, identified as the optimal design, and the test results are included. A comparison is made between the test and experimental results. Fig. 14 illustrates the surface temperature distribution of all designs after the flow analysis, with the batteries numbered according to their respective locations.
Fig. 14Taking temperature measurements from the surfaces of the batteries
In Fig. 15, the top views of the temperature distribution of design-5 with the minimum temperature difference between the batteries (0.25 °C) and design-2 with the maximum (2.09 °C) are given, respectively. When the temperature gradient between the batteries decreases, it is observed that the temperature is distributed homogeneously and symmetrically.
Fig. 15Distribution of battery surface temperatures from Design 1 to 5
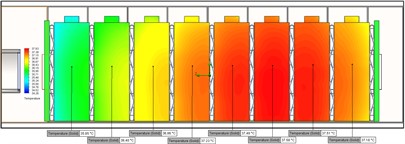
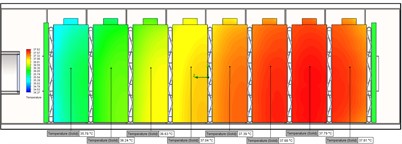
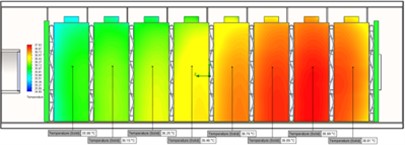
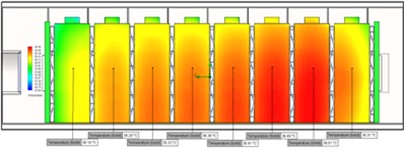
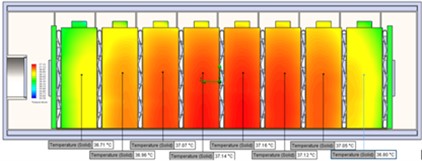
The temperatures provided in Table 5 represent the volumetric average temperatures of the batteries. Upon reviewing this table, it is observed that in all designs, the hottest battery is Battery Number 7, while the coldest battery is Battery Number 1. In Design-5, the average temperature of the hottest battery was 36.19 °C, and the average temperature of the coldest battery was 35.94 °C. The measurement points in the experiment for Design-5 are illustrated in Fig. 16, and the temperature data collected from the surfaces of the batteries are presented in Table 6.
Fig. 16Top view of the battery surface temperature distribution of design-5 and design-2, respectively
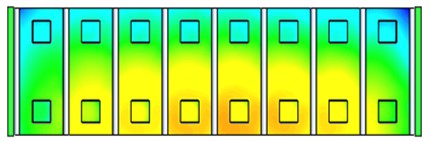


Table 5Analysis results with flow simulation
Features | Design 1 | Design 2 | Design 3 | Design 4 | Design 5 |
Number of the hottest battery | 7 | 7 | 7 | 7 | 7 |
Average temperature of the hottest battery (°C) | 37.33 | 37.61 | 36.80 | 36.38 | 36.19 |
Number of the coldest battery | 1 | 1 | 1 | 1 | 1 |
Average temperature of the coldest battery (°C) | 35.63 | 35.52 | 35.8 | 35.98 | 35.94 |
Temperature difference between the coldest and hottest battery (°C) | 1.7 | 2.09 | 0.99 | 0.4 | 0.25 |
Battery module pressure drop (Pa) | 27.13 | 26.95 | 27.27 | 26.62 | 27.86 |
Table 6Design-5 analysis and experimental temperature results
Features | 1. Battery | 2. Battery | 3. Battery | 4. Battery | 5. Battery | 6. Battery | 7. Battery | 8. Battery |
Analysis | 36.71 °C | 36.96 °C | 37.07 °C | 37.14 °C | 37.16 °C | 37.12 °C | 37.05 °C | 36.80 °C |
Experiment | 37.25 °C | 37.25 °C | 37.25 °C | 37.2 °C | 37.3 °C | 37.1 °C | 37.4 °C | 36.5 °C |
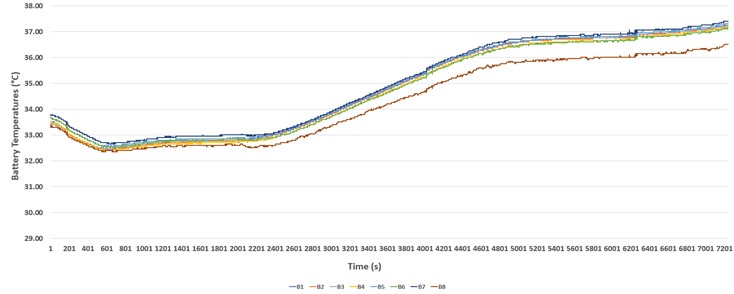
To verify the data obtained from the flow simulation, data were taken from the points where the analysis results were obtained, this time by experiment. In Fig. 17, the experimental and analysis results of the temperatures taken from the surface of 8 batteries are given graphically together with the error rates. The change in battery surface temperatures during the 2-hour experiment is shown in Fig. 18.
Fig. 17Design-5 experiment measurement points
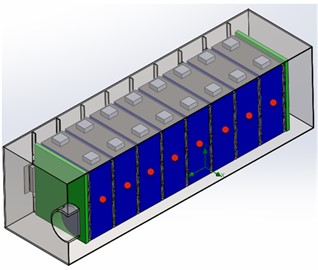
Fig. 18Comparison graph of analysis and experimental results
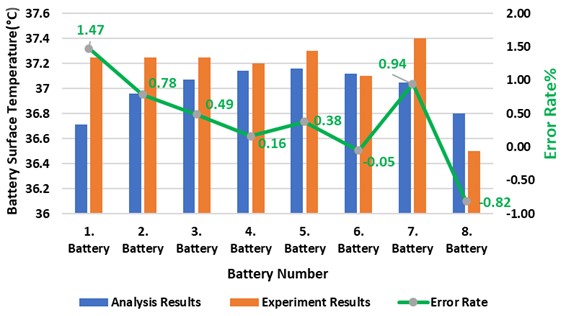
Fig. 19Temperature change graph of battery temperatures at 0.5 °C for 2 hours during the experiment
4. Conclusions
Research on the thermal management system of 280 Ah prismatic batteries, recently applied in the sector, is limited in the literature. Due to their high capacity, these batteries generate more heat than low-capacity batteries, necessitating a well-designed cooling system to maintain optimal temperatures. Failure to control the temperature can lead to issues such as capacity reduction and a shortened battery lifespan. As damage to one battery negatively impacts the entire system and system reinstallation is costly, it becomes crucial to operate the batteries under suitable ambient conditions. In this study, batteries were placed in battery pack cases with different hole shapes, and the influence of the location and size of the holes on the cooling performance of the batteries was observed.
Five different module cases with different air intake hole lengths, numbers, and equal air intake opening areas were designed and flow analyses were performed. In the analysis, it is assumed that the heat from the battery spreads homogeneously. As a result of the analysis, it was seen that the design with the smallest temperature difference of 0.25 °C between the hottest and coldest battery in a module was design number 5 and recorded in Table 5. Since the homogeneous temperature distribution on the battery surfaces has a positive effect on battery performance and lifetime, it was decided that the best design was design number 5.
The different distances of each battery from the fan caused an inhomogeneous temperature distribution. According to the analysis results, in the first design, which has the same size air intake holes in front of each separator, the battery close to the fan cooled better, while the battery far from the fan heated up. The importance of the location to the fan is clearly seen in the design with equal hole sizes.
When observing design-5, identified as the best design, from the y-z plane, batteries 2, 3, 4, 5, 6, and 7 are in double-sided thermal contact with the batteries to the right and left of them. In this perspective, the air entering from the two 30 mm long air intake holes located furthest on the -z axis only takes the thermal load of battery 8, while the air entering from the two 17.5 mm long air intake holes located furthest on the +z axis takes the thermal load of battery 1. The air passing through the separator is in thermal contact with only one battery. As a result, the flow rate required by the module through the air intake holes to cool batteries 2, 3, 4, 5, 6, and 7 is higher than the flow rate required to cool batteries 1 and 8. The smaller sizes of the 17.5 mm and 30 mm long air intake holes for cooling the 1st and 8th batteries in Design 5, compared to the other hole sizes, restrict the passage of the airflow sweeping across the 1st and 8th batteries. This restriction prevents the 1st and 8th batteries from cooling more than the other batteries and contributes to a homogeneous surface temperature distribution. The analysis results suggest that optimizing the hole sizes, number, and positions mitigates the disadvantage caused by the position of the batteries relative to the fan.
The experimental setup for the 5th design was prepared, and at the conclusion of the experiment, temperature measurements were taken from the surface of each battery using a temperature sensor. It was observed that the battery with the highest surface temperature was battery number 7, while the battery with the lowest surface temperature was battery number 8. Subsequently, measurements were taken from the same points using the analysis program. In this case, the hottest battery was battery number 5, and the coldest battery was battery number 1. Table 6 presents the results of both the experiment and analysis. The disparities between the experimental and analytical results are attributed to design differences arising from manufacturing defects in the module. The dimensions of the batteries and the heat emitted by them were provided by the supplier, assuming homogeneity in heat emission. This assumption introduced error rates in the analysis and experimental results. The analysis and experimental findings in this paper underscore the significance of optimizing the battery placement, air intake vent locations, and their dimensions for the cooling performance of 280 Ah batteries in a confined environment emitting heat. When comparing the experimental and analytical results, the maximum error rate is found in battery 1, amounting to 1.47 %. Fig. 16 illustrates the error rates for all batteries. Each design had different cooling performance. In design 1, the temperature difference between the hottest and coldest battery is 1.7 °C. These temperature differences are 2.09 °C, 0.99 °C, 0.4 °C and 0.25 °C in design 2, 3 ,4 ,5 respectively. Design 2 had 23 % worse cooling performance than design 1. Design 3 has 47.8 % better cooling performance than design 2, design 4 has 40 % better than design 3. Finally, design 5 has 62 % better performance than design 4. When comparing the worst and the best design in terms of temperature homogeneity, 119 % performance improvement was observed comparing the design 5 and design 2. The effect of hole area changing on pressure loss inside the battery pack among each design do not differ so much. Pressure drops in each design are so close to each other.
Challenges may arise from squeezing the battery package with a steel belt. As long as air directly flows through the cooling plates, there should not be a problem. However, when the cooling plate does not align with the air suction holes, sufficient air may not enter the cooling plates. Battery modules are compressed with a belt to prevent a reduction in cycle life. Swelling may occur during charge and discharge operations due to gas generation inside the battery. The compression operation reduces the length of the battery module. Therefore, it should be considered whether air inlet holes align with the cooling plates after compression. This belt could also extend because steel may stretch when exposed to heat over time. The length of the battery pack may increase again due to the extension of the steel belt.
In future studies, addressing the issue of changes in battery module size during the tightening process with steel belts is essential. This problem can lead to misalignment of air intake holes, causing a discrepancy between the temperature distribution on battery surfaces and experimental data. It is crucial to determine the appropriate compression force, sufficient to prevent battery aging and cycle reduction when applied with steel belts. Additionally, considerations should be made regarding the anticipated decrease in battery module length when the battery pack is tightened. Furthermore, in future works, methods for determining heat generation and corresponding experiments can be included.
References
-
S. Tian et al., “Environmental benefit-detriment thresholds for flow battery energy storage systems: A case study in California,” Applied Energy, Vol. 300, p. 117354, Oct. 2021, https://doi.org/10.1016/j.apenergy.2021.117354
-
W.-H. Chen and I.-Y. L. Hsieh, “Techno-economic analysis of lithium-ion battery price reduction considering carbon footprint based on life cycle assessment,” Journal of Cleaner Production, Vol. 425, p. 139045, Nov. 2023, https://doi.org/10.1016/j.jclepro.2023.139045
-
Q. Qiao, F. Zhao, Z. Liu, S. Jiang, and H. Hao, “Cradle-to-gate greenhouse gas emissions of battery electric and internal combustion engine vehicles in China,” Applied Energy, Vol. 204, pp. 1399–1411, Oct. 2017, https://doi.org/10.1016/j.apenergy.2017.05.041
-
J. S. Jones. “The different types of energy storage and their opportunities.” About Smart Energy International, https://www.smart-energy.com/storage/the-different-types-of-energy-storage-and-their-opportunities/.
-
B. Mursaloğlu. “Balıkçı Gemilerinde peak shaving modu.” Cemre Shipyard. https://www.cemreshipyard.com/tr/articles/balikci-gemilerinde-peak-shaving-modu#.
-
J. S. Jones. “What is battery energy storage?” Enel X. https://corporate.enelx.com/en/question-and-answers/what-is-battery-energy-storage.
-
J. Weng, X. Yang, D. Ouyang, M. Chen, G. Zhang, and J. Wang, “Comparative study on the transversal/lengthwise thermal failure propagation and heating position effect of lithium-ion batteries,” Applied Energy, Vol. 255, p. 113761, Dec. 2019, https://doi.org/10.1016/j.apenergy.2019.113761
-
Polaris, “Lithium-Ion battery market size, share global analysis report, 2022-2030,” Polaris Market Research, 2022.
-
Precedence Research, https://www.precedenceresearch.com/lithium-ion-battery-market2021.
-
Z. Ling, F. Wang, X. Fang, X. Gao, and Z. Zhang, “A hybrid thermal management system for lithium ion batteries combining phase change materials with forced-air cooling,” Applied Energy, Vol. 148, pp. 403–409, Jun. 2015, https://doi.org/10.1016/j.apenergy.2015.03.080
-
H. Löbberding et al., “From cell to battery system in BEVs: Analysis of system packing efficiency and cell types,” World Electric Vehicle Journal, Vol. 11, No. 4, p. 77, Dec. 2020, https://doi.org/10.3390/wevj11040077
-
I. Buchmann, Batteries on a Portable World: A Handbook on Rechargeable Batteries for Non-Engineers. Richmond, Canada: Cadex Electronics Inc, 2017.
-
S. Xiong, “A study of the factors that affect lithium ion battery degradation,” Missouri, United States, 2019.
-
Z. Rao, Z. Qian, Y. Kuang, and Y. Li, “Thermal performance of liquid cooling based thermal management system for cylindrical lithium-ion battery module with variable contact surface,” Applied Thermal Engineering, Vol. 123, pp. 1514–1522, Aug. 2017, https://doi.org/10.1016/j.applthermaleng.2017.06.059
-
K. Chen, W. Wu, F. Yuan, L. Chen, and S. Wang, “Cooling efficiency improvement of air-cooled battery thermal management system through designing the flow pattern,” Energy, Vol. 167, pp. 781–790, Jan. 2019, https://doi.org/10.1016/j.energy.2018.11.011
-
X. Zhang, Z. Li, L. Luo, Y. Fan, and Z. Du, “A review on thermal management of lithium-ion batteries for electric vehicles,” Energy, Vol. 238, p. 121652, Jan. 2022, https://doi.org/10.1016/j.energy.2021.121652
-
P. Lyu et al., “Recent advances of thermal safety of lithium ion battery for energy storage,” Energy Storage Materials, Vol. 31, pp. 195–220, Oct. 2020, https://doi.org/10.1016/j.ensm.2020.06.042
-
I. Sumbulla, “Analysis of Prevailing Battery Innovations and Concept Technologies,” University of Michigan, 2022.
-
T. M. Bandhauer, S. Garimella, and T. F. Fuller, “A critical review of thermal issues in lithium-ion batteries,” Journal of The Electrochemical Society, Vol. 158, No. 3, p. R1, 2011, https://doi.org/10.1149/1.3515880
-
T. Wang, K. J. Tseng, and J. Zhao, “Development of efficient air-cooling strategies for lithium-ion battery module based on empirical heat source model,” Applied Thermal Engineering, Vol. 90, pp. 521–529, Nov. 2015, https://doi.org/10.1016/j.applthermaleng.2015.07.033
-
M. Chen et al., “Experimental analysis on the thermal management of lithium-ion batteries based on phase change materials,” Applied Sciences, Vol. 10, No. 20, p. 7354, Oct. 2020, https://doi.org/10.3390/app10207354
-
C. A. Ferasso, L. Schaeffer, J. D. de Oliveira, L. Calabria, C. Pandolfi, and F. M. Siviero, “Thermal control ways for Li-Ion batteries cooling: A review,” Brazilian Journal of Development, Vol. 6, No. 10, pp. 75687–75701, 2020.
-
N. Damay, C. Forgez, M.-P. Bichat, and G. Friedrich, “Thermal modeling of large prismatic LiFePO4/graphite battery. Coupled thermal and heat generation models for characterization and simulation,” Journal of Power Sources, Vol. 283, pp. 37–45, Jun. 2015, https://doi.org/10.1016/j.jpowsour.2015.02.091
-
R. Cao, X. Zhang, and H. Yang, “Prediction of the heat generation rate of lithium-ion batteries based on three machine learning algorithms,” Batteries, Vol. 9, No. 3, p. 165, Mar. 2023, https://doi.org/10.3390/batteries9030165
-
P. Jindal, R. Katiyar, and J. Bhattacharya, “Evaluation of accuracy for Bernardi equation in estimating heat generation rate for continuous and pulse-discharge protocols in LFP and NMC based Li-ion batteries,” Applied Thermal Engineering, Vol. 201, p. 117794, Jan. 2022, https://doi.org/10.1016/j.applthermaleng.2021.117794
-
C. Yang, H. Xi, and M. Wang, “Structure optimization of air cooling battery thermal management system based on lithium-ion battery,” Journal of Energy Storage, Vol. 59, p. 106538, Mar. 2023, https://doi.org/10.1016/j.est.2022.106538
-
Convective Heat Transfer, S. Kakac, Y. Yener, and A. Pramuanjaroenkij. CRC press, 2013.
-
“K-epsilon Turbulence Model.” Simscale, https://www.simscale.com/docs/simulation-setup/global-settings/k-epsilon/.
Cited by
About this article

The authors have not disclosed any funding.
We would like to thank the entire Teksan Generator family for their support during the design and production stages of this research.
The datasets generated during and/or analyzed during the current study are available from the corresponding author on reasonable request.
Oya Bakar: conceptualization, investigation, methodology, software, visualization, validation; Murat Uysal: conceptualization, methodology, project administration, supervision, resources; Ahmet Feyzioğlu: conceptualization, methodology, supervision, validation.
The authors declare that they have no conflict of interest.
