Abstract
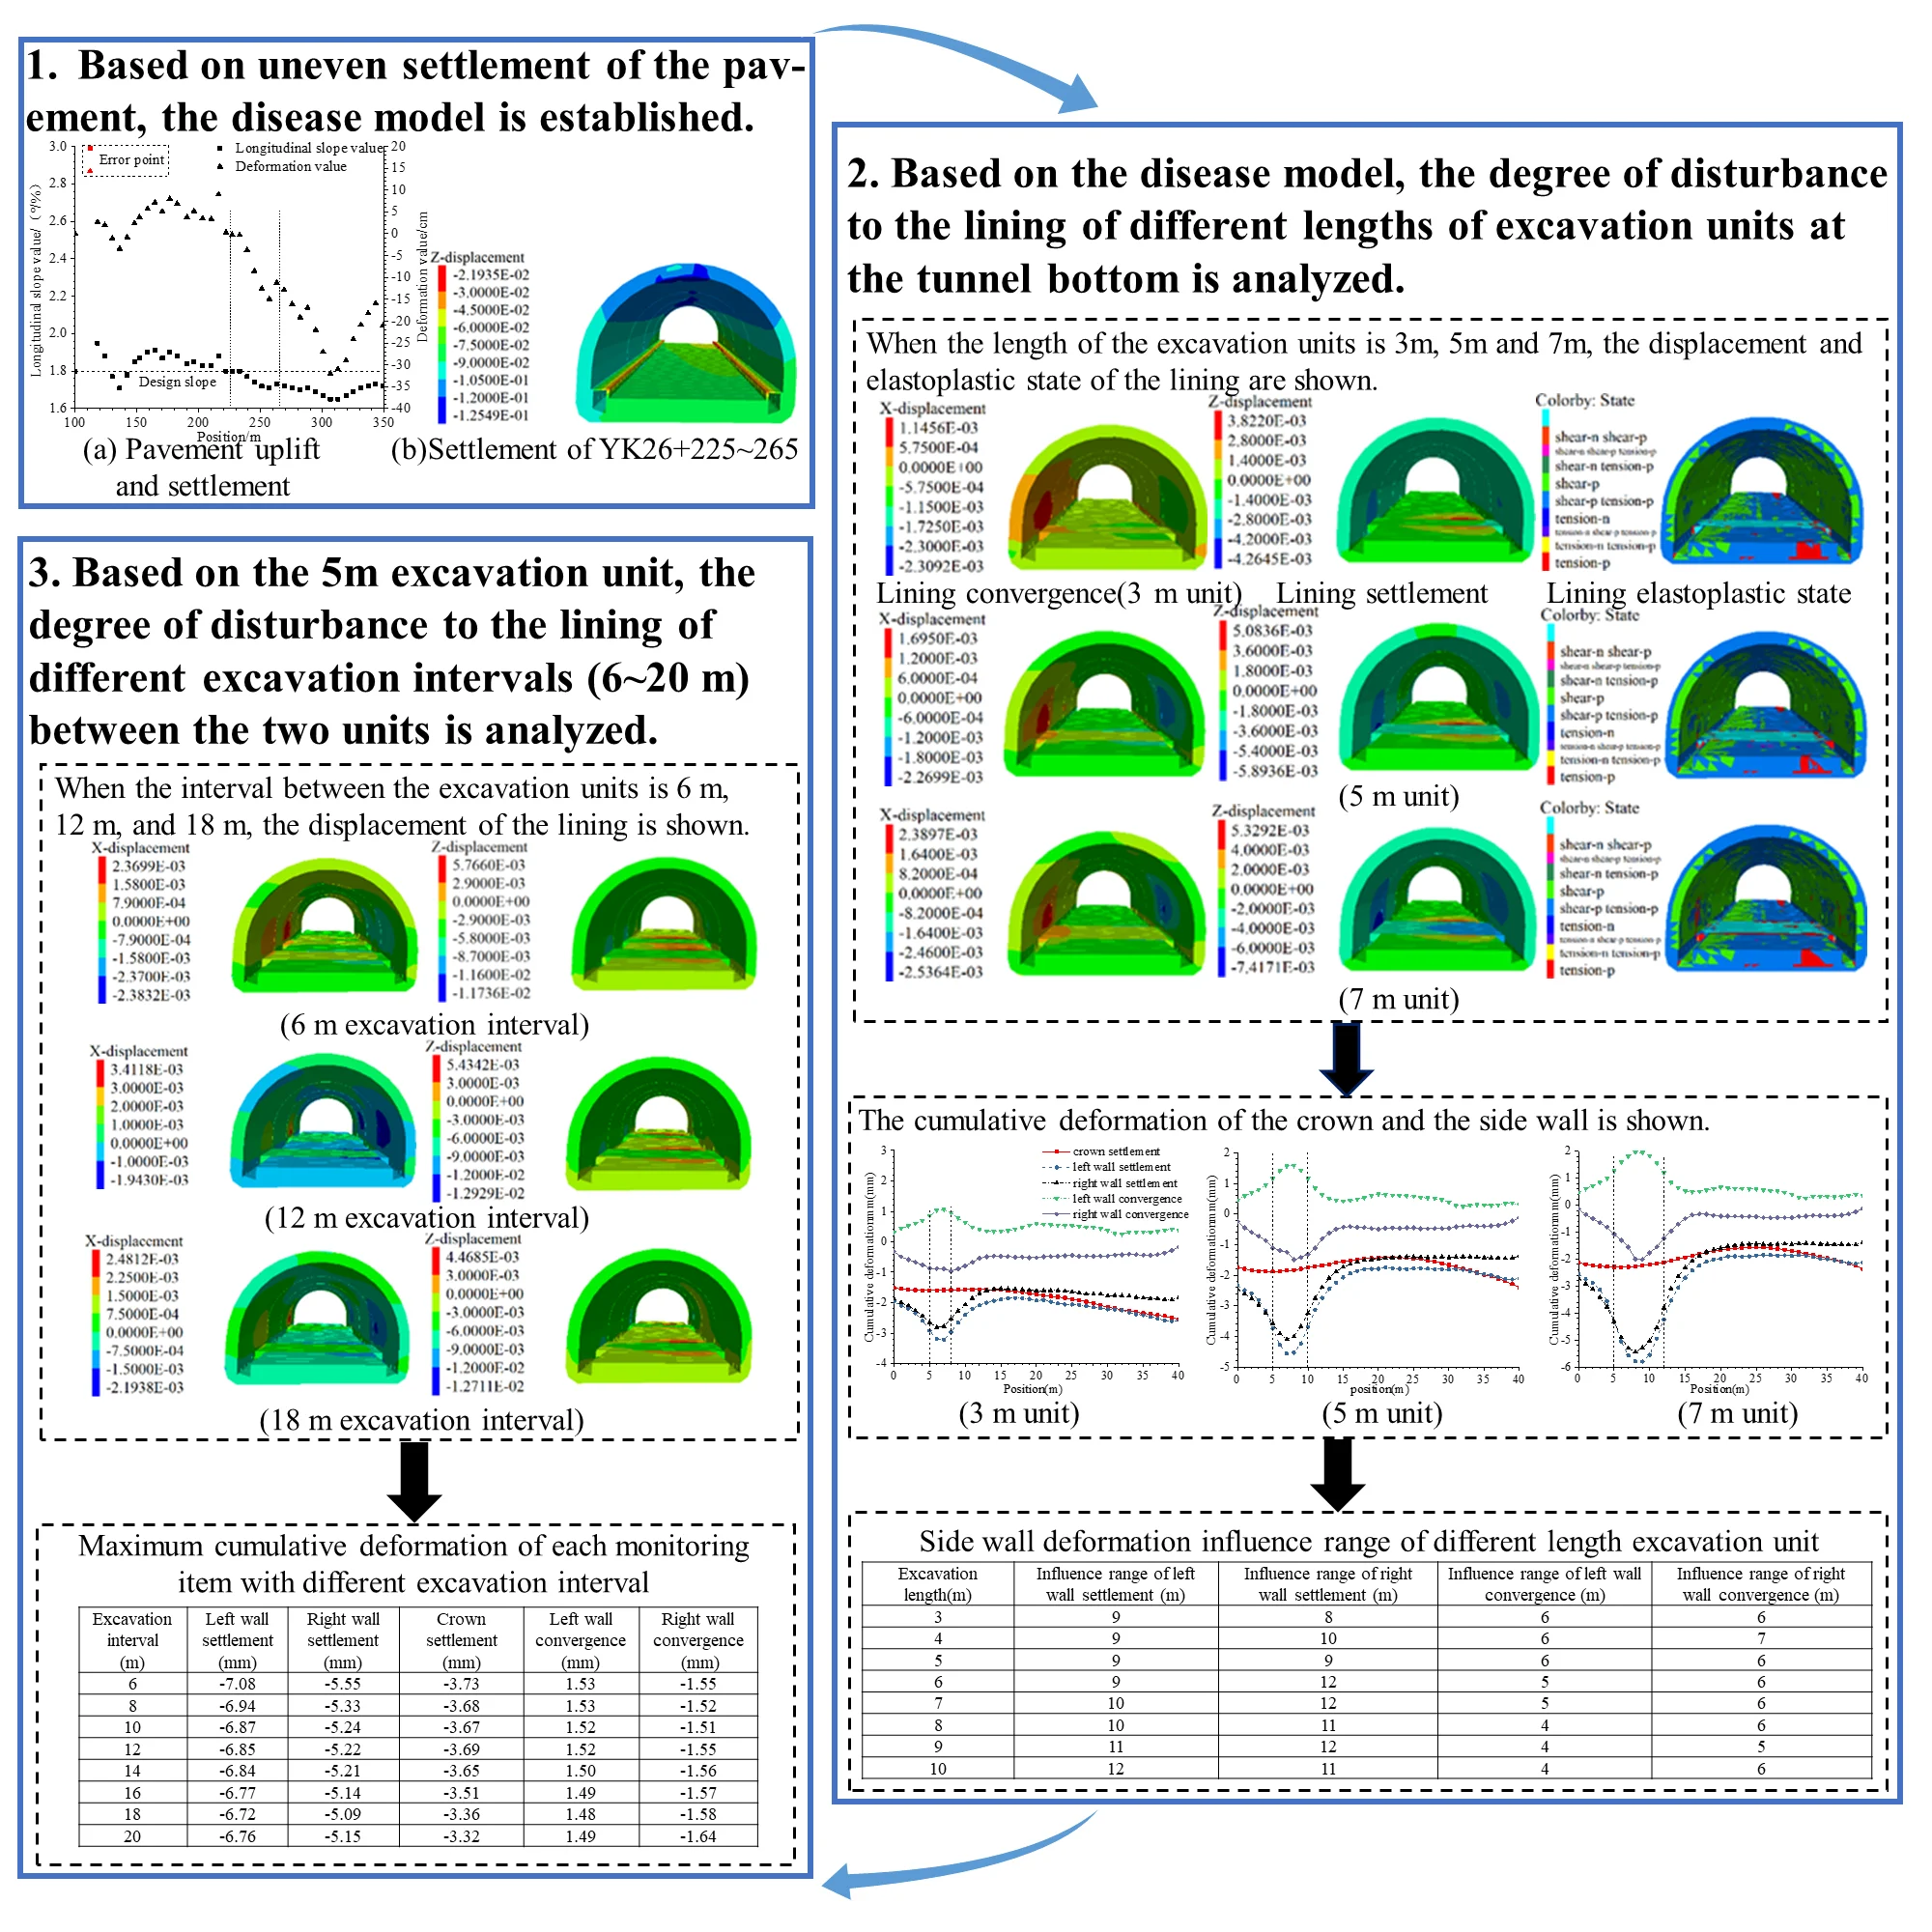
In order to analyze the degree of disturbance to the lining by the full-width excavation and reinforcement of the tunnel bottom, and determine the length of the excavation unit, and the excavation interval and improve the monitoring measurement plan. Through field observation and numerical simulation comparative analysis and verification, it is determined that the deformation of the lining equals mainly the deformation of the side wall, the influence range of the settlement of the side wall is greater than that of the convergence, the maximum value of the maximum principal stress of the lining is mainly distributed from the side wall of the excavation area to the arch line, the side wall of the excavation area produces shear yield when the length of the excavation unit reaches 5m, and the influence area will cross influence when the excavation interval is less than twice the influence area. Based on the distribution law of lining deformation, principal stress and elastoplastic area, it is recommended that the length of the excavation unit should be less than 5m, the excavation interval should be greater than twice the influence range of the side wall settlement; and the monitoring section should be arranged at the central section of the excavation area, the interval of the monitoring section should be determined according to the location of the excavation unit, the monitoring scope may not extend to the unreinforced section, and the settlement of the side walls should be increased.
Highlights
- The degree of disturbance to the lining by different excavation unit lengths is analyzed, and the distribution law of lining deformation, maximum principal stress and elastoplastic state is obtained.
- The degree of disturbance to the lining by different excavation intervals is analyzed, and the distribution law of lining deformation, maximum principal stress and elastoplastic state obtained.
- Based on the distribution law, the length of the tunnel bottom excavation unit, the excavation interval between the two units and the monitoring and measurement plan were discussed.
1. Introduction
Tunnel pavement is an important part of the tunnel civil structure which directly affects the overall stability of the tunnel structure. When the pavement has uneven deformation, broken plates, staggered platform and other diseases, it will pose a serious threat to driving safety; during the treatment of pavement diseases, the tunnel bottom excavation and reinforcement will cause disturbance to the original lining structure. For the treatment of pavement deformation, the literatures [1-6] start from the factors that cause road surface deformation (in-situ stress, water, rock structure, supporting structure, etc.), and put forward corresponding treatment measures, and made a comparative analysis of the effects of different treatment measures on disease control. “Technical Specifications for Strengthening of Highway Tunnel” [7] stipulates that the length of the excavation unit at the bottom of the tunnel should not exceed 5 m; when excavating the bottom of the tunnel, monitoring of the lining should be carried out, the monitoring section interval is about 10m, and the monitoring range extends from the construction section to the unreinforced section by 20 to 30 m.
Regarding the treatment of pavement diseases of operating tunnels, the existing researches focus on the causes of pavement diseases and the effects of different treatment measures, however, little research concern the degree of disturbance of the original lining structure by the excavation and reinforcement during the treatment process, and the existing specification [7] on the length of the tunnel bottom excavation unit, the excavation interval between the two units, monitoring measurement section layout, monitoring scope, and monitoring project have yet to be studied.
Through field investigation, measurement and numerical simulation, analyzing the degree of disturbance to the original lining structure by the length of the full-width excavation of the tunnel bottom and the excavation interval of the two units, and obtaining the distribution law of lining deformation, maximum principal stress and elastoplastic state.
2. Project overview
This tunnel is a mountainous stone separated two-way four-lane highway tunnel, and the stratum is mainly sandstone and mudstone. 5 fault fracture zones and 22 normal faults pass through the tunnel. The underground water of the tunnel is mainly clastic rock fissure water. The maximum horizontal principal stress of the tunnel is 2.3~8.4 Mpa, the orientation is N53°E, and the minimum horizontal principal stress is 1.8~6.9 MPa [8]. The tunnel was opened to traffic in June 2012, however, after 8 years operation, pavement uneven undulations, pavement cracks, pavement broken plates and pavement staggers were found on ZK26+435~480, ZK27+535~595, YK26+100~350, YK27+535~595. In order to ascertain the degree of pavement diseases, pavement undulation measurement was carried out on the YK26+100~350 paragraph as shown in Fig. 1.
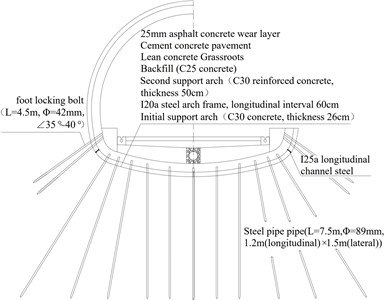
Tunnel pavement disease passages all pass through or near the fault fracture zone. Among them, YK26+100~350 pass through the fault fracture zone (F13 normal fault), rock formation direction angle and dip angle are 132°∠16°, F13 fault direction angle and dip angle are 350°∠61°~65°. Section YK26+183-350 belongs to Ⅴ-level surrounding rock, and YK26+100-183 is Ⅳ-level surrounding rock. Slightly weathered interlayered sand and mudstone from the Lower Triassic Heshanggou Formation (T1h) to the Middle System Ermaying Formation (T2er) formed the grade Ⅳ surrounding rock, (sandstone) = 40~55 MPa, (mudstone) = 15~25 MPa; the Ⅴ-grade surrounding rock is composed of the slightly weathered sand and mudstone of the Triassic Middle System Ermaying Formation (T2er), (sandstone) = 25~40 MPa, (mudstone) = 10~20 MPa. The supporting parameters of the original design grade Ⅴ surrounding rock fracture zone are: Radial parameter – 42 mm small catheter, = 4 m, 60×60 cm; I20a steel arch frame, longitudinal interval – 60 cm, sprayed C30 steel fiber concrete thickness – 26 cm; thickness of secondary lining cast-in-place C30 reinforced concrete 50 cm; C15 flake concrete backfill. Aiming at the pavement diseases, it is planned to adopt the re-construction of the tunnel bottom arch and build a tunnel bottom steel pipe pile reinforcement plan, Fig. 2 shows the reinforcement design of the tunnel bottom at the fracture zone of the Ⅴ-grade surrounding rock fault.
Fig. 1Pavement uplift and settlement
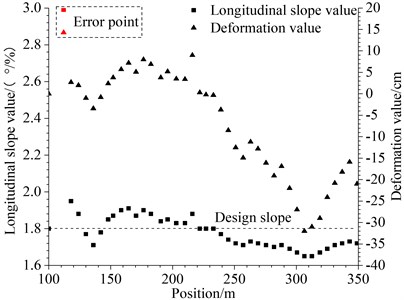
Fig. 2Reinforcement design of tunnel bottom
3. Field test
3.1. Construction process
For the treatment of tunnel bottom diseases, a full-width excavation and reinforcement construction scheme is adopted. It can be divided into various construction processes: 1) Construction preparation stage: geological exploration, measuring point layout, cable trench removal, and foot locking bolt layout; 2) Tunnel bottom excavation stage: tunnel bottom excavation, wall foot cut excavation; 3) Reinforcement and support stage: construction of steel pipe piles at the bottom of the tunnel, construction of initial support arch and second support arch, drainage pipe and filling layer construction, and auxiliary engineering construction.
3.2. Monitoring and measurement
According to the specification [7], a monitoring and measurement plan is developed together with the construction organization plan. Monitoring instrument: TS02plus Leica total station; monitoring method: measurement on opposite sides; monitoring items: crown settlement, peripheral convergence, side wall convergence, side wall settlement; position of monitoring section: central section of excavation unit; monitoring frequency: 1 time/d, Monitoring measurement points and lines are shown in Fig. 3, the cumulative deformation of each item in YK26+232~258 is shown in Table 1.
Fig. 3Measuring point and line layout
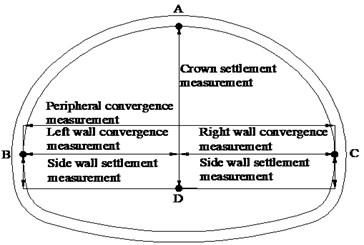
Table 1Cumulative deformation of lining at YK26+232~258
Monitoring section (Excavation range) | Left wall convergence (mm) | Right wall convergence (mm) | Peripheral convergence (mm) | Left wall settlement (mm) | Right wall settlement (mm) | Crown settlement (mm) |
YK26+236 (YK26+232~240) | 3.25 | 3.60 | 6.70 | 6.15 | 6.75 | 2.30 |
YK26+242 (YK26+240~245) | 2.20 | 1.45 | 3.60 | 5.25 | 5.10 | 2.60 |
YK26+248 (YK26+245~252) | 3.50 | 1.45 | 5.00 | 7.00 | 7.10 | 3.85 |
YK26+255 (YK26+252~258) | 3.10 | 1.50 | 4.30 | 6.75 | 6.80 | 3.50 |
By analyzing Table 1, the following conclusions can be obtained initially: lining deformation is affected by excavation size; lining deformation is mainly based on the side wall deformation, and the side wall deformation is based on the side wall settlement; the cumulative settlement of the side wall is generally greater than the cumulative settlement of the crown; the peripheral cumulative convergence is basically the sum of the cumulative convergence of the left wall and the right wall.
4. Numerical simulation
Based on the limitations of field test conditions, the block discrete element software was used to simulate the disturbance of lining by different length excavation units and different excavation intervals between two units, and obtain the distribution law of lining displacement, stress and elastoplastic state under different working conditions.
4.1. Numerical model
The tunnel axis direction is taken as the y-axis, the buried depth direction is taken as the -axis, and the lateral direction is considered as the x-axis. The actual buried depth of the tunnel is 280.5 m, the bottom of the model is 70 m, the left and right sides are about 5 times the hole diameter, and the tunnel axis is 40 m (pile number YK26+225~265). A meshed model is created using the method of gradual encryption of tetrahedral mesh. The left and right sides of the model ( = –50 m, 50 m) are imposed horizontal displacement constraints, the front and rear sides ( = 0 m, 40 m) are imposed by horizontal displacement constraints, and the bottom boundaries ( = –70 m) are imposed by vertical displacement constraints.
Rock block, stratum bedding and concrete support adopt elastoplastic constitutive relationship – Mohr-Coulomb failure criterion, anchor rod adopts Cable element, foot locking bolt and steel pipe pile adopt Axial element. Mechanical parameters of rock blocks are shown in Table 2 [8], and mechanical parameters of rock bedding are shown in Table 3 [9].
Table 2Mechanical parameters of rock blocks
Category | Density (kg∙m-3) | Young’s modulus (MPa) | Poisson’s ratio | Friction angle (°) | Cohesion (MPa) |
Sandstone | 2740 | 6313 | 0.32 | 39 | 8.35 |
Mudstone | 2750 | 6362 | 0.3 | 35 | 5.21 |
Fault fracture zone | 2730 | 1331 | 0.4 | 27 | 3.06 |
Table 3Mechanical parameters of rock bedding
Category | Normal stiffness (MPa∙m-1) | Shear stiffness (MPa∙m-1) | Friction angle (°) | Cohesion (MPa) |
Sandstone bedding | 1574 | 596 | 35 | 0.8 |
Mudstone bedding | 1822 | 701 | 30 | 0.5 |
Sandstone and Mudstone bedding | 1698 | 649 | 33 | 0.65 |
Fault bedding | 341 | 157 | 20 | 0.3 |
4.2. Pavement disease simulation
After the in-situ stress of the rock mass is balanced, the tunnel is excavated, and the construction process of the tunnel becomes the stress release process. With reference to the surrounding rock level, the stress release is gradually achieved according to the empirical value. The initial stress release is 40 % of the initial stress before the initial support is applied; the secondary stress release is 50 % of the initial stress before the secondary lining is applied. Residual stress is shared by supporting structure and surrounding rock, the softening area is determined according to the distribution of the plastic zone at the tunnel bottom and the state of the exposed water from the excavation of the tunnel bottom. The displacement shall be reset before softening of the tunnel bottom to 0, and the settlement and horizontal displacement of the model during the softening of the tunnel bottom, as shown in Fig. 4 shall be calculated.
When simulating the uneven settlement of 5~9 cm occurred in the rock mass and supporting structure, in the direction of burial depth, and the uneven settlement of the tunnel pavement shall considered taking into account the fact that, the top surface of the cable trench is relatively inclined. The numerical simulation results are basically consistent with the measured uneven settlement (0~15 cm) of the pavement and the relative inclination of the top surface of the cable trench.
Fig. 4Settlement and convergence of model
a) Horizontal displacement of rock mass and lining
b) Settlement of rock mass and lining
4.3. Simulation of disease treatment
4.3.1. Disturbance of length of excavation unit of tunnel bottom to lining
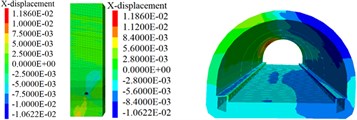
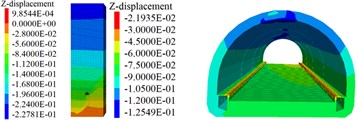
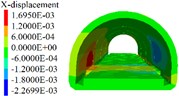
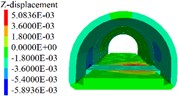
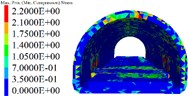
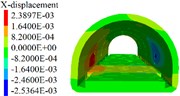
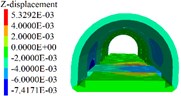
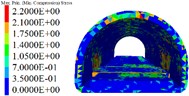
Based on the disease model, the degree of disturbance to the lining of different lengths of excavation units at the tunnel bottom is simulated. When the length of the excavation units is 3 m, 5 m and 7 m, the parameters displacement, stress and elastoplastic state of the lining correspond to the one shown in the Figs. 5 to 7. A survey line is arranged on the crown and the side wall, and the cumulative deformation of each point of the crown and the side wall is shown in Fig. 8.
Fig. 5Lining displacement, stress, elastoplastic state (3 m unit)
a) Lining convergence
b) Lining settlement
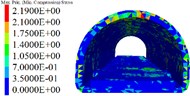
c) Lining maximum principal stress
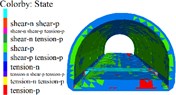
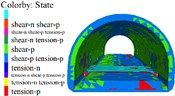
d) Lining elastoplastic state
Fig. 6Lining displacement, stress, elastoplastic state (5 m unit)
a) Lining convergence
b) Lining settlement
c) Lining maximum principal stress

d) Lining elastoplastic state
Fig. 7Lining displacement, stress, elastoplastic state (7 m unit)
a) Lining convergence
b) Lining settlement
c) Lining maximum principal stress
d) Lining elastoplastic state
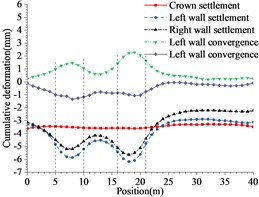
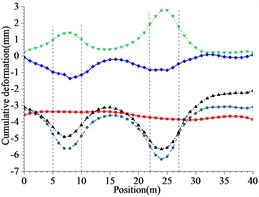
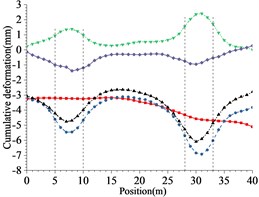
Fig. 8Cumulative deformation at each point of crown and side wall
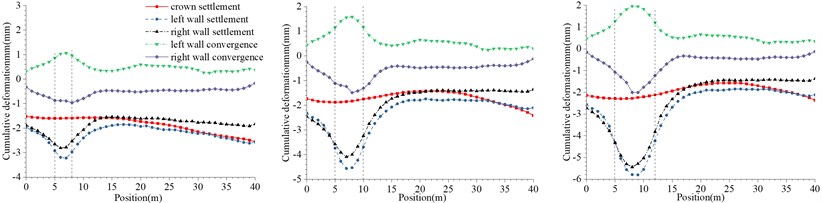
The deformation difference of the adjacent measuring points on the right side of the excavation area is depicted from in Fig. 8 as –0.02~0.02 mm (the left wall converges 0~0.02 mm, the other –0.02~0 mm) with the boundary of the affected area at the excavation reinforcement place, so the influence range of the side wall deformation of the excavation and reinforcement unit with different lengths at the bottom of the tunnel, can be obtained as per Table 4.
Table 4Side wall deformation influence range of different length excavation and reinforcement unit
Excavation length (m) | Influence range of left wall settlement (m) | Influence range of right wall settlement (m) | Influence range of left wall convergence (m) | Influence range of right wall convergence (m) |
3 | 9 | 8 | 6 | 6 |
4 | 9 | 10 | 6 | 7 |
5 | 9 | 9 | 6 | 6 |
6 | 9 | 12 | 5 | 6 |
7 | 10 | 12 | 5 | 6 |
8 | 10 | 11 | 4 | 6 |
9 | 11 | 12 | 4 | 5 |
10 | 12 | 11 | 4 | 6 |
The maximum cumulative deformation of each monitoring item of the lining is determined by means of the displacement cloud diagram and Table 4, and a regression analysis of the maximum cumulative deformation for each project as well as the calculation of the length of the excavation and reinforcement unit can be made, (see Fig. 9).
Fig. 9Regression of maximum cumulative deformation of lining monitoring items
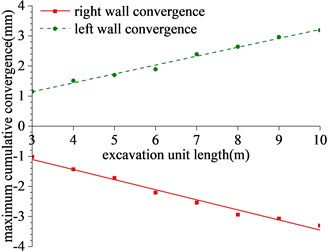
a) Regression of maximum cumulative convergence
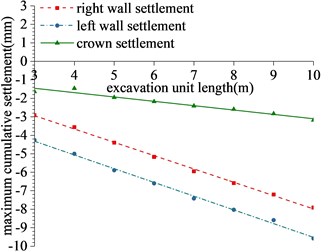
b) Regression of maximum cumulative settlement
By simulating the length of different excavation and reinforcement units at the tunnel bottom, the following results can be obtained from the cloud map of lining displacement, stress, elastoplastic state.
1) As shown in Figs. 5 to 7(a), 7(b) and Fig. 8, during tunnel excavation and reinforcement, the deformation of the lining is mainly the deformation of the side wall. Compared with the deformation of the side wall, the settlement of the vault is less disturbed by construction. 2) As per Fig. 5 to 7(c), the range of values of the maximum principal stress of the lining is mainly distributed from the side wall to the arch line of the excavation and reinforcement area, and some areas are close to the 2.2 MPa ultimate tensile strength of C30 concrete, and the distribution area and density increase with the increase of excavation length. 3) From Figs. 5 to 7(d), when the excavation length reaches 5 m, the shear yield of the side wall of the excavation and reinforcement area occurs, and as the excavation length increases with the corresponding increase of the yield area. 4) From Table 4 and Fig. 8, within the influence range of the side wall deformation, the side wall convergence and side wall settlement are basically parabolic and symmetrically distributed, and the peak value is located at the central cross section of the excavation area, and the influence range of the side wall settlement (about 10 m) is greater than the convergence influence range (about 6 m). 5) From Fig. 9, a certain linear relationship takes place between the maximum cumulative deformation of the lining monitoring items and the length of the excavation and reinforcement unit, and it increases with the length of the excavation and reinforcement unit.
4.3.2. Disturbance of Excavation Interval to Lining
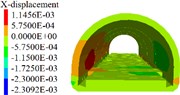
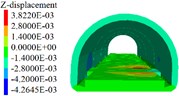
The 5 m excavation and reinforcement unit is taken as an example to simulate the degree of disturbance to the lining of different excavation intervals (6~20 m) between the two units. When the distance between the excavation units is 6 m, 12 m, and 18 m, the displacement, stress, and elastoplastic state of the lining are as shown in Figs. 10 to 12. A survey line is placed on the crown and the side wall, the cumulative deformation of each point of the crown and the side wall is shown in Fig. 13.
Fig. 10Lining displacement, stress, elastoplastic state (6 m excavation interval)
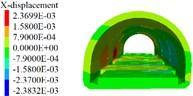
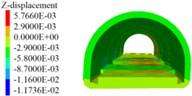
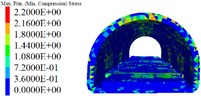
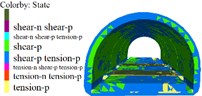
Fig. 11Lining displacement, stress, elastoplastic state (12 m excavation interval)
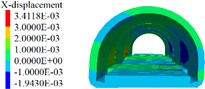
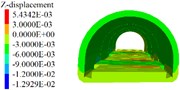
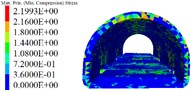
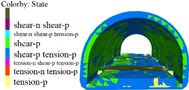
Fig. 12Lining displacement, stress, elastoplastic state (18 m excavation interval)
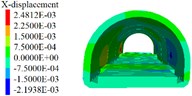
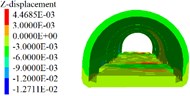
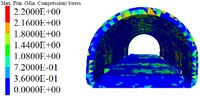
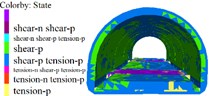
Fig. 13Cumulative deformation at each point of side wall and crown
a) 6 m excavation interval
b) 12 m excavation interval
c) 18 m excavation interval
Table 5Maximum cumulative deformation of each monitoring item with different excavation interval
Excavation interval (m) | Left wall settlement (mm) | Right wall settlement (mm) | Crown settlement (mm) | Left wall convergence (mm) | Right wall convergence (mm) |
6 | –7.08 | –5.55 | –3.73 | 1.53 | –1.55 |
8 | –6.94 | –5.33 | –3.68 | 1.53 | –1.52 |
10 | –6.87 | –5.24 | –3.67 | 1.52 | –1.51 |
12 | –6.85 | –5.22 | –3.69 | 1.52 | –1.55 |
14 | –6.84 | –5.21 | –3.65 | 1.50 | –1.56 |
16 | –6.77 | –5.14 | –3.51 | 1.49 | –1.57 |
18 | –6.72 | –5.09 | –3.36 | 1.48 | –1.58 |
20 | –6.76 | –5.15 | –3.32 | 1.49 | –1.64 |
The maximum cumulative deformation of the lining of the first excavation and reinforcement unit is summarized. See Table 5 for the maximum cumulative deformation of each monitoring project with different excavation intervals.
The following results can be obtained from Figs. 10 to 12 and Table 5:
1) From Figs. 10 to 12 and Table 5, it can be seen that the excavation interval is less than twice the affected area, the affected areas will cross influence each other, when the excavation distance is greater than the single affected area and less than twice the affected area, the fluctuation of the maximum cumulative deformation value of each item is relatively small. 2) From Figs. 10 to 12, the maximum value of the maximum principal stress of the lining is mainly distributed from the side wall to the arch line of the excavation area, and the distribution area are less affected by the excavation interval. 3) As seen in Figs. 10 to 12, the side wall reached the yield state during the simulation process, and then returned to the elastic state, after the calculation is completed, it is basically in the elastic state. 4) With the increase of the excavation interval, the maximum deformation of the side walls and crown basically decreases gradually.
5. Conclusion
Taking the operation tunnel as the research object, the method of combining on-site investigation, measurement and numerical simulation was used to analyze the degree of disturbance to the lining by different excavation unit lengths and different excavation distances between the two units, and to obtain the distribution law of lining deformation, maximum principal stress and elastoplastic state. Based on the distribution law, the length of the tunnel bottom excavation unit, the excavation interval between the two units and the monitoring and measurement plan in the “Technical specifications for strengthening of highway tunnel” were discussed. the main conclusions are as follows:
1) When the tunnel bottom is fully-width excavated and reinforced, the lining deformation is equal mainly to the deformation of the side wall in the excavation and reinforcement area, and the crown is relatively less disturbed by the construction; the influence of the side wall settlement is about 10 m, the influence range of the side wall convergence is about 6 m. Within the influence range of the side wall deformation, which is parabolic, the peak value is located at the center of the excavation area, and within the settlement effect range, the maximum cumulative deformation of each project has a certain linear growth relationship with the length of the excavation unit. The maximum value of the maximum principal stress of the lining is mainly distributed from the side wall to the arch line of the excavation area, and the distribution area and density increase with the length of excavation unit. When the length of the excavation unit exceeds 5 m, the shear yield of the side wall of the excavation area occurs locally, and as the length increases, the yield area increases. It is recommended that the length of the excavation unit is less than 5 m.
2) When the excavation interval between two units is less than 2 times the side wall deformation affected area, the affected areas cross each other. During the construction process, it is necessary to ensure that the excavation interval is greater than 2 times the settlement affected area. In the case of unsatisfactory conditions, it can be less than 2 times settlement affected area and greater than single settlement effect area.
3) Based on the distribution law of lining deformation, principal stress and elastoplastic area, it is recommended that the monitoring section should be arranged at the central section of the excavation area, the interval of the monitoring section should be determined according to the location of the excavation unit, the monitoring scope might not extend to the unreinforced section, and the settlement of the side walls should be increased.
References
-
Kong Heng, Wang Meng-Shu, Zhang De-Hua Causation and Classification of tunnel floor heave and its control. China Safety Science Journal, Vol. 13, Issue 1, 2003, p. 33-36.
-
Xue Xiao-Hui, Zhang Jun, Su Zhong-Ming Study on mechanism and prevention measures of floor heave in WuDuxi tunnel. Highway Engineering, Vol. 40, Issue 5, 2015, p. 124-128.
-
Xiao Xiao-Wen, Wang Li-Chuan, Yang Jun-Sheng Cause analysis and treatment scheme for bottom heave of ballastless track tunnel in nearly horizontally interbed rock mass with high geostress. China Railway Science, Vol. 37, Issue 1, 2016, p. 78-84.
-
Wang Su-Kang Study on behavior of heave deformation of tunnel invert and its engineering countermeasures. Beijing Jiaotong University, Beijing, 2018.
-
Zhang Hua-Chuan Research on Mechanical Mechanism and Treatment Technology of Tunnel Floor Heave in Swelling Rock. Chang’an University, Xi’an, 2018.
-
Wang Ming-Nian, Weng Han-Min, Li Zhi-Ye Study on mechanic behavior of tunnel invert. Chinese Journal of Geotechnical Engineering, Vol. 18, Issue 1, 1996, p. 46-53.
-
Technical Specifications for Strengthening of Highway Tunnel. People’s Communications Press Co., Ltd., Beijing, 2019.
-
Guo Xi-Feng, Zhang Ming-Xin, Yin Jian-Min Characteristics of in-situ stress field in BaoTashan extra-long tunnel. Journal of Yangtze River Scientific Research Institute, Vol. 28, Issues 6-2011, 55, p. 58-86.
-
Kang Hong-Pu, Fan Ming-Jian, Gao Fu-Qiang Deformation and support of rock roadway at depth more than 1000 meters. Chinese Journal of Rock Mechanics and Engineering, Vol. 34, Issue 11, 2015, p. 2227-2241.
About this article

