Abstract
Methods of digital image analysis find wide application both in scientific research and in many branches of industry. During the last decades, interest has grown in images with multifractal structure which are obtained in biology, medicine, chemistry and studying the soil. The mathematics of fractals and fractal geometry are well known and studied. However, despite this, a common approach to designing the methods of practical investigation of such images has not been developed until now. The main purpose of this work is to propose the using of multifractal formalism as the mathematical tool for the statistical description of multifractal sets. Such a description adequately depicts the chaotic behavior of the majority of real systems. The method for calculation of Rényi and singularity spectra based on using parametrized spectra, which are obtained from escort (zooming) distributions of an initial measure, is considered. The method for comparing images based on using vectors of divergences calculated for the sequence of escort distributions is proposed. The role of parametrized spectra as the tool for the approximation of any part of the singularity spectrum is substantiated. An estimation of the rate of growth of the divergence vector is obtained. Main theoretical results are confirmed by numerical experiments with images of biomedical preparations. These show the ability of the implemented methods to find subtle distinctions in image structure for a simple choice of an initial measure.
Highlights
- Multifractal structure of a digital image may be described by using escort distributions.
- Escort distributions are a one-parametric family of normed distributions obtained from an initial measure by the using the function of moments.
- Based on escort distributions parametrized spectra may approximate any part of multifractal spectrum.
- Vector of Rényi divergences is calculated on the sequence of escort distribution, and the rate of its growth indicates a closeness of images.
- These characteristics allow finding subtle differences in image structures.
1. Introduction
Digital image analysis has a wide application in many areas of scientific exploration. The methods of image analysis are based on revealing some distinguishing features, such as morphometric, morphological or textural This method has been very promising in biology and medicine [1, 2], last years it holds much favor in investigation of the quality of food [3, 4]. Modern technologies give a possibility to use SEM images in engineering, construction and material sciences [5, 6].
It is a matter of general experience that many digital images appearing in investigations in different fields are phase portraits of complex systems. A great number of physical systems demonstrate chaotic behavior. Their phase portraits have a complex structure which may be interpreted as a fractal or multifractal set having the property of statistical scaling invariance (or statistical self-similarity). This property is described by a scaling component which is called fractal dimension of a set. Multifractals are unions of fractal subsets; each subset is characterized by its own scaling component. Such subsets are arranged in a complex intertwined way. For a multifractal set one can consider a natural generalization of fractal dimension – multifractal spectrum, i.e. the set of fractal dimensions of its subsets.
A natural way for studying multifractal sets is a statistical description. As chaotic systems generate on their phase spaces highly nonuniform probability distributions (measures), one can consider a partition of the space. The measure of -th box of the partition may be interpreted as the relative frequency of visits to this box by the system trajectories. Such an approach is called multifractal formalism.
Multifractal formalism describes statistical properties of a probabilistic measure in terms of its moments of an order , i.e. -powers of the box measures of a partition. Assuming that is a real parameter, we obtain moments of any order. The sum of moments is called generalized statistical sum. The first characteristics of multifractal sets based on the calculation of generalized statistical sum was proposed by Rényi. It has come to be known as the spectrum of generalized dimensions or Rényi spectrum. It describes a measure distribution by using its moments. Another method for multifractal description is to calculate the singularity exponents for each box and group all the boxes with close values of exponent into one subset. In doing so, we divide the multifractal into nonintersecting subsets. Fractal dimensions of these subsets form a multifractal spectrum, which is called singularity spectrum.
Under the conditions that the sum of the moments follows the power law and the exponent is a differentiable function, the Rényi and singularity spectra are connected by the Legendre transformation. Since in the literature the Rényi spectrum was introduced earlier than the singularity one and its computation is easier than the latter, it gained wide acceptance.
As the Legendre transformation is defined between smooth functions given analytically, it may lead to an incorrect result if one of the spectra was obtained approximately from experiments. One of the reasons is that the log-log plots used when calculating Rényi spectra by definition show a scatter not perfect linear behavior. In addition, Rényi dimensions for large negative ’s may have considerable error intervals, because they characterize the nonuniformity of the measure in rarer regions and depend on both the number of points in a box and the box size.
To overcome this impediment one should obtain the singularity spectrum as two -parametrized functions. For this purpose, we use moments of a measure normalized by the generalized statistical sum and generate from the initial measure a set of its -parametrized renormalization (escort distributions). Such a transformation is called direct multifractal transformation. Then we calculate the set of information dimensions for supports of the escort distributions, and the set of average values of singularity exponents of the initial measure with respect to these distributions. What is important is that the constructed functions are connected by the Legendre transformation. The singularity spectrum is obtained by excluding parameter By now the most effective approach to calculate Rényi spectra is to compute firstly the singularity spectrum and then the Rényi spectrum by using the Legendre transformation.
Escort distributions are independent in the sense that multifractal transformations form a group, and the set of all probability distributions may be divided into nonintersecting classes of equivalence. The important role of these distributions in the study of multifractal systems was discussed in [7, 8]. Such a sequence of measures may be used when comparing images by calculation of Rényi divergences (-divergences) between not only initial measures but also the generated escort distributions of these measures. In doing so we obtain a vector of divergences and its rate of growth shows how similar the images are.
The main objectives of our work are to substantiate the advantages of multifractal formalism and to demonstrate that the applications of escort distributions are a reliable mathematical method for the analysis of complex images generated by chaotic systems. The implemented methods for obtaining parametrized spectra and vectors of divergences allow us to find unique classifying signs for high resolution textures. Of fundamental importance is the possibility to calculate parametrized spectra for any given interval of the parameter with a small enough step. In other words we may approximate any part of singularity spectrum (and the Rényi spectrum as well) with a given precision.
2. Methodology
As it was mentioned in the previous section, one of main goals of our study is to show the applications of some methods of multifractal analysis to complex digital images. This study consists of two parts. In the first part, we give the descriptions of Rényi and multifractal spectra, escort distributions, direct multifractal transformation and Rényi divergences. Escort distribution is a tool for dividing a multifractal set into nonintersecting subsets, and based on them parametrized spectra gives the possibility to calculate singularity spectrum. We also consider a new method for image comparing which is based on the calculation of divergences on the sequences of escort distributions and give the estimation of the rate of growth of the divergence vector. The second part contains the results of applications of computational methods to the images of pharmaceutical solutions with nanoparticles of silver and images of bone tissues. In the conclusion, we summarize the results of the work.
2.1. Rényi spectrum
Consider a set , and a partition on boxes with box size . Define a probability measure , ,
Consider also the generalized statistical sum (sum of moments of measure):
where
For introduce the function:
which specifies a class of Rényi entropies. When we have Shannon’s entropy:
Generalized Rényi dimensions (or Rényi spectrum) may be defined as:
But it is more common to assume that and define Rényi dimensions by using Eq. (1):
It is easy to check that is a nonincreasing function of .
In multifractal techniques, it is assumed that for a box of size satisfies the relation:
It is also assumed that:
where is function.
Here and throughout the symbol indicates the asymptotic relation, namely Eq. (5) and Eq. (6) should read:
Taking into account the assumptions made we may write Eq. (4) in the form:
Note that as a rule we choose a partition of the set considered so that , but some authors consider the partition with boxes of size such that and assume that [9]. In this case we have:
Rényi dimensions for 0, 1, 2 are respectively capacity, information and correlation dimensions. In this work we use information dimension:
Rényi spectrum may be successfully applied as a classifying sign in image analysis. In [10] generalized dimensions were used to define the degree of destruction of metal; in [11] the authors analyzed and classified images of petroglyphs of Karelia. The papers [12, 13] are devoted to the application of Rényi spectra to the analysis of images of biomedical preparations.
2.2. Direct multifractal transformation and escort distribution
Consider an initial measure and the measure obtained by the following transformation:
This formula defines a sequence of renormalization of initial distribution, and the transformation is called direct multifractal transformation. If (and hence then for any . Because of this, it is natural to interpret the transformation as a method to reveal a degree of nonuniformity of the initial measure. The transformations form a group: there are unity and inverse elements for and for the uniform distribution is the fixed point of the transformation. With respect to the transformation the set of all probability measures is divided into nonintersecting equivalence classes. It means that when changing we come to different initial measures , and different sequences of measures given by Eq. (9). The set of generated measures gives a multifractal description of an image (object).
It is interesting to note the connection of the sequence Eq. (9) with a class of optimization problems (conditional extremum task). Let , , be a probability measure defined on a partition with a given box size. Find the distribution maximizing Shannon's entropy subject to the conditions that:
The solution of the problem is so called escort distribution:
where – the Lagrange multiplier. It is defined from the conditions Eq. (9a). The distribution Eq. (10) is a particular case of Eq. (9), where the Lagrange multiplier is considered as a parameter.
Thus distribution Eq. (9) may be interpreted as a parametrized set of solutions for a sequence of optimization problems of the given class. In other words, for any initial probability distribution there is the distribution of the form Eq. (10) that maximizes Shannon entropy under the conditions Eq. (9a). And vice versa, there is such that the distribution Eq. (10) solves the optimization problem described.
2.3. From Rényi spectrum to the multifractal one. Legendre transformation
Rényi spectrum describes the changing of an initial measure by the use of its moments. Multifractal spectrum shows the distribution of the measure in accordance with singularity components , namely consists of fractal dimensions of subsets which are unions of boxes having close values of exponents. In literature it is also known as scaling spectrum.
A natural method accepted in multifractal formalism to connect Rényi spectrum (defined by parameter and multifractal spectra (defined by scaling exponents) is to assume that the number of boxes with exponent is distributed with a probability density.
Denote by the number of boxes with exponents , such that Then the probability that belongs to this interval is . It is also assumed that , where is a differentiable function. It is the fractal dimension of the set of boxes with exponent . In such a manner we model a distribution of the measure on nonintersecting subsets having different fractal dimensions.
In terms of the probability density generalized statistical sum may be written as:
To take all the boxes with a given exponent we have to find for which the integrand function has maximum. Clearly this value depends on .
As is small enough the integrand is maximal when is minimal. The conditions of extremum existence is , and we obtain:
The value of the integral in Eq. (11) is proportional to the value of the integrand in the extremum point and substituting this value in Eq. (11) we have . Thus, for any we find the fractal dimension of the set consisting from the boxes with exponent
According to Eq. (6) we obtain the relation between and :
Note that:
Using Eq. (7) we obtain
The transfer from variables to is given by formulas Eq. (13) and Eq. (14) and is called the Legendre transformation. Inverse transformation from to is performed by using Eq. (12) and It is useful to note that Eq. (13) leads to the calculation of via and , and .
The detailed description of the Legendre transformation is given in [15, 16].
2.4. From multifractal spectrum to Rényi
The main approach to calculation of the Rényi spectra was initially based on Eq. (4) and Eq. (7), where for finding the approximation by linear regression method is used. It has been noted by many researchers that this way may lead to large calculation errors.
In [17] a more sophisticated method was proposed, which allows us to find more accurately, namely by using relation Eq. (13) and special sequences and . The author considered escort distributions defined by Eq. (9). For these measures in view of assumptions Eq. (5) and Eq. (6) we have . These distributions form an ensemble of measure theoretic supports, and the support of consists of boxes having singularity exponent The main idea of the method is to calculate a spectrum of singularity exponents and fractal dimensions of obtained measure theoretic supports (information dimensions) as the functions of parameter Excluding we obtain . When dealing with such a sequence of measures the spectrum of singularity exponents seems to be a set of derivatives of with respect to , and the Legendre transformation holds. Hence, we may find the Rényi spectrum via parametrized spectra by using Eq. (4). Thus, in image analysis it may be sufficient to use only the spectra and . In [18] parametrized spectra were successfully applied to analyze images of biological preparations obtained by the method of crystallization with additives.
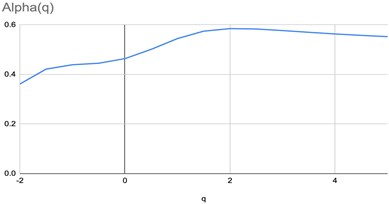
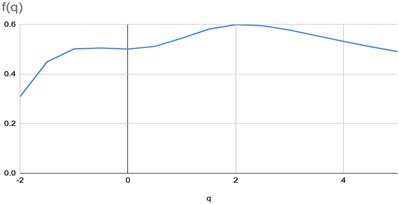
Consider a set in phase space and its partition on boxes of size . Let – a normed measure defined on Construct a sequence of measures by using direct multifractal transformation Eq. (9). Calculate averages of exponents over :
and the limit of when tends to zero:
For each measure calculate the information dimensions of its support:
Thus, we obtain two spectra: information dimensions of supports of the measures from a given sequence, and the set of averaged exponents calculated with respect to the measures as the functions of . To calculate ( respectively) one should for every take several values of , calculate points (or ) and by applying the least square method obtain approximate values for (
Now we can find the derivative of with respect to . We have:
Besides that:
This is the Legendre transformation and:
2.5. Rényi divergences
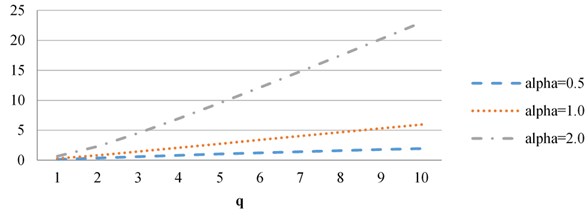
For given distributions and Rényi (or -) divergences for , are defined by the formula:
It is easy to check that is nonnegative and decreases as a function of . For this divergence is defined as:
and called the Kullback-Leibler divergence.
For image analysis we propose to calculate Rényi divergences on the sequence of escort distributions. As mentioned above, the supports of these measures are nonintersecting subsets of a given multifractal set. When comparing images we use a vector of divergences instead of one value. The main sign of the closeness of images is the rate of the growth of the vector: for images with similar texture the vector grows more slowly than for images from different cl asses.
2.6. The estimation of the rate of the growth for the divergence vector
For given distributions and introduce the notations and . Estimate the 1-divergencies between the members of corresponding sequences of measures and constructed for initial measures and :
Let:
Then:
Hence and:
For :
Assume that:
Then we have:
Denote by , .
Then:
The obtained estimations show that the rate of the growth of the vector of divergences depends on the power of multifractal transformation , parameter and a characteristic of the nonuniformity of the distributions and , which is estimated by , .
The complexity (both in time and from memory) of the implemented algorithm is , where – the number of pixels in an image.
3. Results and discussion
In image analysis we have to model a measure distributed on the image. As direct multifractal transformation reveals a nonuniformity of a given distribution, the initial measure should reflect real structure of the image accurately enough. Taking a box measure as the normed sum of pixel intensities may result in degeneration of graphs and into straight lines. Hence for better results one needs to use a kind of filtration, for example the convolution of the measure with Laplasian or Gaussian.
Below we show the results of calculation of parametrized spectra and Rényi divergences for images of pharmaceutical solutions with nanoparticles of silver and images of bone tissue – healthy and with osteoporosis.
3.1. Pharmaceutical solutions with silver nanoparticles
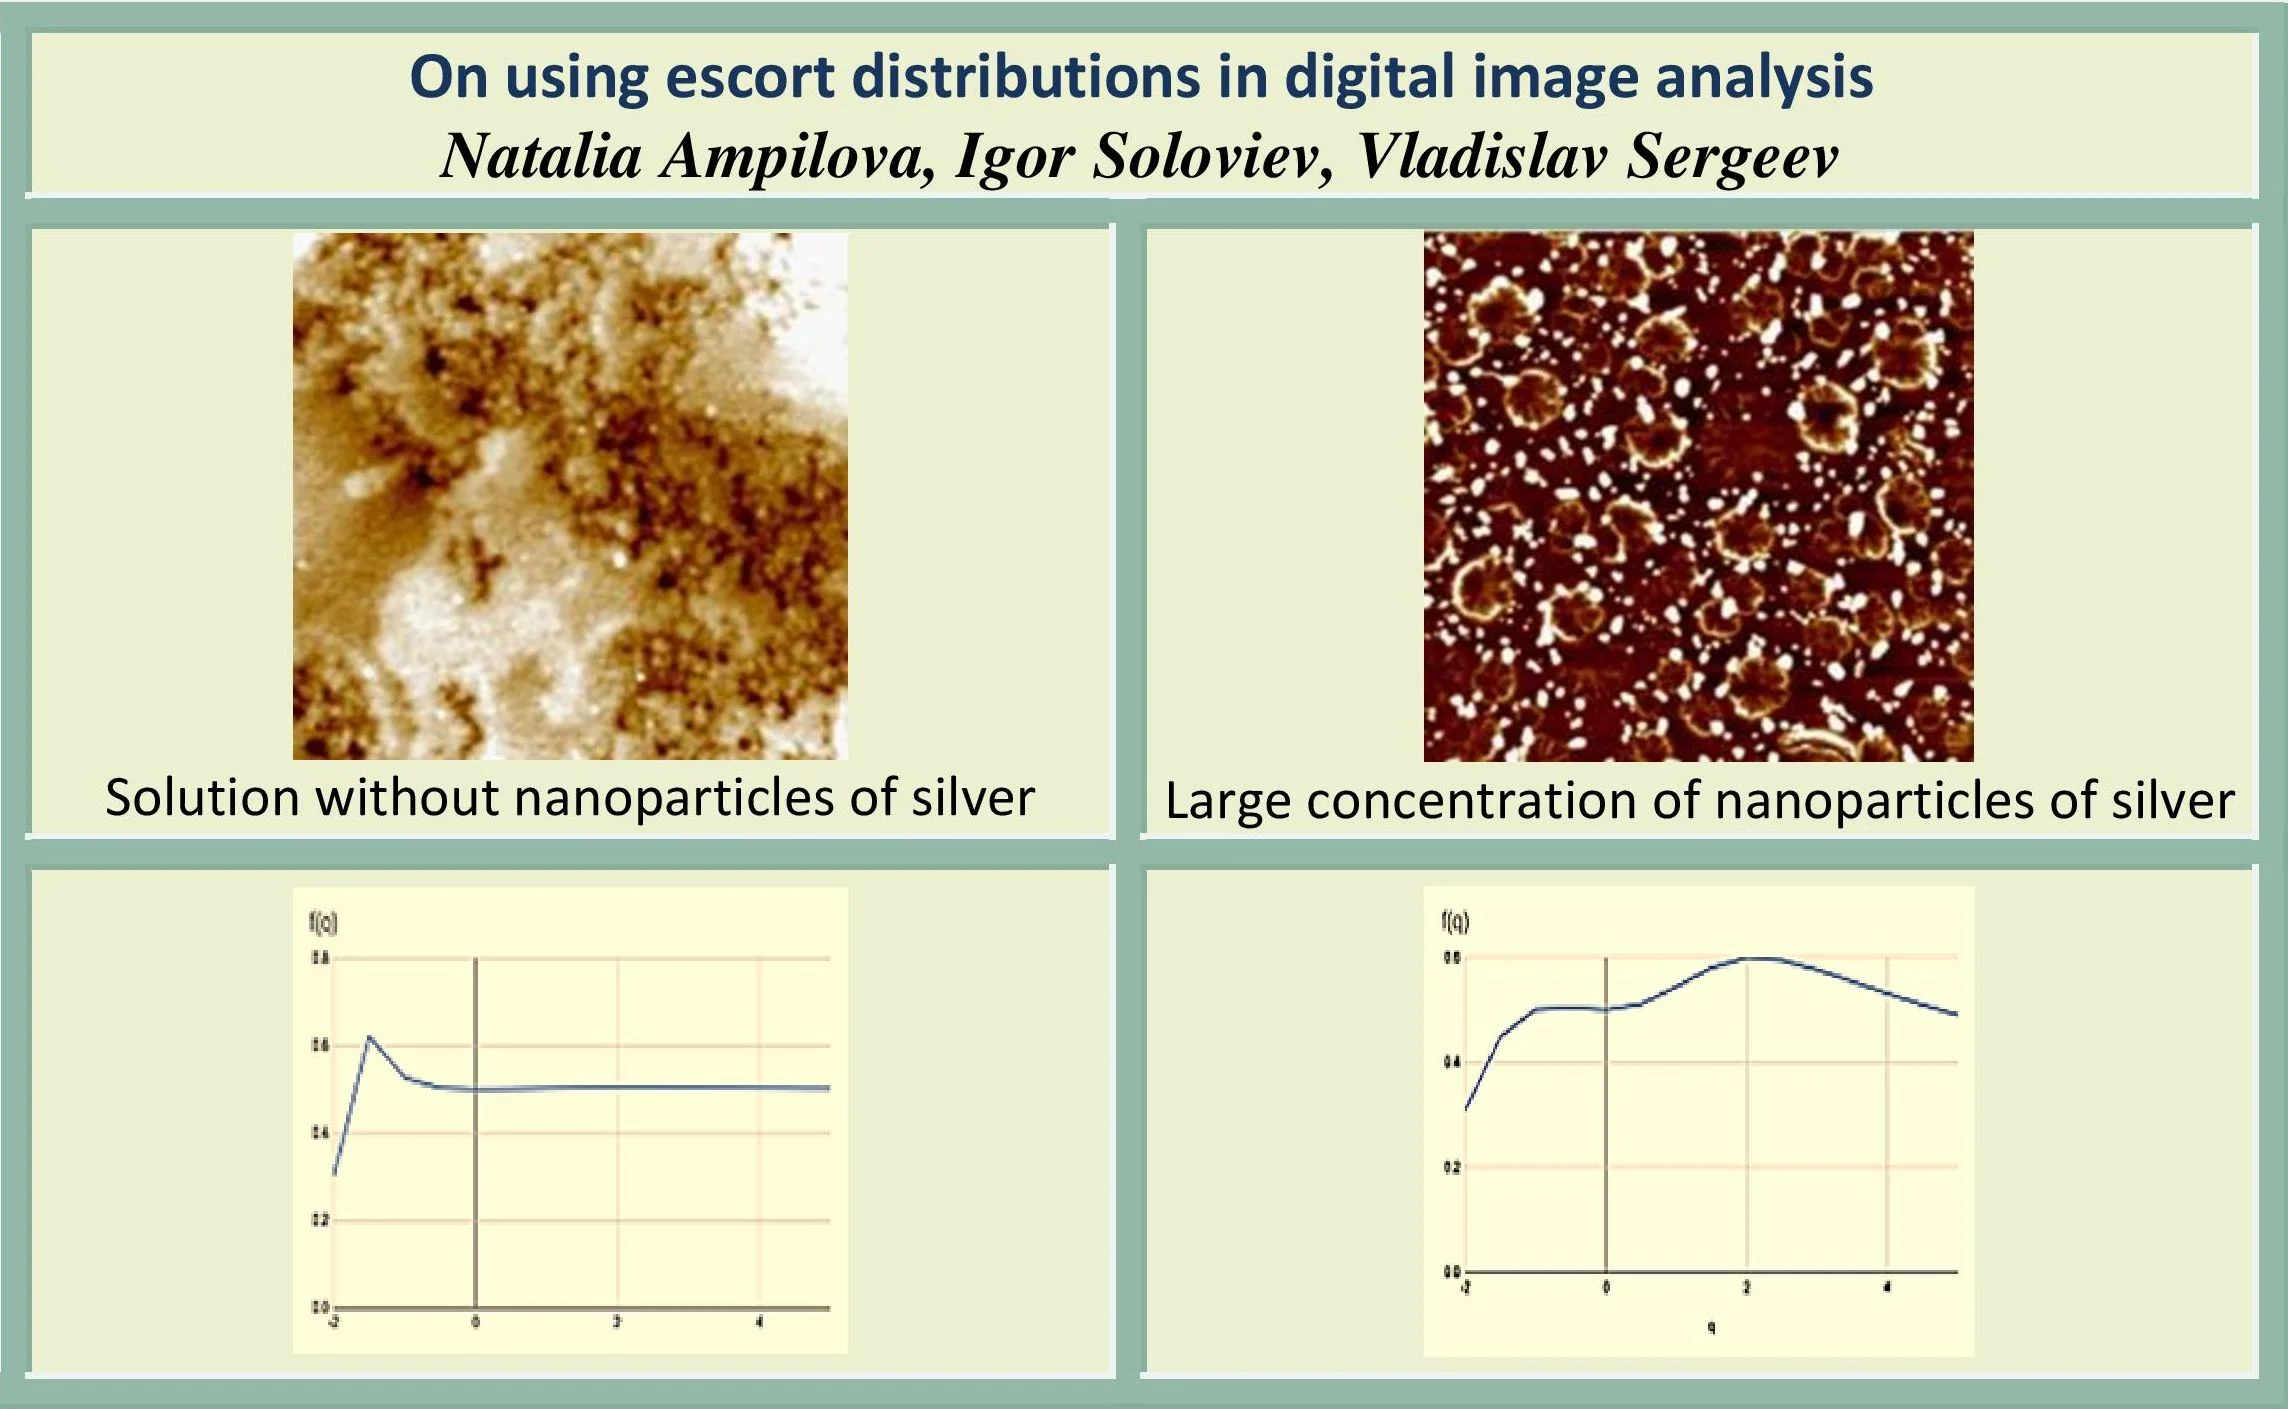
We consider images of pharmaceutical solutions in which silver nanoparticles in small and large concentrations were added. The solidified solutions without silver do not contain any organized structures. The structures appear when nanoparticles are added. All the images were obtained by using an atomic-force microscope on NTEGRA platform and have the size 658×636. The images are obtained in monochrome representation.
Fig. 1a) Solution without nanoparticles, b) small concentration of nanoparticles, c) large concentration of nanoparticles
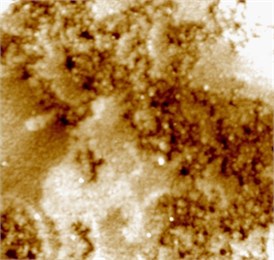
a)
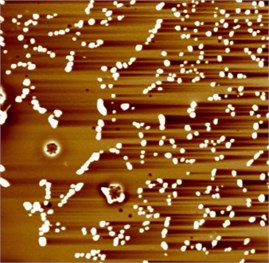
b)
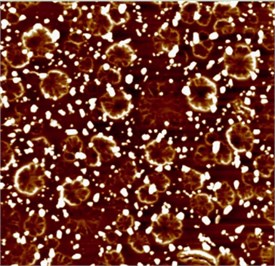
c)
Fig. 2The graphs of parametrized spectra for the image of pharmaceutical solution without silver nanoparticles
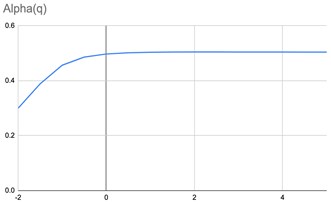
All the calculations were performed in greyscale palette, the measure of the box was taken as the normed sum of pixel intensities. The graphs of parametrized spectra for images Fig. 1(a)-(c) are shown below. The parameter changes in the interval [–2, 5] with step 0.5.
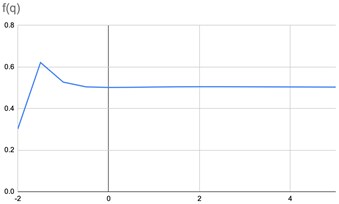
Fig. 3The graphs of parametrized spectra for the image of pharmaceutical solution with small concentration of silver nanoparticles
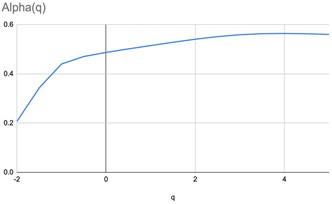
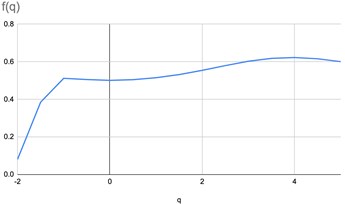
Fig. 4The graphs of parametrized spectra for the image of pharmaceutical solution with large concentration of silver nanoparticles
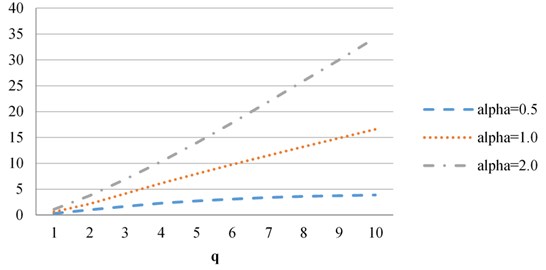
The results of calculations of the divergence vectors for 0.5, 1, 2 are given below. In Fig. 5 the result of comparison of Fig. 1(a) and Fig. 1(b) (zero-small) is shown. Fig. 6 demonstrates the difference in structures between Fig. 1(a) and Fig. 1(c) (zero-large).
Fig. 5Vectors of divergences obtained when comparing images Fig. 1(a) and Fig. 1(b) (zero-small)
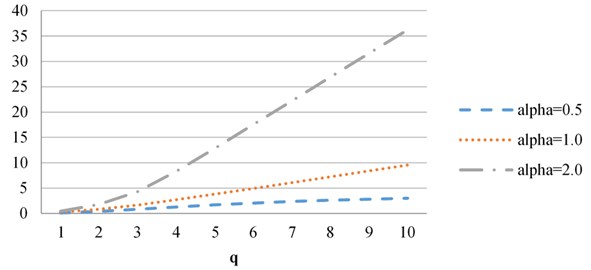
We see that the difference between images with zero and small concentration is smaller than between zero and large. Graphs of divergence vectors lend credence to the estimations on the rate of the growth of the vectors depending on and .
Fig. 6Vectors of divergences obtained when comparing images (a) and (c) (zero-large)
3.2. Images of bone tissue
Consider the images of healthy tissue Fig. 7(a) and bone tissue with osteoporosis Fig. 7(b). The size is 412×400. Calculations were also performed in greyscale palette; the measure of the box is the normed sum of pixel intensities. The parameter changes in the interval [–5, 5] with step 0.5.
Fig. 7a) Healthy bone, b) osteoporosis
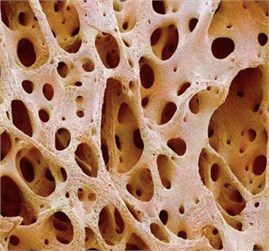
a)
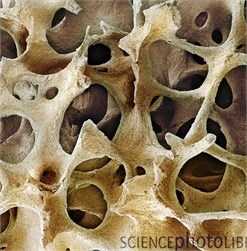
b)
Fig. 8Graphs of parametrized spectra for the image of healthy bone (а)
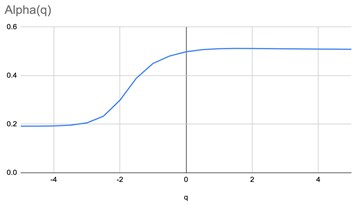
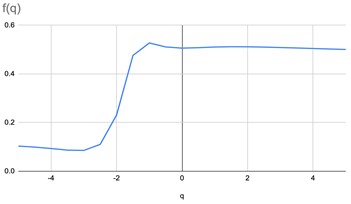
Fig. 9Graphs of parametrized spectra for the image of bone with osteoporosis (b)
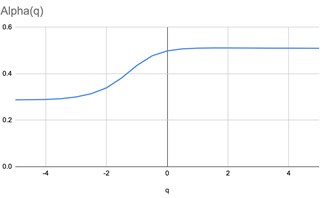
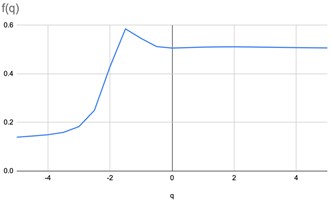
Fig. 10Vectors of Rényi divergences when comparing healthy bone and bone with osteoporosis
In this case vectors of divergences grow more slowly than in the previous example. This reflects a visual similarity of images in spite of the fact that they are in different classes. But a combination of the two methods makes it possible to distinguish between images.
4. Conclusions
Methods of fractal and multifractal analysis provide a way to find subtle differences between structures of complex high-resolution images. In the paper we consider two methods based on the approach of multifractal formalism and using escort distributions – a one-parametric set of normed distributions obtained from an initial measure through the use of the function of moments. The order of a moment acts as the parameter.
We set and substantiate the importance of the applications of parametrized spectra as a mathematical tool both for description of multifractal structure and reliable calculation of singularity spectrum.
We also propose a method for comparing digital images on the sequences generated escort distributions. This method results in obtaining a vector of Rényi divergences, and the rate of its growth indicates a closeness of images. The theoretical estimation of the rate is given, which is confirmed by the results of experiments.
The implemented methods of multifractal analysis give a possibility to calculate any part of singularity spectrum by changing the parameter in a given interval with a small step. The results of experiments show that these methods allow finding differences in image structures even for a simple way of the modeling of the initial measure.
References
-
Chen Weiyang, Li Weiwei, Dong Xiangjun, Pei Jialun A review of biological image analysis. Current Bioinformatics, Vol. 12, Issue 4, 2018, p. 337-343.
-
Mang Andreas, Bakas Spyridon, Subramanian Shashank, Davatzikos Christos, Biros George Integrated biophysical modeling and image analysis: application to neuro-oncology. Annual Review of Biomedical Engineering, Vol. 22, 2020, p. 309-341.
-
Sabanci K., Kayabasi A., Toktas A. Computer vision-based method for classification of wheat grains using artificial neural network. Journal of the Science of Food and Agriculture, Vol. 97, Issue 8, 2017, p. 2588-2593.
-
Kahl J., Busscher N., Mergardt G., Andersen J. Standardization and performance test of crystallization with additives applied to wheat samples. Food Analytical Methods, Vol. 8, Issue 10, 2015, p. 2533-2540.
-
Aydin Shishegaran, Arash Nazem Boushehri, Ahmad Fauzi Ismail Gene expression programming for process parameter optimization during ultrafiltration of surfactant wastewater using hydrophilic polyethersulfone membrane. Journal of Environmental Management, Vol. 264, 2020, p. 110444.
-
Aydin Shishegaran, Farshad Daneshpajoh, Hamed Taghavizade, Sajjad Mirvalad Developing conductive concrete containing wire rope and steel powder wastes for route deicing. Construction and Building Materials, Vol. 232, 2020, p. 117184.
-
Jizba P., Arimitsu T. The world according to Renyi: thermodynamics of multifractal systems. Annals of Physics, Vol. 312, 2004, p. 17-57.
-
Bashkirov A. G. The Rényi entropy as statistical entropy for complex systems. Theoretical and Mathematical Physics, Vol. 149, Issue 2, 2006, p. 299-317, (in Russian).
-
Falconer K. Fractal Geometry. Mathematical Foundations and Applications. John Wiley and Sons Ltd, 2003.
-
Vstovsky G. Elements of Information Physics. Moscow, MGIU, 2002.
-
Rogov A. A., Spiridonov K. N. On application of the Rényi spectrum as an invariant of digital image. Vestnik SPbGU, Vol. 2, Issue 10, 2008, p. 30-43, (in Russian).
-
Ampilova N., Sergeev V., Soloviev I. Digital image analysis based on direct multifractal transform. Humanities and Science University Journal, Vol. 19, 2016, p. 23-32.
-
Ampilova N., Sergeev V., Soloviev I. The application of Renyi divergences to image analysis and classification. Izvestia Herzen University Journal of Humanities and Sciences, Vol. 176, 2015, p. 35-44, (in Russian).
-
Ampilova N., Soloviev I. On application of entropy characteristics to texture analysis. WSEAS Transactions on Biology and Biomedicine, Vol. 11, 2014, p. 194-202.
-
Bogokin S., Parshin D. Fractals and Multifractals. Moscow, 2001, (in Russian).
-
Kuznetsov S. Dynamical Chaos. Moscow, 2001, (in Russian).
-
Chabra A., Meneveau C., Jensen R., Sreenivasan K. Direct determination of the f(α) singularities spectrum and its application to fully developed turbulence. Physical Review A, Vol. 40, Issue 9, 1989, p. 5284-5294.
-
Ampilova N., SolovievI., Barth J.-G. Application of fractal analysis methods to images obtained by crystallization modified by an additive. Journal of Measurements in Engineering, Vol. 7, Issue 2, 2019, p. 48-57.
About this article

