Abstract
According to the nonlinearity and nonstationarity characteristics of reciprocating compressor vibration signal, a fault feature extraction method of reciprocating compressor based on the empirical wavelet transform (EWT) and state-adaptive morphological filtering (SMF) is proposed. Firstly, an adaptive empirical wavelet transform was used to divide the Fourier spectrum by constructing a scale-space curve, and an appropriate orthogonal wavelet filter bank was constructed to extract the AM-FM component with a tightly-supported Fourier spectrum. Then according to the impact characteristic of the reciprocating compressor vibration signal, the morphological structural elements were constructed with the characteristics of the signal to perform state-adaptive morphological filtering on the partitioned modal functions. Finally, the MF-DFA method of the modal function was quantitatively analyzed and the fault identification was performed. By analyzing the experimental data, it can be shown that the method can effectively identify the fault type of reciprocating compressor valve.

Highlights
- An integrated fault feature extraction method of reciprocating compressor valve based on the EWT-SMF and MF-DFA is proposed.
- The state morphological filtering method based on EWT is presented to filter signals in different states and achieve more fault features according to the vibration signal characteristics.
- The MF-DFA analysis was performed on the processed signal by EWT-SMF, the multi-fractal spectrum parameters was calculated to entirely describe and characterize the wave form in detail.
- Compared with other feature extraction methods, the effectiveness of this method is verified by the recognition results of BTSVM and CNN.
1. Introduction
Due to the nonlinearity, nonstationarity and multi-component coupling characteristics of reciprocating compressor valve vibration signals, using the traditional linear theory of signal analysis methods to fault diagnosis has more limitation and more difficult to effectively extract fault features. At present, the common method used to deal with the nonstationarity and nonlinearity signals is Empirical Mode Decomposition (EMD). It is an adaptive method, which decomposes the signal into a series of basic mode components changing from high frequency to low frequency according to the characteristics of the signal itself. It can accurately highlight the local characteristics of the signal and has good time-frequency focusing [1-4]. EMD also has some shortcomings such as over envelope, under envelope and large amount of computation. In view of the insufficiency of EMD, Gilles proposed an adaptive wavelet analysis method based on wavelet framework - Empirical Wavelet Transform (EWT) [5, 6]. This method is based on the framework of wavelet transform. By dividing the Fourier transform spectrum, an appropriate orthogonal wavelet filter bank is constructed to extract the AM-FM component with a tightly-supported Fourier spectrum, and finally, the fault diagnosis is made by extracting the features of AM-FM components, which is based on the frame of wavelet transform. It has strict mathematical proof, and the calculation process is not iterative, and the computation is small.
During the operation of reciprocating compressor, there are a large number of impact and pulse signals. The pulse signal contains the most abundant frequency components. The normal pulse signal and the fault pulse signal have obvious time-domain characteristics. Due to the influence of noise and mechanical system modulation, these fault phenomena of time-domain waveforms are often concealed. Morphological filtering can deal with the characteristics of the signal including eliminating positive and negative shocks, reducing noise and so on, and the processing is carried out completely in the time domain. It has the advantages of faster calculation speed, simpler algorithm and easier hardware implementation than the traditional filtering method [7]. Therefore, the morphological filtering processing signal is proposed in this paper. But at present commonly used morphological filtering method is only to choose a kind of structure elements to filter, and cannot simultaneously adapt to both the impact and non-impact waveforms of reciprocating compressor, resulting in the loss of some useful information during the filtering, and thus affecting the results of fault diagnosis. To solve the above problems, a state-adaptive morphological filtering (SMF) method is proposed in this paper. According to the characteristics of vibration signal of reciprocating compressor, adaptive structural elements are constructed for filtering, and the fault features can be highlighted when filtering.
Because the vibration signals of reciprocating compressor have obvious similar fractal characteristics, the multi-fractal method can well describe the structural characteristics and local dynamic behaviors of the signal [8, 9]. However, the traditional multi-fractal method is susceptible to the non-stationary trend of time series and cannot accurately reveal its multi-fractal characteristics. we found that the multi-fractal detrended fluctuation analysis (MF-DFA) method proposed by Kantelhardt et al. [10], compares with the traditional multifractal method, it cannot only reflect the fractal characteristics of nonlinear signals as a whole, but also accurately describe the local dynamic characteristics of vibration signals [11-13]. And it can reveal the multifractal features hidden in non-stationary time series and accurately estimate the multifractal spectrum by eliminating sequence trend terms by DFA [14]. At present, the MF-DFA method has been widely used in engineering fields such as gearbox fault diagnosis and rolling bearing fault diagnosis [15-18]. However, the local fluctuation of the vibration signal of the reciprocating compressor is strong and mostly a local tendency in the form of non-polynomial, so it is difficult to accurately fit the trend term of the vibration signal by polynomial fitting. Therefore, the MF-DFA method should be combined with the EWT-SMF that can decompose the local features of different time scales including the original signal, and the extracted multi-fractal features of the signal have a clearer physical meaning. We propose a feature extraction method combining the advantage of EWT-SMF and MF-DFA in this paper. The structure of this paper is as follows: the principle of EWT-SMF and MF-DFA is introduced in Section 2. The scheme of the method is briefly described in Section 3. In Section 4, the performance of extracting features is evaluated by an experiment with the fault type of reciprocating compressor valve and the conclusion of the proposed method is summarized in Section 5.
2. EWT-SMF and MF-DFA principles
2.1. EWT-SMF algorithm
EWT is actually an adaptive wavelet analysis method, which is established under the theory of wavelet transform. The EWT method modified the fixed wavelet spectrum separation method to the adaptive spectral separation based on different characteristics of the signal, and then decomposed by the orthogonal wavelet filter to obtain AM-FM components and use Hilbert spectrum for fault diagnosis.
2.1.1. EWT
EWT is mainly divided into three steps:
Step 1. Perform a Fourier transform on the signal to get a spectrum diagram, and divide the spectrum by a specific algorithm to obtain a set of boundaries of the spectrum.
Reasonable spectral separation is the key to EWT. Gilles first proposed a spectral separation method based on the local maxima of the spectrum [5], but this method uses too few spectral information, and it is prone to modal aliasing when the wide modal and narrow modal neighbors or two large maxima on the spectrum belong to the same modality, etc. Then Gilles proposed a spectral space-based spectral separation method. The Gaussian kernel is used to scale the signal to obtain different scale spaces as shown in Eq. (1). The minimum value curve is obtained for the signal in the scale space, and then the position where the minimum value curve is larger than the threshold value is found, thereby determining the separation boundary. This method uses more information about the signal, so the resulting separation is better [19, 20]:
where:
The scale-space method finds local minimum curves in the scale space by searching different local minima described at multiple scales of the spectrum to achieve adaptive spectral separation:
From the spectrum diagram shown in Fig. 1(a), finding the boundaries in the spectrogram and dividing out the modality are similar to the fault diagnosis of rotating machinery that divides the spectrum by frequency doubling, and is to find the recesses in the spectrum, that is, the location of the local minimum. When we perform the scale-space transformation, the position and number of local minima will change. Let be the horizontal axis representing the position of the point; represents the number of scale transformations as the vertical axis, and the scaled space plane is constructed.
Fig. 1Example of modes in an spectrogram and its corresponding scale space representation
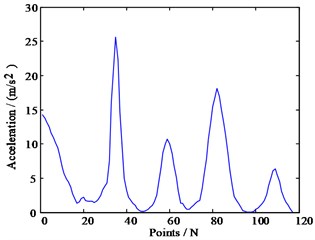
a) Simulation spectrogram
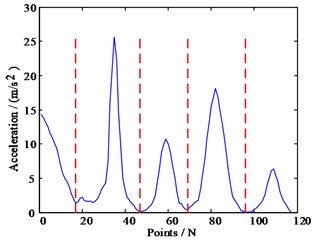
b) Spectrum support boundary
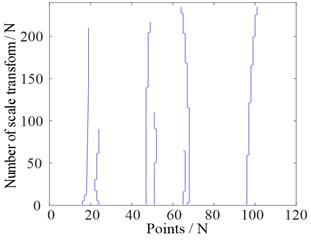
c) Scale-space curve
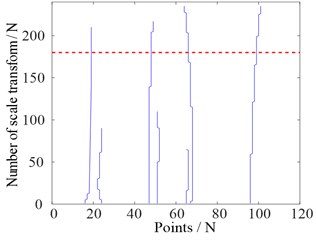
d) Screened scale-space curves based on threshold
After the transformation, the number of local minima described differently is a decreasing function with respect to the scale parameter , and no new local minima will be generated as increases. For each scale transformation, the position of the new local minimum value obtained after the scale transformation is superimposed on the scale space plane. Therefore, the number of initial local minima can be written as , and the position of each initial local minima will generate a scale-space curve . The length of this curve depends on the number of occurrences of the th local minimum in the entire scale space. Fig. 1(c) is an image of the scale space plane after scale transformation. Each initial local minimum value generates a curve in the scale space. However, not all local minima curves will remain. By using a classification algorithm and finding a suitable threshold, the minimum value curve is divided into two categories, so that a suitable scale-space curve is selected, and the position of the scale-space curve is finally defined as the separation boundaries of the spectrum as shown in Fig. 1(b) and Fig. 1(d).
Step 2. Based on the obtained boundary, use the empirical scale function and empirical wavelet function constructed by Meyer wavelet to obtain the orthogonal wavelet filter, and then EWT is performed on the spectrum to obtain a set of single-component or nearly-one-component AM-FM components.
The empirical scale function and empirical wavelet function of Meyer wavelet are as follows:
where , , .
Then, as the wavelet analysis method, the inner product method is used to determine the detail coefficient and the approximate coefficient, respectively:
The empirical mode function can be expressed as:
Step 3. Analyze the AM-FM components using Hilbert transform to obtain the Hilbert spectrum.
After Gilles proposed EWT, Cao mentioned in [21] how empirical wavelet decomposition effectively separates the spectrum. In order to avoid erroneous segmentation caused by serious noise-induced internal modalities, Jinglong proposed that the signal can be denoised by wavelet-neighborhood coefficients to improve the SNR before EWT [22]. Mourad Kedadouche proposed an empirical wavelet transform method based on modal analysis (OMA) in the literature [23]. This paper uses the autoregressive moving average model to calculate the natural frequency and then spectrally separates them according to the natural frequency.
2.1.2. EWT modal optimization
Due to the complex frequency spectrum components of the reciprocating compressor vibration signal, including a wide frequency range and frequency susceptibility to mutation, the AM-FM components obtained through the EWT cannot be regarded as a single component modality. So, there is not enough theoretical support for the Hilbert transform.
The EWT separates the spectrum based on the mathematical properties of the signal spectrum and does not incorporate physical meaning. Therefore, the selection of physical meaning energy is the first standard of the optimum mode. The modality obtained by EWT is sorted by the energy from the largest to the smallest, and the first two modalities are selected for the next step. For reciprocating compressor, the impact signal contains the most abundant fault information. Therefore, it is expected that the mode in which the impact signal is less stable can be selected from the above two optimum modalities. According to the physical characteristics of reciprocating compressor, reciprocating compressor vibration signals can be determined the location of the main impact, coupled with the impact signal amplitude, it can be compared whether the two modes contain more fault information. Taking the reciprocating compressor valve as an example, the position of the generated impact signal is determined by the pressure test signal and the key phase signal when the suction valve is opened. The amplitude of the impact signal position should be at least 50 % of the original signal impact position amplitude.
Because of the impact of reciprocating compressor during operation, the spectrum components in both the normal operation state and the fault state are very complicated, and it is difficult to use the same standard to process normal and fault signals. Therefore, in this paper, a comparative method is used to process the vibration signal of reciprocating compressor in the normal state by EWT to obtain the optimal modal state. And then the spectrum separating boundary of this mode is used for fault diagnosis of other state signals.
2.1.3. State-adaptive morphological filtering
For meaningful modalities obtained by EWT, the resulting modalities need to be filtered in order to reduce the effects of the random noise and other vibrations on the vibration signal of the diagnosis site and highlight the fault features.
Morphological filtering is mainly divided into two parts in one-dimensional signal processing. The first part is the selection of structural elements. The structural elements in the morphological operation are similar to the filtering window in general signal processing, and only the signal elements that match the size and shape of the structural elements be effectively preserved. The three elements of a structural element are shape, length, and height. Commonly used structural elements are flat, triangular and semi-circular. It is generally believed that the flat structure is conducive to maintaining the shape characteristics of the signal being processed, the semi-circular structure is suitable for filtering out the interference of random noise, and the triangular structure is suitable for filtering the interference of the impulse noise. Most commonly used morphological filters use structural elements of a single structural characteristic. This method has a good effect on smooth signals [24], but the reciprocating compressor vibration signals are the nonstationary and nonlinear signals, and the impact and non-impact waveform of the signal are very different. If only a single structural element is used for filtering, both the impact and non-impact waveform cannot be accommodated at the same time, resulting in filtering out some useful information and thus affecting the effect of fault diagnosis. So, this paper uses morphological filtering to process the signal and proposes a new state-adaptive morphological filtering method. In accordance with the characteristics of the reciprocating compressor vibration signal, morphological filtering of signals is performed using different structural elements for different states.
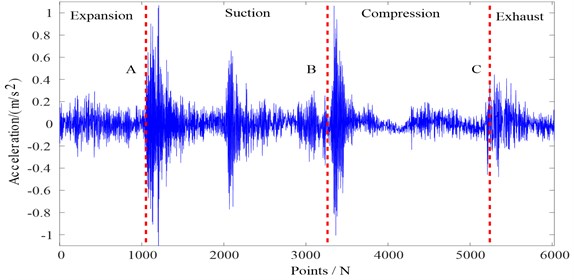
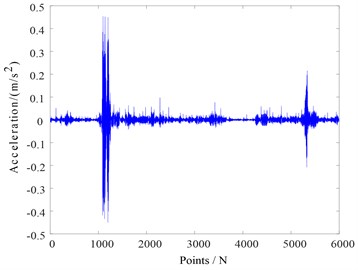
The following Fig. 2 describes the valve vibration signal of reciprocating compressor as an example.
One cycle signal of reciprocating compressor can be divided into four stages of expansion, suction, compression and exhaust in Fig. 2. During the expansion process, the suction valve is closed and the signal amplitude is small. In the suction phase, the suction valve opens at the point A and hits the lift limiter. At this point, the first large peak of impact waveform is formed. During the suction process, the suction valve plate is theoretically at rest, and the impact waveform that appears in the middle of the suction stage caused by the opening of the other exhaust valve (the double acting cylinder). When the suction process is completed, the suction valve begins to close at point B and hits the valve seat, forming a second impact waveform that begins with the closing of the suction valve. The impact waveform near point C is caused by the opening of the exhaust valve on the side of the cylinder. In summary, the information of the valve operation state mainly includes the impact waveform caused by the valve during the opening and closing of the valve. When the valve plate is in a static state, theoretically no vibration signal generated by the valve plate. The vibration signal at this stage is mainly composed of the cylinder pressure pulsation, the fluctuation of the air flow in the cylinder caused by the opening and closing of the valve, the vibration caused by the inertial force, and the vibration of other parts [25], so the vibration signal at this stage cannot effectively reflect the operation state of the valve. From the above analysis, it can be concluded that the ideal filtering effect is to maintain the impact vibration waveform caused by the opening and closing of the gas valve, reduce the impact of other vibrations such as cylinder pressure pulsation, air flow fluctuations in the stable stage of the valve, and suppress impact noise and random noise. The most intuitive method is to distinguish the amplitude of the vibration signal. Because it takes a certain duration before the valve plate is opened and closed until it is in close contact with the lift limiter or valve seat, it is necessary to segment the vibration signal, and then determine the state of each segment based on the vibration amplitude; after confirming the status , select the type of structural element and height of structural element corresponding to each state in accordance with the established criteria.
Fig. 2Acceleration vibration signal of reciprocating compressor valve
The second part of morphological filtering is the morphological operations including four basic operators: morphological erosion, morphological expansion, morphology opening, and morphology closure. Let the original signal be a discrete function defined on , the structural element is a discrete function defined on , and , then [26].
The erosion of is defined as:
The expansion of is defined as:
The open operation of is defined as:
The closed operation of is defined as:
where , , ○, ● are operators for erosion, expansion, opening, and closing operations, respectively.
Four basic operations in morphology can be used to extract different signal feature information. But if only a single morphological operator is used, only information of a particular shape in the signal can be extracted. Therefore, a combination of basic operators is needed to more comprehensively extract the information from the signal. The commonly combinations of morphological operators filters. include the mean filter of corrosion and expansion in Eq. (12), the mean filter of open and closed operation in Eq. (13), the mean filter of open and closed-closed operation in Eq. (14), and the differential filter of erosion and expansion in Eq. (15):
Through repeated data comparison, this paper selects the mean filter of open and closed operation to filter and obtain the final filtering result.
2.2. MF-DFA
2.2.1. Method description
The main calculation steps of MF-DFA for non-stationary time series is as follows:
1) Determine of signal outlines and segments:
Divide from positive and negative directions into non-overlapping segments of equal length .
2) The local trend of each interval is calculated by least square fitting:
where is the trend of the polynomial data of the segment.
3) Define the order fluctuation function of the sequence:
4) The bilogarithmic function of and is analyzed to determine the scaling property of fluctuation function, as increases, increases in power law relationships:
where the range of the generalized Hurst exponent is and the long-range correlation of the sequence can be judged by .
5) Plug into Eq. (20):
6) Suppose that :
7) The scaling exponent is defined by the partition function :
8) The relationship between and the scaling exponent , the singular exponent and multi-fractal spectrum :as follows:
2.2.2. MF-DFA parameters
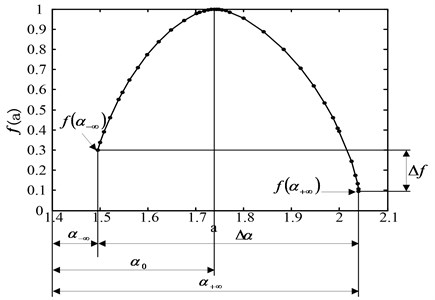
By observing the multi-fractal singular spectrum obtained by the MF-DFA method, it can be seen that the following important parameters can quantitatively express the probability distribution ratio and unevenness degree of fractal structure shown in Fig. 3: the spectral width describes the unevenness of probability measure distribution in the whole fractal structure. The peak value of the multi-fractal spectrum describes the rate at which the number of identical probability units changes with the observation scale. The singular value corresponds to the peak value of multifractal spectrum. The difference in the fractal dimension of maximum and minimum probability subset, describes the difference between the number of elements in the maximum and minimum probability subsets [17].
Fig. 3Typical multi-fractal singular spectrum
3. Feature extraction method based on EWT-SMF and MF-DFA
The scheme of the method is briefly described as follows:
(1) According to the characteristics of the signal itself, the optimal scale transformation parameters are determined through comparison of experimental data, and the Fourier spectrum of the signal is divided by the selected parameters to obtain some empirical modal components. Taking the amount of energy contained in a modal component as the optimal criterion, filter the empirical modal components of EWT, and retain the experience modal components that contain the most fault information.
(2) Confirm the length of the impact waveform caused by the opening and closing of the valve, take the half length of the impact waveform as the length of the segment, and divide the entire signal into several segments.
(3) In order to judge the state of each segment and solve the problem that the amplitude of the valve vibration signal is too large to accurately determine the height of structural elements. Calculate the average absolute value of the amplitude of each segment signal as the height of the structural elements of the segment, so that the heights of the structural elements of each segment are not affected by each other.
(4) From the point of view of the signal, determine the minimum value of the valve opening and closing vibration amplitude. If the previous segment is , the valve is assumed to be in a stable state at this time, select the triangular structural element type to suppress the impulse noise and random noise. If the previous segment is , it is believed that the valve is in the process of opening or closing, select the flat structural element type to maintain the vibration of the impact waveform.
(5) Determine the type and height of the structural elements of each segment based on the decision criteria in step (3) and step (4), and then use an mean filter of open and closed operation for morphological filtering.
(6) The MF-DFA analysis is performed on the processed signal by EWT-SMF, the multi-fractal spectrum of each processed signal is calculated, then (, , , ) is constructed as the fault state eigenvector to identify faults.
4. Experiments
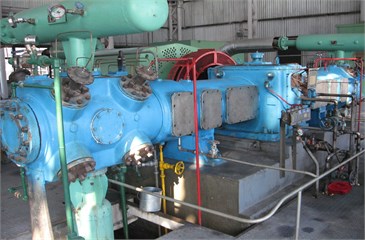
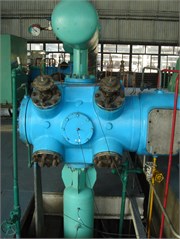
In order to verify the validity of the proposed EWT-SMF and MF-DFA method for reciprocating compressor valve vibration signal, we selected the data from the valve database of a two-stage double-acting reciprocating compressor of type 2D12 to extract the fault feature shown in Fig. 4. the motion parameters of reciprocating compressor are as follows: the shaft power is 500 kW, and the motor speed is 496 rpm. Because the reciprocating compressor valve is under the effect of the periodic load, it is more vulnerable to valve failures. In this paper, we mainly investigates three common failure modes of the valve: valve plate gap, valve plate fracture and spring failure. And the valve cover side signal is extracted as the analysis data.
Fig. 4Two-stage double-acting reciprocating compressor of 2D12 type
a)
b)
In the following, the original signal of the normal reciprocating compressor valve state is shown in Fig. 5(a). We used the adaptive spectrum separation by the scale space to process the signals, the resulting separation boundaries are shown in Fig. 5(b). The separation results in six modes, including the two modes with the highest energies as shown in Fig. 6. Through the pressure test signal and the key phase signal, it is determined that the position of the suction valve opening is between the 1000th point and the 1200th point, and the impact amplitude of this segment should be at least greater than 0.5, thereby the two modes with high energy were optimized, and the Mode 2 was finally retained for subsequent analysis.
Fig. 5Separation boundaries of the normal reciprocating compressor valve state
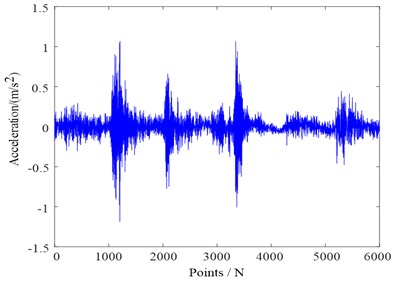
a) Original signal
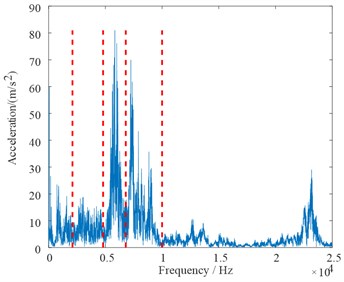
b) Spectrum support boundary
Fig. 6Separation results with the highest energies
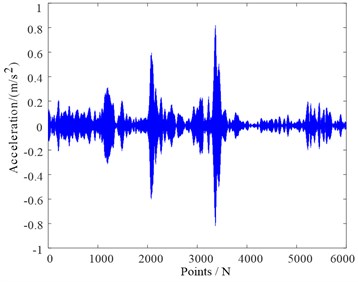
a) Selected mode 1
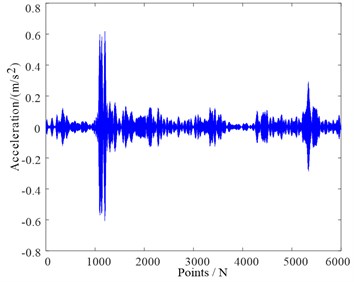
b) Selected mode 2
The morphological filter with adaptive structural elements was used to further process the Mode 2. Firstly, the vibration signal of the measured valve was analyzed, and the impact waveform length of each opening and closing of the valve is about 120 points, half of which is 60 points taken as one segment and the total is divided into 101 segments. Then the height of each structural element of each section was calculated, and the minimum value of the opening and closing vibration amplitude of the valve is equal to 0.1122. When the structural element height is , the valve is assumed to be in a stable state, select the upper triangular structural element type. When the structural element height is , it is believed that the valve is in the process of opening or closing, select the flat structural element type to maintain the vibration of the impact waveform. Then we applied an mean filter of open and closed operation for morphological filtering to obtain the Mode 2 shown in Fig. 7. Finally, the MF-DFA analysis was performed on the filtered Mode 2, and the four-differential spectral parameters were obtained as the eigenvectors of the modality.
Fig. 7Filtered mode 2
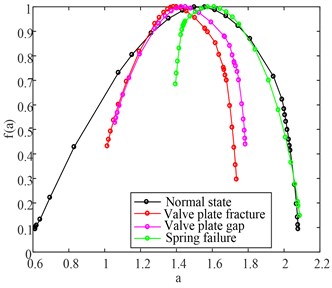
In this paper, we employed the above proposed method to extract eigenvector, we should set the scaling exponent in MF-DFA to calculate the multi-fractal singular spectrum of four valve faults in Figs. 8 respectively, and the corresponding four-dimensional eigenvector listed in Table 1, and the difference between the four valve states can be clearly seen in both Fig. 8 and Table 1.
Table 1Multi-fractal parameters of different valve states
Valve states | Multi-fractal parameters | |||
Normal state | 1.5573 | 0.9986 | –0.0009 | 1.4658 |
Valve plate fracture | 1.3833 | 0.9996 | –0.1357 | 0.7207 |
Valve plate gap | 1.4265 | 0.9994 | –0.0885 | 0.7268 |
Spring failure | 1.6094 | 0.9991 | –0.5359 | 0.6928 |
The fault eigenvectors set of the four valve states was constructed by the above proposed method. Then the Binary Tree Support Vector Machine (BTSVM) and Convolutional Neural Network (CNN) methods were introduced to further evaluate the effectiveness of the proposed method in this paper [27-32]. We selected 100 eigenvector samples from the eigenvectors set of each valve state, of which 60 were training data and 40 were test data by BTSVM and CNN respectively shown in Table 2. For the BTSVM, we employed the radial basis kernel function, and used the genetic algorithm to optimize the kernel parameter 4.57 and error penalty parameter 0.85. For the CNN, based on the experiental data, the subsampling layer and convolution layer were as 2×1, the number of onvolution kernel size and neurons in the full connection layer were as 8. and the weights and deviations of the model network are between [0, 1]. Simultaneously, to verify the superiority of this method, the same data above were extracted and identified by other four methods including EWT and MF-DFA, EEMD and MF-DFA, EMD and MF-DFA, and MF-DFA listed in Table 2.
Table 2Recognition accuracy of comparison between different methods
Feature extraction method | Recognition accuracy (%) of valve states | Total accuracy (%) | ||||||||
Normal | Spring failure | Valve plate fracture | Valve plate gap | |||||||
BT SVM | CNN | BT SVM | CNN | BT SVM | CNN | BT SVM | CNN | BT SVM | CNN | |
EWT-SMF and MF-DFA | 100 | 100 | 97.5 | 97.5 | 97.5 | 97.5 | 97.5 | 100 | 98.13 | 98.75 |
EWT and MF-DFA | 95 | 97.5 | 92.5 | 95 | 95 | 97.5 | 92.5 | 92.5 | 93.75 | 95.63 |
EEMD and MF-DFA | 95 | 92.5 | 92.5 | 92.5 | 92.5 | 95 | 92.5 | 90 | 90.63 | 93.13 |
EMD and MF-DFA | 92.5 | 92.5 | 90 | 92.5 | 90 | 92.5 | 90 | 90 | 90.63 | 91.88 |
MFDFA | 87.5 | 90 | 85 | 87.5 | 87.5 | 90 | 85 | 87.5 | 86.25 | 88.75 |
The following results are obvious from Table 2: First, both the precision of each state and the overall precision of the proposed method have advantages over the other four methods under the same conditions. Second, the feature extraction methods including adaptive decomposition, such as the feature vector extracted by the EWT-SMF and MF-DFA, the EWT and MF-DFA, the EEMD and MF-DFA and the EMD and MF-DFA whose recognition results are significantly superior to those by the MF-DFA, therefore, in order to more effectively resist noise interference and prominent information extraction, it is necessary to perform the self-decomposition method before the MF-DFA analysis. At last, the result of recognition rate obtained by the method combined with EWT-SMF outperforms EWT, EEMD and EMD. Through the above comparison, the proposed method is the superior feature extraction method to diagnosis faults of reciprocating compressor valve effectively and accurately.
Fig. 8Multi-fractal singular spectrum of the four valve fault states
Ying Li was responsible for paper writing and algorithm programming. Jindong Wang was responsible for presenting the overall framework. Haiyang Zhao was responsible for experimental vibration test. Longyu Zhang was responsible for the thesis pattern recognition algorithm. Lingfei Ou was responsible for the data statistics and analysis.
5. Conclusions
The method of the EWT-SMF and MF-DFA has been proposed to improve the fault feature extraction of reciprocating compressor in this paper:
1) We applied EWT to the fault diagnosis of reciprocating compressor, and improved the part of the EWT algorithm according to the vibration signal characteristics of reciprocating compressor. Then considering the different characteristics of vibration signals in different states, we proposed a state motphological filtering method based on EWT, and different structural elements were used to filter signals in different states, which can achieve more fault features than the traditional filtering method such as the EWT, EEMD and EMD.
2) After the MF-DFA analysis was performed on the processed signal by EWT-SMF, the multi-fractal spectrum parameters of each processed signal was calculated to entirely describe the vibration intensity of reciprocating compressor and characterize the wave form in detail. Through comparison and analysis of the multi-fractal spectrum parameters, we finally constructed the four-dimensional eigenvector (, , , ) with a higher recognition efficiency and accuracy.
3) We proposed the method of the EWT-SMF and MF-DFA to analyze the vibration signals of reciprocating compressor valve. This method was verified the effectiveness by the experiment of reciprocating compressor valve, and it demonstrates the outstanding performance of recognition results through the comparison with other methods.
References
-
Wang Jindong, Dai Mei, Du Yongjun, et al. Fault feature extraction from reciprocating compressor valve based on EMD and information entropy. Compressor Technology, Vol. 4, 2013, p. 7-19.
-
Deng Wu, Yao Rui, Zhao Huimin, et al. A novel intelligent diagnosis method using optimal LS-SVM with improved PSO algorithm. Soft Computing, 2017, https://doi.org/10.1007/s00500-017-2940-9.
-
Zhao Huimin, Sun Meng, Deng Wu, et al. A new feature extraction method based on EEMD and multi-scale fuzzy entropy for motor bearing. Entropy, Vol. 19, Issue 1, 2017, p. 14.
-
Zhao Haiyang, Wang Jindong, Lee Jay, Li Ying A compound interpolation envelope local mean decomposition and its application for fault diagnosis of reciprocating compressors. Mechanical Systems and Signal Processing, Vol. 110, 2018, p. 273-295.
-
Gilles J. Empirical wavelet transform. IEEE Transactions on Signal Processing, Vol. 16, Issue 61, 2013, p. 3999-4010.
-
Deng Wu, Zhang Shengjie, Zhao Huimin A novel fault diagnosis method based on integrating empirical wavelet transform and fuzzy entropy for motor bearing. IEEE Access, Vol. 6, Issue 1, 2018, p. 35042-35056.
-
Li Chunzhi, He Jianrong, Tian Guangming Research on the application of the mathematical morphology filtering in vibration signal analysis. Computer Engineering and Science, Vol. 9, Issue 30, 2008, p. 126-128.
-
Li P., He Q., Kong F. Approach to fault diagnosis of bearings using wavelet-based fractal analysis. Proceedings of the IEEE International Conference on Information and Automation (ICIA), 2010, p. 2338-2343.
-
Wang Q., Zhang X. Application of fractal theory to fault diagnosis for hydraulic pump. Journal of Dalian Maritime University, 2004.
-
Kantelhardt J. W., Zschiegner S. A., Koscielny Bunde E., et al. Multifractal detrended fluctuation analysis of non-stationary time series. Physica A: Statistical Mechanics and its Applications, Vol. 316, 2002, p. 87-114.
-
Yu Y., Baoliang L., Jingshan S., Shixuan Y. Application of vibration signal multi-fractal in fault diagnosis. Proceedings of the IEEE 2nd International Conference on Future Networks, 2010, p. 164-167.
-
Ke P. Z., Yong H. Y., Qing L., Fulei C. Wavelet multifractal spectrum: application to analysis vibration signals. Chinese Journal of Mechanical Engineering, 2002.
-
Wang J., Wei W., Li H., Li X. Multifractal features extraction of bearing faults for reciprocating compressor. Journal of Vibration and Shock, Vol. 27, 2008, p. 313-315.
-
Talebinejad M., Chan A. D. C., Miri A. Fatigue estimation using novel multi-fractal detrended fluctuation analysis-based approach. Journal of Electromyography and Kinesiology, Vol. 3, Issue 20, 2010, p. 433-439.
-
Li M., Ma W. X., Liu X. J. Investigation of rolling bearing fault diagnosis based on multi-fractal and general fractal dimension. 2nd Intelligent Computation Technology and Automation, Zhangjiajie, 2009, p. 545-548.
-
Yu Y., Li B. L., Shang J. S., et al. Application of vibration signal multi-fractal in fault diagnosis. 2nd International Conference on Future Networks, Sanya, 2010, p. 164-167.
-
Tang J. Y., Shi Y. B., Zhou L. F., et al. Nonlinear analog circuit fault diagnosis using wavelet leaders multifractal analysis method. Control and Decision, Vol. 25, Issue 4, 2010, p. 605-609.
-
Lin Jinshan, Chen Qian Fault diagnosis of rolling bearings based on multifractal detrended fluctuation analysis and Mahalanobis distance criterion. Mechanical Systems and Signal Processing, Vol. 2, Issue 38, 2013, p. 515-533.
-
Gilles J., Tran G., Osher S. 2D empirical transforms. Wavelets, ridgelets, and curvelets revisited, SIAMJ. Journal on Imaging Sciences, Vol. 7, Issue 1, 2014, p. 157-186.
-
Gilles J., Heal K. A parameter less scale space-approach to find meaningful modes in histograms – application to image and spectrum segmentation. International Journal of Wavelets, Multiresolution and Information Processing, Vol. 12, Issue 6, 2014, p. 1450044.
-
Cao Hongrui, Fan Fei, Zhou Kai, et al. Wheel-bearing fault diagnosis of trains using empirical wavelet transform. Measurement, Vol. 82, 2016, p. 439-449.
-
Chen Jinglong, Pan Jun, Li Zipeng, et al. Generator bearing fault diagnosis for wind turbine via empirical wavelet transform using measured vibration signals. Renewable Energy, Vol. 89, 2016, p. 80-92.
-
Kedadouche Mourad, Liu Zhaoheng, Vu Viet Hung A new approach based on OMA-empirical wavelet transforms for bearing fault diagnosis. Measurement, Vol. 90, 2016, p. 292-308.
-
Zhang Lijun, Xu Jinwu, Yang Jianhong, et al. Adaptive multiscale morphology analysis and its application in fault diagnosis of bearings. Journal of University of Science and Technology Beijing, Vol. 4, Issue 30, 2008, p. 441-445.
-
Zhao Junlong Study on Diagnosis Methods for Reciprocating Compressors by Using Feature Analysis of Vibration Signals. Dalian University of Technology, Dalian, 2010.
-
Cui Baozhen The Theory of Adaptive Morphological Filter and Local Wave Decomposition and Roller Bearings Fault Diagnosis. North University of China, Taiyuan, 2013.
-
Karpathy A., Toderici G., Shetty S., et al. Large-scale video classification with convolutional neural networks. IEEE Conference on Computer Vision and Pattern Recognition, 2014, p. 1725-1732.
-
Oquab M., Bottou L., Laptev I., et al. Learning and transferring mid-level image representations using convolutional neural networks. IEEE Conference on Computer Vision and Pattern Recognition, 2014, p. 1717-1724.
-
Deng Wu, Yang Xinhua, Zou Li, et al. An improved self-adaptive differential evolution algorithm and its application. Chemometrics and Intelligent Laboratory Systems, Vol. 128, 2013, p. 66-76.
-
Deng Wu, Chen Rong, Gao Jian, et al. A novel parallel hybrid intelligence optimization algorithm for function approximation problem. Computers and Mathematics with Applications, Vol. 63, Issue 1, 2012, p. 325-336.
-
Deng Wu, Zhao Huimin, Yang Xinhua, et al. Study on an improved adaptive PSO algorithm for solving multi-objective gate assignment. Applied Soft Computing, Vol. 59, 2017, p. 288-302.
-
Deng Wu, Zhao Huimin, Zou Li, et al. A novel collaborative optimization algorithm in solving complex optimization problems. Soft Computing, Vol. 21, Issue 15, 2017, p. 4387-4398.
Cited by
About this article
This work was partly supported by the Natural Science Foundation of Heilongjiang Province in China (E2016009), the General Financial Grant from the China Postdoctoral Science Foundation (2015M581423), the Northeast Petroleum University Innovation Foundation For Postgraduates (YJSCX2017-020NEPU), and the Youth Science Foundation of Northeast Petroleum University (2018ANC-31).
