Abstract
In this study, some devices and utilities used for taking electroencephalography (EEG) records to be used in the diagnosis and treatment of brain-related diseases are introduced and the analyzes made on the records are given. The purpose of this study is to explain how, and by which tools the brain electrical activity is measured, the EEG method used for measurement and the analysis methods of EEG, and to show the benefits of applying system research principles to the electrical activities obtained with important studies. The device used for taking EEG recordings is the Emotiv EPOC + 14 Channel Mobile EEG device. The programs used for the recording and analysis of the EEG recordings in computer environment are EMOTIV App, EmotivPRO, EmotivBCI, Emotiv Xavier Contorlpanel ve Emotiv Brain Activitiy Map programs.
Highlights
- Alzheimer's patients affects the left frontal and central regions of the brain, and delta and theta are the main components of the oddball paradigm
- The delta and theta frequency bands in both coherence and event-related oscillation
- EMOTIV App, EmotivPRO, EmotivBCI, Emotiv Xavier Contorlpanel and Emotiv Brain Activitiy Map programs
1. Introduction
The brain, which is the center of balance and decision of the body, is a complex structure. Especially the human brain has a more difficult structure to be figured out than the brains of other living things. Many studies have been carried out with various methods to understand the dynamic structure of the human brain up to the present. One of the brain imaging methods is electroencephalography (EEG). EEG can be used in neuroscience research, neurology and psychiatry clinics to aid diagnosis and to obtain information about the course of the disease [1].
There are several current studies on the measurement and processing of EEG signals. In one of these novel studies, a compact and wearable headband is designed for Human Machine Interfaces with the same measuring procedure used in our study. The study frees the user from the cable mess and provides long term brain signal acquisition [2].
In a study by Tafreshi et al., classification of 12 basic objects has been done by measuring and processing EEG signals. They compared different classification accuracies with respect to different techniques and analyzes of the brain lobes [3].
EEG signal processing applications already began to take part in our daily lives. As a result of the work of Ersoy et al., disabled individuals can meet their needs by controlling the smart home systems placed in the dwelling with the power of thought, without the need for other people by analyzing brain waves. In their work, brain signals are detected with the NeuroSky Mobile Wave Sensor and transmitted to Arduino via Bluetooth. The EEG signals processed, interpreted, and the results are transmitted to the MZ80 infrared sensor to control the home automation system [4].
EEG oscillations are caused by the superposition (with overlap of the wave) of delta (0.5-3.5 Hz), theta (4-7 Hz), alpha (8-13 Hz), beta (15-30 Hz) and gamma (28-100 Hz) waves that have different frequency ranges. With the power spectrum analysis using Fast Fourier Transform, the EEG data cleared of artifacts are separated into oscillational components and amplitude values of each frequency are obtained [5, 6].
As the human brain can be considered as a system, general system theory principles can also be applied to the brain. As a result of such studies, more effective results can be obtained in the diagnosis and treatment of brain diseases with the available data.
2. Method
The standard method used for placing electrodes on the scalp is the 10-20 electrode system specified by the International EEG Federation Association [7]. In the form of this settlement, the head is marked with four standard points as “Nasion”, nose; “Inion”, the back of the head; right and left preauricular. Electrodes are placed by dividing “nasion” and “inion” as 10-20-20-20-20 and 10 as a percentage.
Other electrodes are placed to form a circle with the electrodes. Thus, 19 electrodes are placed on the head. The 20th electrode placed on the earlobe is used as the ground electrode. Electrode placements according to this system are shown in the Fig. 1. For more electrode placements, the extended 10/20 system or equidistant systems are used. Electrodes on the left side of the head are indicated with odd numbers, electrodes on the right side with even numbers, and midline electrodes with a small letter ‘z’ [8].
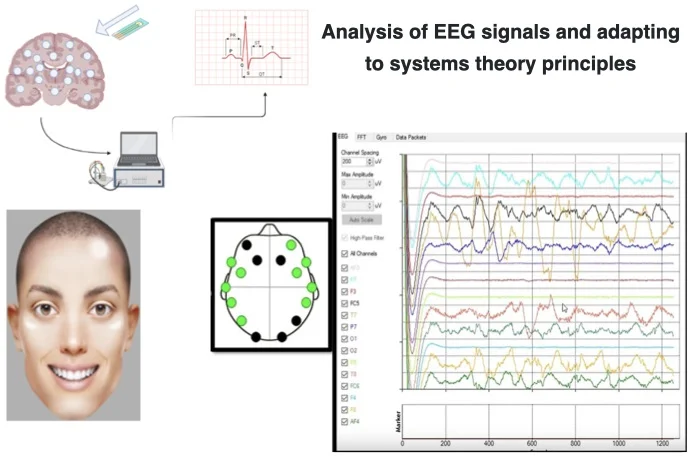
Fig. 1A schematic diagram of the EEG measurement and data acquisition system, created with BioRender.com
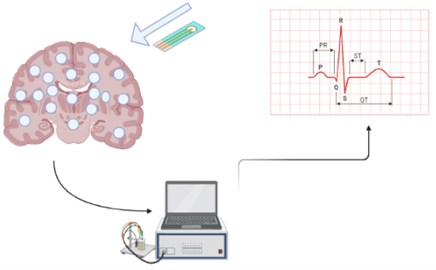
EEG recording is usually taken with the help of a cap surrounding the skull or electrodes placed on the leg ends of the device. Various types of electrodes are available and may vary depending on the purpose of usage. The impedance should be low (less than 10 kΩ) to have a small number of artifacts (false signals) in the EEG recording. The solutions called gel and mask used to reduce the impedance are used by squeezing between the scalp and the electrode with the help of a syringe. Gel and mask have a conductivity-enhancing effect. A computer is used during the measurement. The computer is used to send a stimulus to the registered person and to perform the recording process.
Fig. 2The lobes of the brain [9]
![The lobes of the brain [9]](https://static-01.extrica.com/articles/22038/22038-img2.jpg)
The duty of each lobe of the brain is responsible for different functions. Parietal lobe includes unimodal junction area for sensory and visual information, and multimodal junction areas for integration of somatosensory and visual senses. Occipital lobe makes the processing, integration and interpretation of visual stimuli. Temporal lobe is the primary auditory center and at the same time is the zone of the visual and auditory object recognition, emotion, and memory. These lobes of the brain are shown in Fig. 2.
Some of the important points obtained from this study:
1) EEG is one of the basic research methods to understand sensory and cognitive functions with event-related potentials and event-related oscillation analysis [10].
2) EEG oscillations consist of different components. Among the methods used to distinguish these components, power spectrum and coherence analysis is one of the analyzes that should be applied to understand brain dynamics [11].
3) EEG oscillations vary according to external factors, stimuli given and brain health.
4) Various pathologies cause changes in oscillational components delivered by diseased brains, and drug use reduces the pathological deformation of electrical signals.
3. Results
With the development of computers, it has become easier to take EEG records, analyze the records and store the results. Today, with a system established between the brain and the computer, we can make recording and analysis processes more easily. The system we are currently using is the EMOTIV EPOC + 14 Channel Mobile EEG system.
The first stage of the system is the electrodes used to measure the electrical activity of the brain. The amplifier is used for analog filtering and sampling of the EEG signals obtained through these electrodes. Then, the analogue data obtained is transformed into a form that can be detected from the serial ports of the computer using the processor interface and the measured signals are sent to the computer to be viewed and recorded.
3.1. Software
EMOTIV App, EmotivPRO, EmotivBCI, Emotiv Xavier Contorlpanel and Emotiv Brain Activitiy Map software are used to take the EEG record and analyze these records. In Fig. 3, the EEG data and the brain activity map observed from the software, and in Fig. 4, the interfaces of the EMOTIV software used are shown.
Fig. 3a) The EEG frequency components and b) the brain activity map
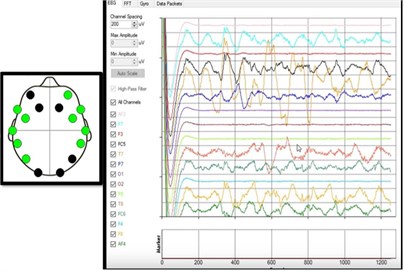
a)
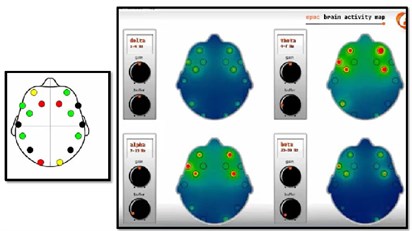
b)
3.2. EEG recording
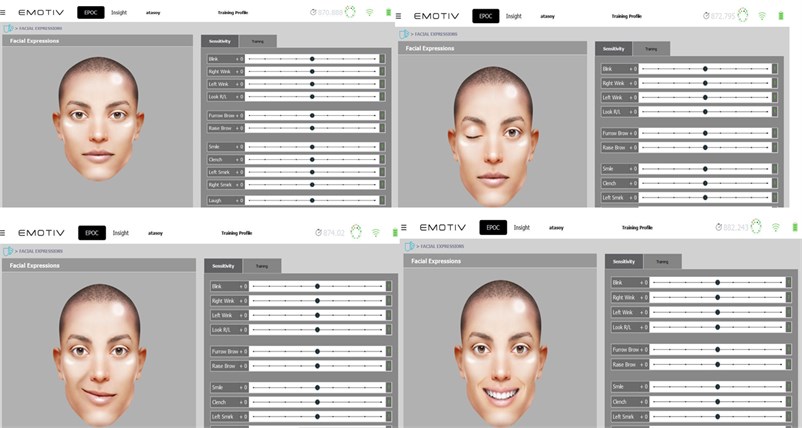
In current studies, EEG records are taken from 14 channels called AF3, F7, F3, FC5, T7, P7, O1, O2, P8, T8, FC6, F4, F8, AF4. The names and locations of these channels were determined according to the 10-20 system. Fig. 5 shows the recognition of human gestures to the system.
Fig. 4The interfaces of the EMOTIV software
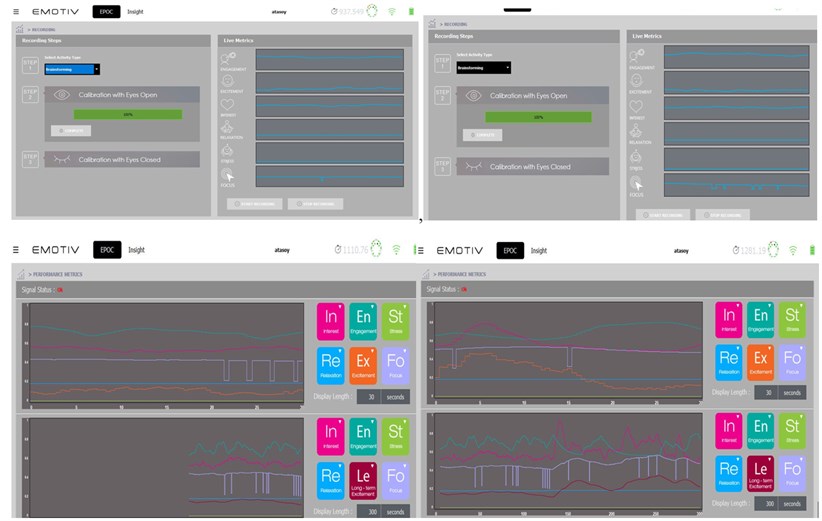
Fig. 5Recognition of the human gestures in EMOTIV App
The experiment consists of 6 stages with different lengths of time. We can generally group the stages as spontaneous, evoked potential and event related potential. The order of stages:
1) Spontaneous EEG recording: The person looks at the black image on the monitor with her/his eyes open for a certain period of time, then closes her/his eyes upon our request.
2) Auditory evoked potential recording: The person hears a single type of sound and only listens, looks at the black screen.
3) Potential recording regarding auditory event: In this section, the person is given the classical auditory oddball paradigm and is expected to distinguish target low sounds from non-target high sounds.
4) Visual evoked potential recording: the person sees a single type of light and only watches the light.
5) Potential recording regarding visual event: in this section, the person is given the Classic visual oddball paradigm and is expected to separate the target light from dark non-target light.
6) Spontaneous EEG recording: Finally, the first step is repeated.
4. Conclusions
EEG taken and analyses performed to understand the dynamic structure of the brain should be evaluated considering all kinds of pathology (e.g., Alzheimer’s, Bipolar, Schizophrenia), given paradigms (e.g., auditory oddball paradigm) and oscillational components (e.g., delta, theta, alpha, beta, gamma). EEG results for various pathologies are exampled in Fig. 6.
Fig. 6EEG results for various pathologies
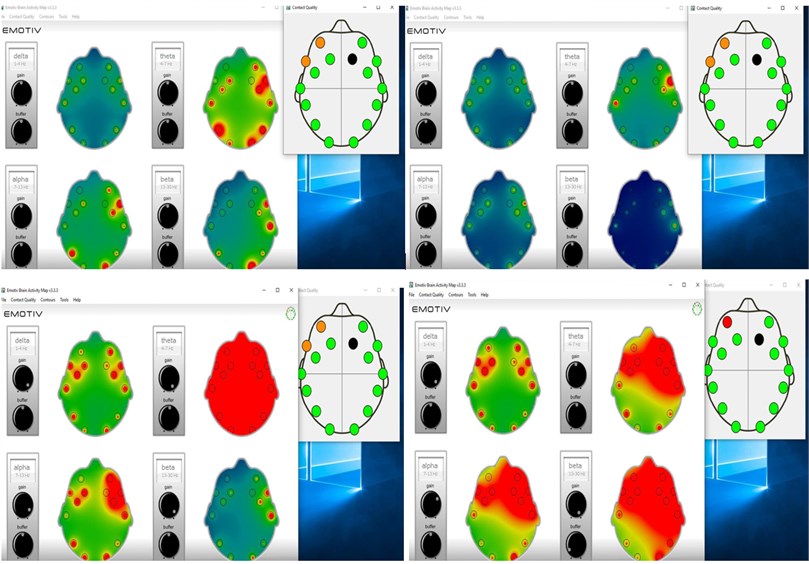
These studies show that the disease in Alzheimer’s patients affects the left frontal and central regions of the brain, and delta and theta are the main components of the oddball paradigm because the most significant findings were found in the delta and theta frequency bands in both coherence and event-related oscillation studies.
References
-
E. E. Tülay and E. Başar, “Measurement and signal analysis of the electrical activity of the brain,” (in Turkish), M.Sc. Thesis, Istanbul Culture University, Institute of Pure Sciences, Istanbul, 2009.
-
M. R. Carneiro, A. T. de Almeida, and M. Tavakoli, “Wearable and comfortable e-textile headband for long-term acquisition of forehead EEG signals,” IEEE Sensors Journal, Vol. 20, No. 24, pp. 15107–15116, Dec. 2020, https://doi.org/10.1109/jsen.2020.3009629
-
T. F. Tafreshi, M. R. Daliri, and M. Ghodousi, “Functional and effective connectivity based features of EEG signals for object recognition,” Cognitive Neurodynamics, Vol. 13, No. 6, pp. 555–566, Dec. 2019, https://doi.org/10.1007/s11571-019-09556-7
-
S. Ersoy, B. Ilhan, B. Önder, and M. E. Kalender, “Smart home systems controlled by brain waves,” (in Turkish), in 3rd International Multidisciplinary Studies Congress, 2018.
-
E. St. Louis et al., Electroencephalography (EEG): An Introductory Text and Atlas of Normal and Abnormal Findings in Adults, Children, and Infants. American Epilepsy Society, 2016, https://doi.org/10.5698/978-0-9979756-0-4
-
Libenson Mark H., Practical Approach to Electroencephalography. Philadelphia: Elsevier/Saunders, 2010.
-
Klem Gh, Lüders Ho, Jasper Hh, and Elger C., “The ten-twenty electrode system of the International Federation,” Electroencephalography and Clinical Neurophysiology. Supplement, Vol. 52, pp. 3–6, 1999.
-
Y. Kaya and Ö. Ertuğrul Ve R. Tekin, “Decision rules and using decision trees in classification of epileptic EEG signs,” Journal of Life Sciences, No. 2, pp. 403–413, Jun. 2012.
-
Biorender, “Anatomy of the Brain”. https://app.biorender.com/biorender-templates (accessed 2021).
-
E. Başar, “Oscillations in “brain-body-mind”-A holistic view including the autonomous system,” Brain Research, Vol. 1235, pp. 2–11, Oct. 2008, https://doi.org/10.1016/j.brainres.2008.06.102
-
E. Başar and B. Güntekin, “A review of brain oscillations in cognitive disorders and the role of neurotransmitters,” Brain Research, Vol. 1235, pp. 172–193, Oct. 2008, https://doi.org/10.1016/j.brainres.2008.06.103
About this article

