Abstract
Lattice boom used on the crawler crane are welded by slender high strength steel tubes. Many studies show that the actual bearing capacity of high-strength steel tubes is higher than the stability bearing capacity calculated according to the specification. To obtain the actual bearing capacity of high-strength steel tubes and apply it to engineering practice, a series of axial loading tests are carried out on two kinds of high-strength steel tubes of 20Mn2 and S890 to obtain their damage load. By handling test data, and the coefficient fitting and correction are carried out according to the stability coefficient calculation formula of the Chinese steel structure specification. The results show that it is conservative to calculate the bearing capacity of high strength steel tubes by using the stability curve in the specification, and the bearing capacity of high strength steel tubes calculated by fitted coefficient is more consistent with its actual bearing capacity.
1. Introduction
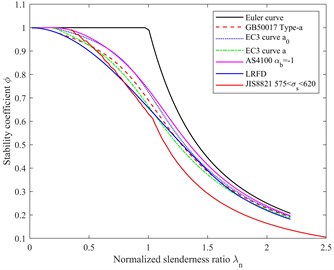
Due to the strong bearing capacity of high-strength steel tubes, Lattice boom are used on crawler cranes are welded by slender high strength steel tubes. When calculating the bearing capacity of the lattice boom chords, it is calibrated according to the calibration formula of axial compression members in the existing steel structure specification or crane design specification. The stability curves of axial compression members in the current steel structure specification are obtained based on the test and analysis of carbon steel members [1]. Representative steel structure specifications or crane design specifications mainly include: China’s GB 50017-2017 [2] or GB 3811-2008 “Crane Design Specification” [3], Europe’s Eurocode 3 [4], “Load and Resistance Factor Design Specification” of American Institute of Steel Structure [5], Australian steel structure standard AS4100:1998 [6] and Japan's JIS-B8821-2004 “Calculation Standard of Crane Steel Structure” [7], etc. For example, taking the hot-rolled 20Mn2 steel tubes (yield strength 590 MPa), who’s the stability coefficient curves calculated according to the steel structure or crane design specification of the above-mentioned countries are shown in Fig. 1. The stability curve of GB 50017-2003 in China is at a medium level according to the comparison results of various countries' standards, and the bearing capacity of high strength steel has some room for improvement.
More and more scholars pay attention to the ultimate load of high-strength steel members in recent years. Among them, Wang [1] found that the design curve specified in Eurocode 3 and GB 50017-2003 was 18.7 % and 23.2 % lower than the theoretical curve on average. Rasmussen [8] shows that the bearing curve in Eurocode 3 is too conservative. Hancock [9] compared all the test results with the Australian steel structure standard AS4100:1998, Eurocode 3 and the design specification of load and resistance coefficient of American Institute of Steel Structure. Yang’s [10, 11] results show that the more important where elastic local buckling and local buckling are for the more slender part, the effect of low strain hardening does not seem to be significant, and Yang improved the simple scheme of design capacity. Ye [12] put forward design suggestions specific to G550 steel. Ban Huiyong et al. [13-15] and Shi Gang et al. [16, 17] tested and analyzed the overall buckling behavior of a series of 460 MPa, 960 MPa high-strength steel I-shaped and square specimens. The results showed that the stability curve in the current design specification underestimated the buckling bearing capacity of high-strength steel.
At present, the rolling process and processing process of high-strength steel tubes have been greatly improved compared with the formulation of the stability curve. It is necessary to study the performance of high-strength steel tubes, and realize the further lightweight design of lattice boom.
Fig. 1Comparison of stability curves of hot rolled 20Mn2 steel tubes in various steel structure specifications
2. Specimens and test method
2.1. Specimens
The factors affecting the bearing capacity of high-strength steel tubes include not only the determined parameters such as the length, specification and yield strength of the material, but also some uncertain parameters such as initial defects, residual stress and eccentricity of load.
In this test, high-strength steel tubes of 20Mn2 and S890 commonly used on the lattice boom of the crawler crane are selected. The specific parameters of steel tubes of two materials are shown in Table 1.
Table 1Material and specification of specimens
Material | Nominal yield strength (MPa) | Specimen specification | Length range (mm) | Length increment (mm) | Length quantity | Quantity |
20Mn2 | 590 | Φ65×4 | 750-2000 | 250 | 6 | 9 |
S890 | 890 | Φ88.9×6.3 | 1500-3000 | 250 | 7 | 9 |
2.2. Mechanical property test of specimens
The stability and bearing capacity of the specimens depends on the material mechanical properties of the specimens directly, so it is necessary to determine the mechanical property parameters of the material of the specimens. The nominal yield strength of 20Mn2 provided by the manufacturer is 590 MPa and the strength limit is 780MPa; the nominal yield strength of S890 is 890 MPa and the strength limit is 960 MPa. To verify the real mechanical property parameters of steel tubes materials, the mechanical properties test is carried out by sampling from the test steel tubes. The sampling and preparation of specimens are performed by the standard [18], the design and test process of specimens are performed by the standard [19], and the test equipment is INSTRON 8802 hydraulic servo testing machine. The mechanical properties of chord materials obtained from the test are shown in Table 2.
The maximum yield strength of the specimen sampled from 20Mn2 steel tubes is 607.2 MPa, the minimum value is 565.7 MPa, and the average value is 592.9 MPa. The dispersion is small, so 590 MPa is directly used as the yield strength of chord material. The same conclusion is reached for S890 steel tubes, so 890 MPa is also directly used as the yield strength of chord material.
2.3. Axial loading test equipment
To obtain the real bearing capacity of the steel tubes, during the test, it is necessary to ensure that the boundary conditions at the end of the steel tubes meet the boundary conditions of hinged support at both ends and reduce the bending moment caused by the load eccentricity at both ends of the specimen.
The two ends of the steel tubes adopt joints (single knife-edge form) and select the hinged support at both ends of the support to realize the boundary condition and the tooling. The joint length of the Φ65×4 is 286 mm, and the joint length of the Φ88.9×6.3 is 290 mm. The right end is fixed and the left end is loaded with force. It can be predicted from the knowledge of material mechanics that the middle part of the steel tubes tends to yield firstly. Therefore, eight strain gauges are pasted at eight directions in the middle of the steel tubes, and the stress in the middle of the steel tubes is monitored in real-time through the strain dynamic data acquisition system, and the loading amplitude is adjusted in real-time, to make the application of the test bench load more stable and safer, and the data obtained is more real and reliable.
Table 2Test data of mechanical properties of the two materials
Specimen No. | Yield strength (MPa) | Ultimate strength (MPa) | Yield strength (MPa) | Ultimate strength (MPa) |
1 | 603.6 | 871.8 | 916.0 | 979.7 |
2 | 580.2 | 875.1 | 867.8 | 1017.7 |
3 | 602.6 | 897.0 | 894.1 | 988.7 |
4 | 579.7 | 888.4 | 888.2 | 1001.7 |
5 | 607.2 | 881.1 | 860.7 | 979.9 |
6 | 584.0 | 909.8 | 880.2 | 1006.1 |
Average | 592.9 | 887.2 | 884.5 | 995.6 |
3. Test results
The damage forms of specimens made of 20Mn2 and S890 are permanent bending plastic deformation in the middle. The samples of this test are all hot-rolled hollow circular tubes. The bearing capacity of the steel tubes can be obtained based on the check formula of axial compression members in GB50017. The calculation formula is as follows:
where, is the pressure, is the cross-sectional area and is the yield strength of the material. is the stability coefficient. The stability coefficient of hot-rolled hollow circular pipe should be determined according to the stability coefficient of type-a section axial compression member in GB50017. The calculation formula of stability coefficient is:
When :
when :
where , , are coefficients, = 0.41, = 0.986, = 0.152, and are normalized slenderness ratio:
where is the slenderness ratio and is the elastic modulus.
The test damage load of the 20Mn2 steel tubes and the bearing capacity calculated according to the specification are summarized and compared in Table 3. The test damage load of the S890 steel tubes and the bearing capacity calculated according to the specification are summarized and compared as shown in Table 4.
Table 3Comparison of bearing capacity of 20Mn2 steel tubes
Serial No. | Total length (mm) | Measured outer diameter (mm) | Measured wall thickness (mm) | Bearing capacity EC3 (kN) | Bearing capacity GB50017 (kN) | Test (kN) | ||
1500-1 | 1787 | 65.36 | 4.08 | 206.1 | 199.9 | 211.9 | 102.8 % | 106.0 % |
1500-2 | 1786 | 65.46 | 4.14 | 209.7 | 203.4 | 215.7 | 102.9 % | 106.0 % |
1500-3 | 1787 | 65.32 | 4.44 | 220.4 | 214.0 | 220.7 | 100.1 % | 103.1 % |
1750-1 | 2037 | 65.29 | 4.17 | 165.7 | 161.9 | 165.1 | 99.6 % | 102.0 % |
1750-2 | 2037 | 65.29 | 4.17 | 165.7 | 161.9 | 173.9 | 104.9 % | 107.4 % |
1750-3 | 2037 | 65.29 | 4.17 | 165.7 | 161.9 | 176.8 | 106.7 % | 109.2 % |
2000-1 | 2037 | 65.29 | 4.17 | 165.7 | 161.9 | 170.9 | 103.1 % | 105.6 % |
2000-2 | 2285 | 65.28 | 4.23 | 135.6 | 133.0 | 133.8 | 98.7 % | 100.6 % |
2000-3 | 2285 | 65.28 | 4.23 | 135.6 | 133.0 | 139.9 | 103.2 % | 105.2 % |
Table 4Comparison of bearing capacity of S890 steel tubes
Serial No. | Total length (mm) | Measured outer diameter (mm) | Measured wall thickness (mm) | Bearing capacity EC3 (kN) | Bearing capacity GB50017 (kN) | Test (kN) | ||
1500-1 | 1787 | 89.23 | 6.37 | 771.4 | 744.2 | 830.0 | 107.6 % | 111.5 % |
1500-2 | 1787 | 89.21 | 6.33 | 767.0 | 739.9 | 782.5 | 102.0 % | 105.8 % |
1500-3 | 1787 | 89.16 | 6.52 | 784.3 | 756.8 | 830.0 | 105.8 % | 109.7 % |
1750-1 | 2036 | 89.08 | 6.34 | 613.6 | 596.5 | 662.0 | 107.9 % | 111.0 % |
1750-2 | 2037 | 89.14 | 6.45 | 622.8 | 605.5 | 655.0 | 105.2 % | 108.2 % |
1750-3 | 2036 | 89.19 | 6.39 | 619.7 | 602.4 | 645.0 | 104.1 % | 107.1 % |
2000-1 | 2287 | 89.12 | 6.29 | 495.7 | 484.4 | 533.0 | 107.5 % | 110.0 % |
2000-2 | 2287 | 89.09 | 6.36 | 499.5 | 488.2 | 512.0 | 102.5 % | 104.9 % |
2000-3 | 2286 | 89.14 | 6.37 | 501.4 | 490.0 | 558.0 | 111.3 % | 113.9 % |
4. Coefficient fitting of stability coefficient calculation formula
The discrete test data cannot be directly used in engineering practice. Therefore, the calculation formula of stability coefficient in GB50017 is used for coefficient fitting, and finally, the stability performance calculation formula suitable for high strength steel tubes is obtained. Since the normalized slenderness ratio of the test steel tubes are greater than 0.215, the form of the Eq. (3) is used for fitting.
In order to make the obtained corrected coefficient safe and reliable, all the lowest points are used as fitting data, and finally, the corrected coefficient 0.9718, 0.0912 is determined. The comparison between the fitted curve, Euler curve and the stability curve of type-a members in GB50017 is shown in Fig. 2. In Fig. 2, when the normalized slenderness ratio is , the fitting curve is obviously higher than the standard curve, that is, when the normalized slenderness ratio is , the stability coefficient obtained from the test is larger than the standard stability coefficient. It can be concluded that the test data is effective for the normalized slenderness ratio , so the calculation formula of the standard stability coefficient is modified in this interval. Within the range of normalized slenderness ratio , the comparison of stability coefficient between type-a stability curve in GB50017 and test fitting curve is shown in Table 5.
Fig. 2Comparison between stability curve of test data fitting and stability curve in GB50017
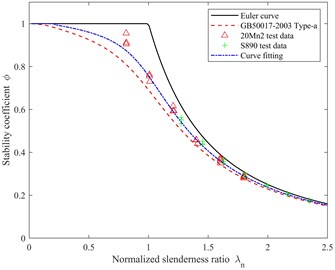
Table 5Comparison between fitting stability coefficient formula and type-a curve of GB50017 when the normalized slenderness ratio λn∈[0.75,1.25]
Normalized slenderness ratio | GB50017 specification type-a | Test fitting curve | (Fitting curve-specification type-a) / Specification type-a |
0.800 | 0.816 | 0.904 | 10.8 % |
0.900 | 0.758 | 0.852 | 12.3 % |
1.000 | 0.691 | 0.779 | 12.6 % |
1.100 | 0.620 | 0.692 | 11.7 % |
1.200 | 0.551 | 0.607 | 10.2 % |
1.300 | 0.488 | 0.531 | 8.8 % |
1.400 | 0.433 | 0.466 | 7.7 % |
1.500 | 0.385 | 0.411 | 6.7 % |
According to Table 5, when the normalized slenderness ratio is , the test stability curve is nearly 9.5 % higher than the type-a stability curve in GB50017; When the normalized slenderness ratio is , the test stability curve is also more than 6.7 % higher than type-a stability curve in GB50017. It can be concluded that the modified stability coefficient calculation formula shows that there is at least 6 % improvement space in the lightweight design of the lattice boom, which is of great significance to improve the lifting performance determined by the chord of the crane lattice boom and realize the lightweight of the boom.
5. Conclusions
In this paper, through the axial loading test of high-strength steel tubes commonly used in crane lattice boom, the actual stable bearing capacity of high-strength steel tubes is obtained. The test damage load of the steel tubes is compared with the bearing capacity calculated according to GB50017 and Eurocode 3. The results show that the current steel structure specification underestimates the bearing capacity of high-strength steel tubes. Therefore, curve fitting is performed in the form of the stability coefficient calculation formula in GB50017, and the stability coefficient calculation formula suitable for high-strength steel tubes is obtained. When the normalized slenderness ratio of the lattice boom chord is in the range of 0.75-1.5, and the test stability curve is higher than GB50017 for 6.7 % at least.
References
-
Y.-B. Wang, G.-Q. Li, S.-W. Chen, and F.-F. Sun, “Experimental and numerical study on the behavior of axially compressed high strength steel columns with H-section,” Engineering Structures, Vol. 43, pp. 149–159, Oct. 2012, https://doi.org/10.1016/j.engstruct.2012.05.018
-
Gb50017-2017, “Specification for design of steel structures,” (in Chinese), Beijing: China Planning Press, 2017.
-
Gb3811-2008, “Crane design specification,” (in Chinese), Beijing: China Standard Press, 2008.
-
En 1993-1-1, “Eurocode 3: Design of steel structures – Part 1-1: General rules and rules for buildings,” The European Union Per Regulation, 2005.
-
Yatniel Bustamante and Andres Ruiz, “Load and resistance factor design specification for structural steel buildings,” Chicago, American Institute of Steel Construction, INC, 1986.
-
N. Trahair and M. A. Bradford, Behaviour and Design of Steel Structures to AS4100. CRC Press, 1998.
-
Jis B. 8821:2004, “Standard of calculation for structural parts of clad steel,” Japan Society of Standardization, 2004.
-
K. J. R. Rasmussen and G. J. Hancock, “Tests of high strength steel columns,” Journal of Constructional Steel Research, Vol. 34, No. 1, pp. 27–52, Jan. 1995, https://doi.org/10.1016/0143-974x(95)97296-a
-
G. J. Hancock and K. J. R. Rasmussen, “Recent research on thin-walled beam-columns,” Thin-Walled Structures, Vol. 32, No. 1-3, pp. 3–18, Sep. 1998, https://doi.org/10.1016/s0263-8231(98)00025-1
-
D. Yang and G. J. Hancock, “Compression tests of cold-reduced high strength steel sections. I: Stub columns,” Journal of Structural Engineering, Vol. 130, No. 11, pp. 1772–1781, Nov. 2004, https://doi.org/10.1061/(asce)0733-9445(2004)130:11(1772)
-
D. Yang, G. J. Hancock, and K. J. R. Rasmussen, “Compression tests of cold-reduced high strength steel sections. II: long columns,” Journal of Structural Engineering, Vol. 130, No. 11, pp. 1782–1789, Nov. 2004, https://doi.org/10.1061/(asce)0733-9445(2004)130:11(1782)
-
J. Ye and K. J. Rasmussen, “Compression strength of unstiffened elements in cold-reduced high strength steel,” Journal of Structural Engineering, Vol. 134, No. 2, pp. 189–197, Feb. 2008, https://doi.org/10.1061/(asce)0733-9445(2008)134:2(189)
-
Ban Huiyong, “Research on the overall buckling behavior and design method of high strength steel columns under axial compression,” (in Chinese), Tsinghua University, 2012.
-
H. Ban, G. Shi, Y. Shi, and Y. Wang, “Overall buckling behavior of 460MPa high strength steel columns: Experimental investigation and design method,” Journal of Constructional Steel Research, Vol. 74, No. 6, pp. 140–150, Jul. 2012, https://doi.org/10.1016/j.jcsr.2012.02.013
-
H. Ban, G. Shi, Y. Shi, and M. A. Bradford, “Experimental investigation of the overall buckling behaviour of 960 MPa high strength steel columns,” Journal of Constructional Steel Research, Vol. 88, pp. 256–266, Sep. 2013, https://doi.org/10.1016/j.jcsr.2013.05.015
-
Shi G., Shi P., and Wang Yq, “Analysis on overall buckling behavior of ultra-high strength steel columns by ANSYS,” (in Chinese), Journal of Jilin University (Engineering), Vol. 39, pp. 115–120, 2009.
-
G. Shi, H. Ban, F. S. K. Bijlaard, Y. Shi, and Y. Wang, “Experimental study and finite element analysis on the overall buckling behavior of ultra-high strength steel compression members with end restraints,” (in Chinese), China Civil Engineering Journal, Vol. 44, No. 10, pp. 17–25, Jan. 2011.
-
G. T. 2975-1998, “Steel and steel products-Location and preparation of samples and test pieces for mechanical testing,” (in Chinese), Beijing: China Standard Publishing House, 1998.
-
G. T. 228-2010, “Metallic materials-Tensile testing at ambient temperature,” (in Chinese), Beijing: China Standard Publishing House, 2010.
About this article

The author(s) disclosed receipt of the following financial support for the research, authorship, and/or publication of this article: This work was financially supported by the Special fund project for transformation of scientific and technological achievements in Jiangsu Province (Grant No. BA2019016).
