Abstract
The sensor is the front-end component of the bridge structural health monitoring system. In this study, three fault diagnosis methods based on principal element analysis are applied to a bridge health monitoring system. The diagnostic results show that significant differences among the operating conditions will deteriorate the robustness of the diagnostic methods. The applicability of the sensor fault diagnosis method is verified based on the principal element analysis of a practical health monitoring system.
Highlights
- In this study, three fault diagnosis methods based on principal element analysis are applied to a bridge health monitoring system.
- The diagnostic results show that significant differences among the operating conditions will deteriorate the robustness of the diagnostic methods.
- The applicability of the sensor fault diagnosis method is verified based on the principal element analysis of a practical health monitoring system.
1. Introduction
Structural health monitoring (SHM) systems have been promoted and applied to many major engineering structures [1]. As the front-end component in the monitoring system, the sensor is used primarily to acquire structural response information, and its performance directly affects the accuracy of structural damage identification and structural safety assessment [2, 3]. It has been shown that sensor failures cause false or overlooked alarms in structural health monitoring systems [4-6].
In projects involving principal component analysis (PCA), data are processed into a principal component subspace and a residual subspace using multivariate projection techniques such that fault diagnosis can be performed in a low-dimensional space [7-9]. Using the weighted principal component analysis (WPCA) method, it is theoretically derived that the square prediction error (SPE) exhibits a square relationship with each element in the principal vector of the residual space, and each element is used as the nonlinear weighting coefficient of the SPE. To diagnose faults in nonlinear systems, Scholkopf et al. [10] proposed another nonlinear PCA algorithm, which is known as kernel principal component analysis (KPCA).
In this study, three fault diagnosis methods, i.e., PCA, WPCA, and KPCA, were applied to a large-span cable-stayed bridge health monitoring system for multisensor fault self-diagnosis, and the advantages and disadvantages of the three diagnostic methods were comprehensively compared to provide reliable suggestions for the sensor fault self-diagnosis of the structural health monitoring system.
2. Background
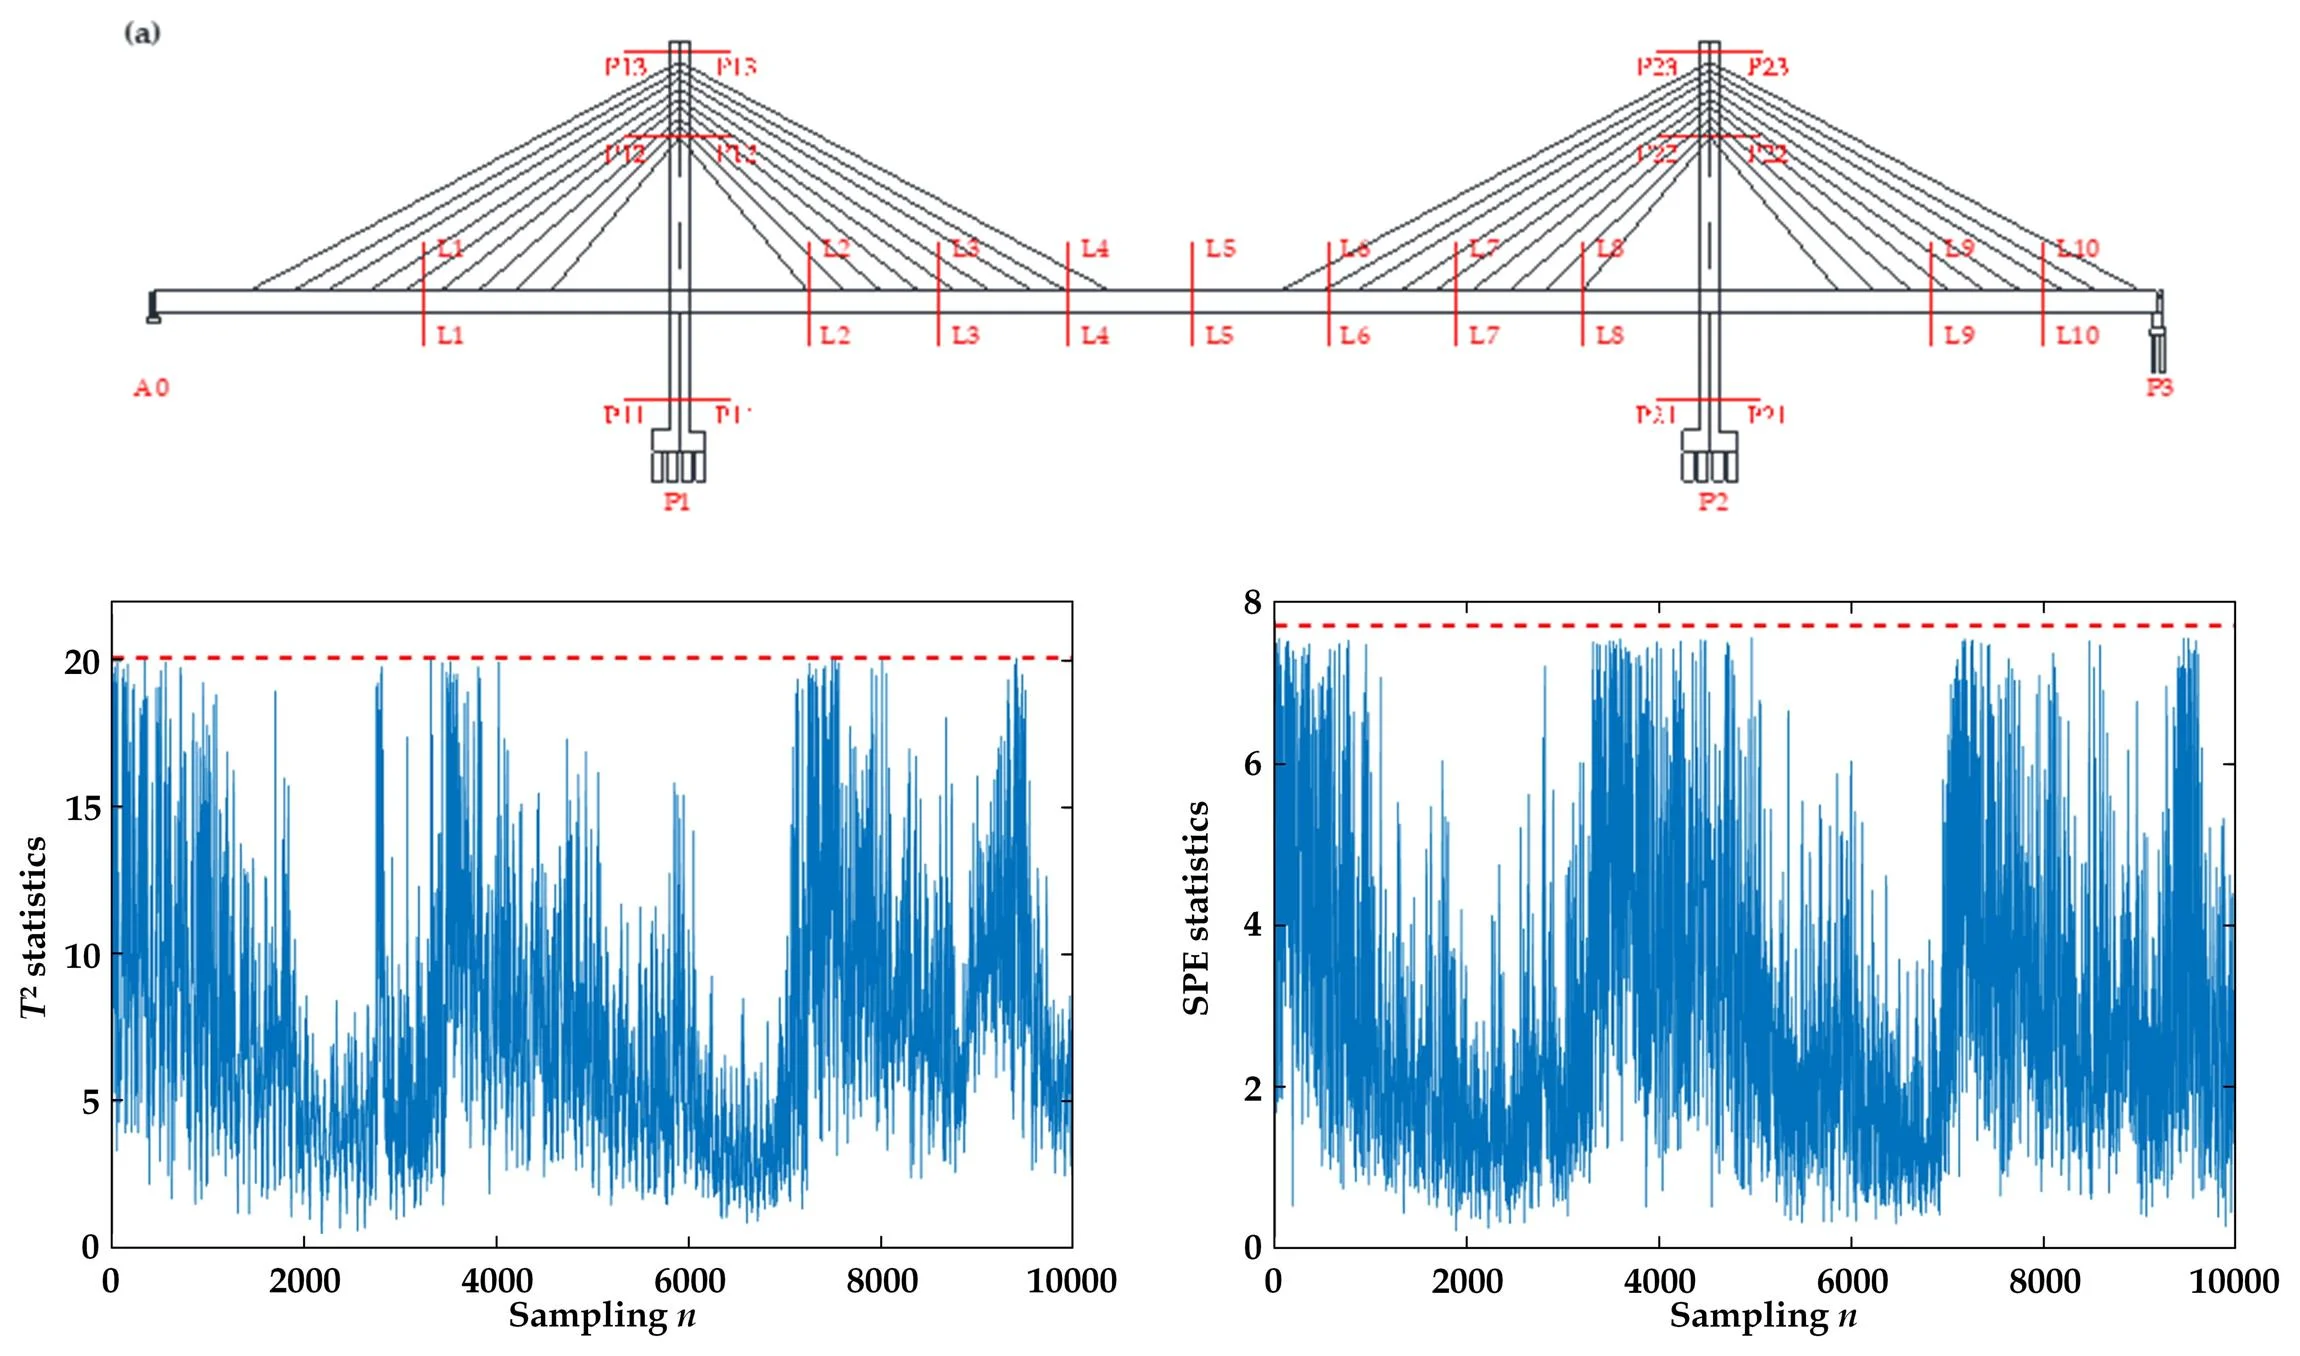
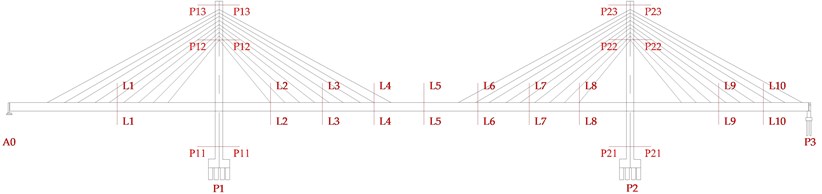
The bridge is a double-tower single-cable-stayed bridge with a main span of 445 m and a total length of 858 m. The left main tower is 172.6 m high, and the right main tower is 162.5 m. The bridge is composed of steel truss girders, which are partitioned into two levels, i.e., an upper level with sidewalks and four lanes in both directions, and a lower level with a two-way track line. A structural health monitoring system was installed on the bridge to enable the real-time monitoring of the bridge. The monitored parameters included temperature, stress, deformation, vibration, cable force, wind direction and velocity, and over-running vehicles. In total, 31 vibration measurement points were arranged of the bridge, as follows: 14 and 9 vertical and trans-verse acceleration points on the main beam, respectively; and two vertical acceleration points and two transverse acceleration points on each of the left and right main towers. The specific layout section and measurement points are shown in Fig. 1.
Fig. 1Elevation view of measurement points
3. Application of fault diagnosis method to bridge
It was assumed that the bridge was structurally intact, and that all the acceleration sensors used were in normal condition at the beginning of the operation. Because the bridge is affected by temperature and vehicle excitation at all times during its operation, the operating conditions during the daytime when the bridge was hot and during peak operation were inconsistent with those at night when the bridge was cold and in off-peak operation. Therefore, a time-of-day approach was used to troubleshoot the sensors. Data obtained at 09:00 am and 00:00 am at the beginning of the operation of the monitoring system were selected for analysis, and PCA, WPCA, and KPCA were performed to diagnose the sensor faults. Because the acceleration difference between the main girder and the tower of the bridge was significant, only the acceleration sensor on the main girder was analyzed.
Fig. 2Test results at 00:00 am on April 5
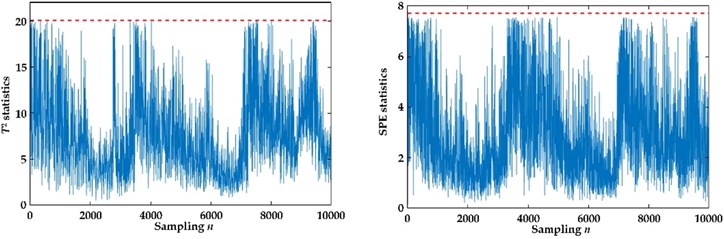
a) PCA statistical quantity test
b) WPCA statistical quantity test
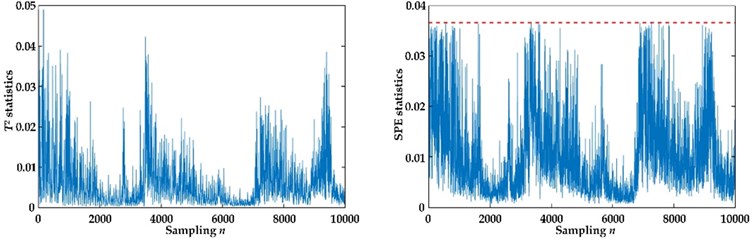
c) KPCA statistical quantity test
For the off-peak period, the sensor at L5 in the middle span was used as the research sample. The data from 00:00 am to 01:00 am on March 5th were selected for training, and the sensor data from 00:00 am on April 5th were used as the unknown state for testing; for the peak period, the sensor data from 09:00 am to 10:00 am on April 5th were selected for training, and the data from 09:00 am on May 10th were used as the unknown state. PCA, WPCA, and KPCA were performed to diagnose the sensor faults.
Using the data from March 5th 00:00 am and April 5th 09:00 am, 10,000 sets of acquired data were selected for PCA, WPCA, and KPCA training. The sensor at L5 was used as the research sample, 10,000 sets of data acquired on April 5th (00:00 am), May 10 (09:00 am), and June 15th (09:00 am) were diagnosed. Fig. 2 shows the test results of the three sets of test data from the three tests, and the dashed lines in the figure indicate the thresholds of the respective statistics. As shown in the figures, none of the statistics exceeded the threshold, which indicates that the system did not malfunction. This is consistent with the manual inspection of the bridge structure health monitoring system, which validates the proposed method.
4. Effects of different cases on diagnosis results
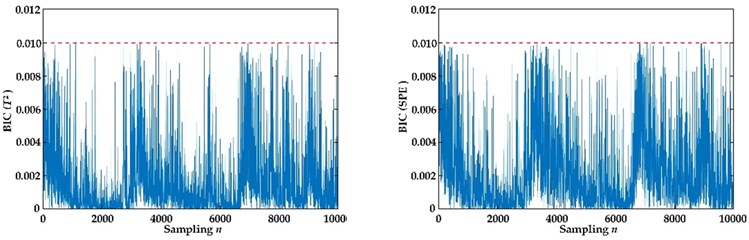
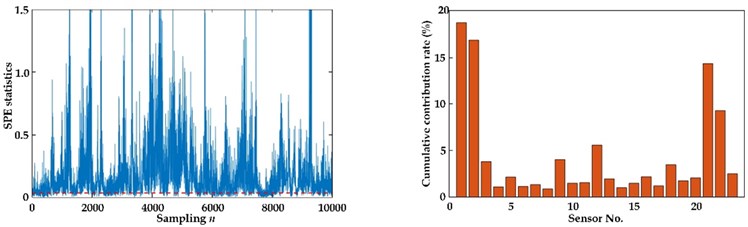
The stability of the three fault diagnosis methods for different cases were investigated. The training data at 00:00 am on March 5, which is an off-peak period, were selected to test the test data at 09:00 am on May 10, which is a peak period. The results are shown in Fig. 3.
As shown in the Fig. 3, the PCA, WPCA, and KPCA statistics exceeded the limits at numerous points, and multiple sensors were discovered to be faulty based on the cumulative contribution rate. However, the probability of multiple sensors failing simultaneously is low in practice, and the manual inspection of this bridge resulted in no sensor failure.
Fig. 3Effects of different cases on test results
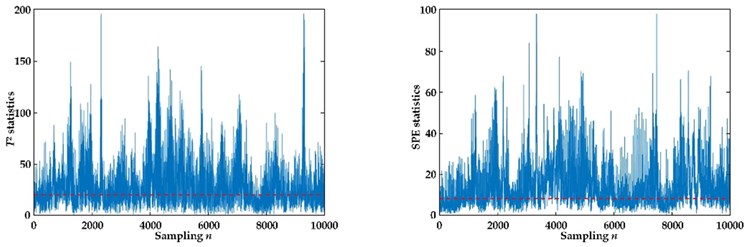
a) PCA test results
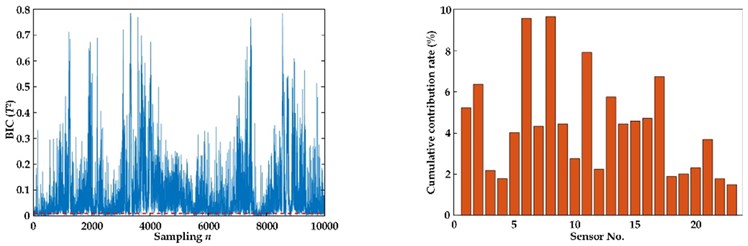
b) Test results for WPCA ()
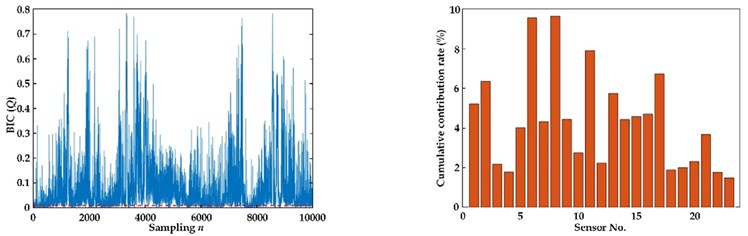
c) Test results for WPCA (Q)
d) Test results of KPCA
Therefore, it was speculated that the system cases have changed. The results above show that excessive differences in conditions between the training and test samples will deteriorate the robustness of the diagnosis method and yield misleading test results, which should be avoided in practical applications. Therefore, a time-phased approach for diagnosis is recommended. In addition, to reduce the mis-judgment caused by the difference in cases, the bridge must be monitored for a long term to obtain more data for PCA training.
5. Conclusions
In this study, three fault diagnosis methods, i.e., PCA, WPCA, and KPCA, were applied to the health monitoring system of a large-span cable-stayed bridge, and the self-diagnosis of sensor faults was realized by analyzing the measured data acquired using the bridge acceleration sensors.
The sensors were inspected at different times of the day and in different operating conditions of the bridge. The sensors were monitored during peak and off-peak traffic periods, and the results showed that the cable-stayed bridge sensors were intact and provided results that were consistent with the manual inspection results.
The off-peak training model was used to test the data samples acquired during the peak period, and the results yielded false positives. This indicates that excessive differences in work conditions between the training and test samples will deteriorate the robustness of the three diagnostic methods. Therefore, a time-phased approach is recommended for diagnosis in this study.
References
-
“Editorial Department of China Journal of Highway and Transport,” China Journal of Highway and Transport, Vol. 34, pp. 1–97, 2021.
-
L. L. Li, G. Liu, L. L. Zhang, and Q. Li, “Deep learning-based sensor fault detection using S-Long Short Term Memory Networks,” Structural Monitoring and Maintenance, Vol. 5, pp. 51–65, 2018.
-
J. L. Iu, Y. Gao, F. Y. Liao, Y. P. Luo, and W. T. Zheng, “Damage detection of a time-varying simply supported steel bridge under moving load,” Journal of Vibration, Measurement and Diagnosis, Vol. 40, pp. 12–19, 2020.
-
J. Kullaa, “Distinguishing between sensor fault, structural damage, and environmental or operational effects in structural health monitoring,” Mechanical Systems and Signal Processing, Vol. 25, No. 8, pp. 2976–2989, Nov. 2011, https://doi.org/10.1016/j.ymssp.2011.05.017
-
L. Li, L. Zhang, G. Liu, Q. Li, and X. An, “Sensor fault localization with accumulated residual contribution rate for bridge SHM,” Cluster Computing, Vol. 22, No. S4, pp. 7821–7829, Jul. 2019, https://doi.org/10.1007/s10586-017-1456-5
-
L. Li, G. Liu, L. Zhang, and Q. Li, “Sensor fault detection with generalized likelihood ratio and correlation coefficient for bridge SHM,” Journal of Sound and Vibration, Vol. 442, pp. 445–458, Mar. 2019, https://doi.org/10.1016/j.jsv.2018.10.062
-
E. P. Tao, W. H. Shen, T. L. Liu, and X. Q. Chen, “Fault diagnosis based on PCA for sensors of laboratorial wastewater treatment process,” Chemometrics and Intelligent Laboratory Systems, Vol. 128, pp. 49–55, Oct. 2013, https://doi.org/10.1016/j.chemolab.2013.07.012
-
D. Gao, C.-G. Wu, B.-K. Zhang, and X. Ma, “Method combining PCA and SDG for fault diagnosis of sensors and its application,” Journal of System Simulation, Vol. 23, No. 3, pp. 567–573, Mar. 2011.
-
J. L. Rodríguez-Garciapiña, G. Beltrán-Pérez, J. Castillo-Mixcóatl, and S. Muñoz-Aguirre, “Application of the principal components analysis technique to optical fiber sensors for acetone detection,” Optics and Laser Technology, Vol. 143, p. 107314, Nov. 2021, https://doi.org/10.1016/j.optlastec.2021.107314
-
B. Schölkopf, A. Smola, and K.-R. Müller, “Nonlinear component analysis as a kernel eigenvalue problem,” Neural Computation, Vol. 10, No. 5, pp. 1299–1319, Jul. 1998, https://doi.org/10.1162/089976698300017467
About this article

This research was supported by the China Postdoctoral Science Foundation (Grant No. 2021M690838) and Chongqing Municipal Natural Science Foundation under the Grant No. cstc2021jcyj-bsh0189.
