Abstract
As the most front-end equipment in the monitoring system, sensors are the main means of obtaining information about the response of various environments and structures, and their performance will directly affect the subsequent structural damage identification and structural safety assessment. In this study, the influence of the scale of the fault on the diagnostic effect of the proposed method was analyzed, and the results showed that the sensitive principal component analysis (SPCA) method can identify smaller-scale faults and significantly improve the fault detection capability compared with the traditional PCA method.
Highlights
- The influence of the scale of the fault on the diagnostic effect of the proposed method is analyzed.
- The SPCA is more effective in fault identification when the amplitude of the fault is higher
- Compared with the traditional PCA diagnosis method, the SPCA diagnosis method is more sensitive in identifying small-scale faults and more accurate in identifying large-scale faults, and the fault detection capability is significantly improved.
1. Introduction
PCA is able to recognize the sensor fault when the scale of the fault is large. If a smaller fault occurs, the traditional PCA does not recognize it well. This is because the principal element subspace created by PCA has the same weight as each eigenvector in the residual subspace, which may weaken the fault sensitivity, or fault detection capability. Many scholars have conducted research on the issue of the sensitivity of various primary element directions of PCA to sensor failures. Tamura and Tsujita [1] studied the relationship between fault sensitivity and the number of main axes retained in the principal element subspace, which gives the number of principal directions for maximum fault sensitivity. Jiang et al. [2] proposed a sensitive PCA that considers fault-related information when performing statistical monitoring, in other words, the main direction of fault sensitivity is selected by new criterion when collecting new monitoring data. However, neither of these methods has a theory deduction to quantify the fault sensitivity of each principal direction. Zhao and Gao [3] introduced a fault-related PCA to select more irrelevant principal directions to highlight fault sensitivity, but this approach has to use historical fault monitoring data, which is difficult to obtain in practical applications.
Therefore, the crucial question is how to theoretically quantify the fault sensitivity of PCA in each main direction from the only available monitoring data. In this study, a fault-sensitive factor is theoretically deduced to solve this problem, and then a sensitive principal component analysis (SPCA) method is proposed that can improve the fault detection capability.
2. Sensitive principal component analysis (SPCA)
Because the statistic and the square prediction error (SPE) omit information associated with faults, this omission may deteriorate the fault sensitivity. Therefore, to further improve the fault detection capability, one must consider that each principal direction of the principal component analysis (PCA) has different fault sensitivities for the same fault occurring in a particular sensor.
The measurement data are decomposed into a principal subspace and a residual subspace after principal element analysis. Each row vector in represents a measurement sample of the sensor at a specified moment, and the PCA-based statistic can be further expressed as:
where is the statistic defined in the th principal direction of the PCA:
For the PCA-based statistic, the weights in Eq. (1) are:
where implies that the first principal directions have the same effect on the fault sensitivity, whereas the last - principal directions do not affect the fault sensitivity.
Similarly, the PCA-based SPE() can be further expressed as:
where represents the residual space , and is the th principal component direction . Subsequently, the weights in Eq. (4) are:
3. The diagnostic effect of three methods when a gain fault, deviation fault, and stuck fault occurred
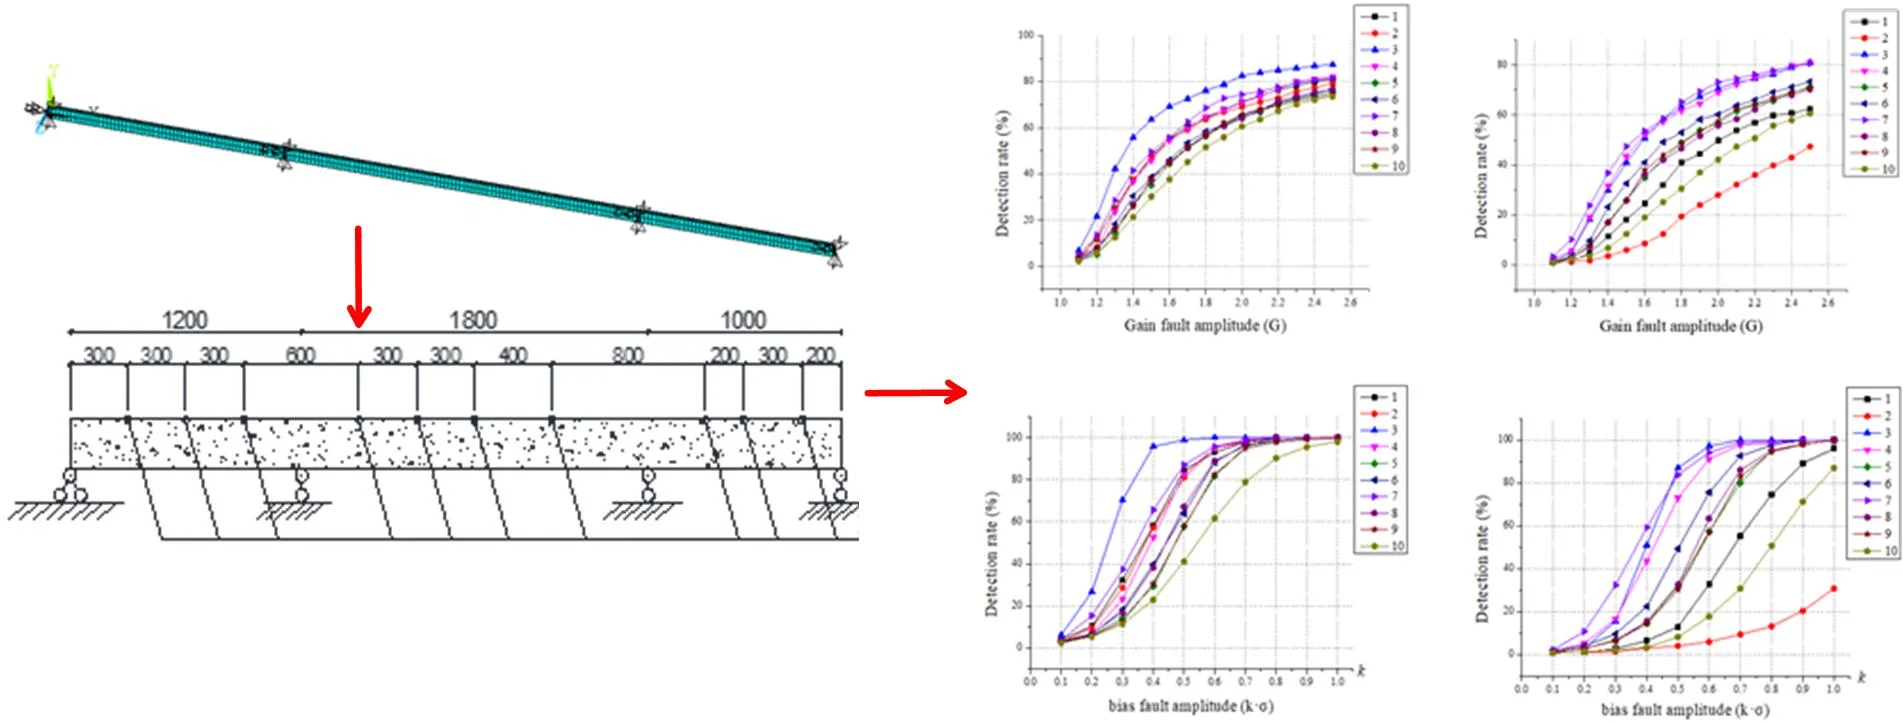
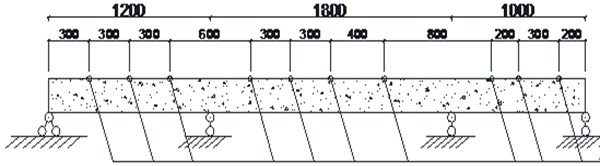
ANSYS software is used to establish a three-span continuous beam model, as shown in Fig. 1, the elastic modulus of the model 3×10¹⁰ N/m2, Poisson’s ratio 0.3 and density 2500 kg/m3. The length of the beam is 40 m, and its cross-section is a rectangle with dimensions of 0.25 m×0.6 m. The white noise ground pulsation is used as the excitation of the continuous beam and the acceleration time history response of the continuous beam is calculated using the Newmark-β method [4]. It is assumed that 10 acceleration sensors are deployed at 3 m, 6 m, 9 m, 15 m, 18 m, 21 m, 25 m, 33 m, 35 m, 38 m from the left end support, numbered 1 to 10 in order, as shown in Fig 1.
Fig. 1A Three-span continuous beam model
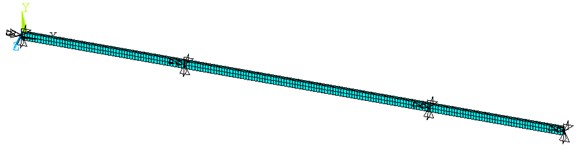
Fig. 2Sensor layout
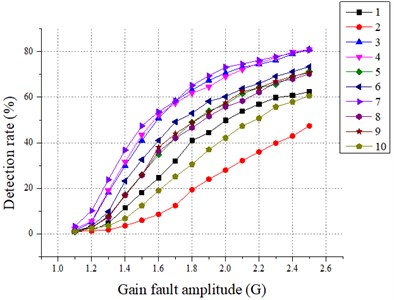
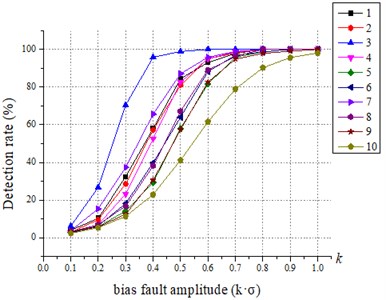
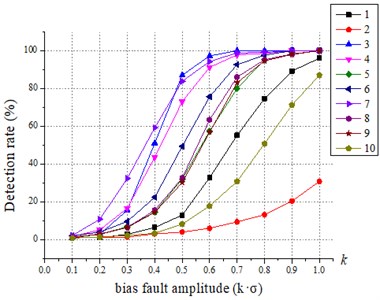
The effect of various fault scales on the detection results is discussed. For all sensors, the failure amplitude and the fault size b are adjusted to compare the recognition effect of SPCA under different fault scales, and the results are shown in Fig. 3 and Fig. 4. The 1 to 10 in the figure legend are the sensor numbers.
Fig. 3Relationship between failure amplitude (G) and SPCA test results
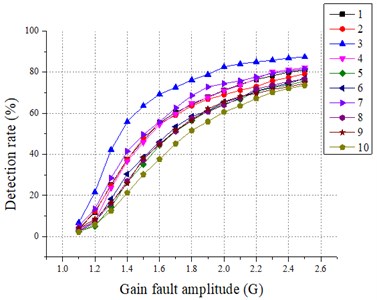
a) statistic
b) statistic
Fig. 4Relationship between fault size (b) and SPCA test results
a) statistic
b) statistic
From Fig. 3 and Fig. 4, it is easy to conclude that the SPCA is more effective in fault identification when the amplitude of the fault is higher. It is also found that the detection rate of statistic is greater than 20 % after gain fault 1.3 and greater than 15 % after bias fault > 0.3. For the statistic, the detection rate of statistic is greater than 20 % after gain fault 1.6 except for the sensor fault No. 2, and the detection rate of statistic is greater than 2 0% after bias fault > 0.6. Compared with the traditional PCA diagnosis method, the SPCA diagnosis method is more sensitive in identifying small-scale faults and more accurate in identifying large-scale faults, and the fault detection capability is significantly improved.
4. Conclusions
Numerical simulation studies have shown that the sensor fault diagnosis method based on SPCA can effectively detect and isolate bias faults and constant gain faults of sensors. The influence of the size of the fault on the diagnostic effect of the proposed method is analyzed, and the result shows that compared with the traditional PCA method, the SPCA method can identify smaller scale faults, and the fault detection capability is improved significantly.
References
-
M. Tamura and S. Tsujita, “A study on the number of principal components and sensitivity of fault detection using PCA,” Computers and Chemical Engineering, Vol. 31, No. 9, pp. 1035–1046, Sep. 2007, https://doi.org/10.1016/j.compchemeng.2006.09.004
-
Q. Jiang, X. Yan, and W. Zhao, “Fault detection and diagnosis in chemical processes using sensitive Principal Component Analysis,” Industrial and Engineering Chemistry Research, Vol. 52, No. 4, pp. 1635–1644, 2013.
-
C. Zhao and F. Gao, “Fault-relevant Principal Component Analysis (FPCA) method for multivariate statistical modeling and process monitoring,” Chemometrics and Intelligent Laboratory Systems, Vol. 133, pp. 1–16, Apr. 2014, https://doi.org/10.1016/j.chemolab.2014.01.009
-
L. S. Ge, H. Y. Pan, J. P. Zhang, and Y. M. Gong, “A rolling force transducer fault diagnostic system based on the production rule,” (in Chinese), Industrial Instrumentation and Automation, Vol. 1, pp. 12–13, 2001.
About this article

This research was supported by the China Postdoctoral Science Foundation (Grant No. 2021M690838), the Project of China Construction science and technology Group Co., Ltd (Grant No. ZJKJ-2021-4) and Chongqing Municipal Natural Science Foundation under the Grant No. cstc2021jcyj-bshX0180.
