Abstract
Convective weather is an important weather phenomenon that affects aircraft operation, and the determination and analysis of convective weather characteristic thresholds is the basis and premise for airspace availability analysis and aircraft diversion. This paper innovatively proposes a threshold analysis method for aircraft to avoid convective weather. Firstly, the historical meteorological data and the track data are adopted in spatiotemporal and synchronous fusion. Secondly, the K-means clustering algorithm is used to determine the characteristic threshold range of the aircraft to avoid convective weather. Then, combined with the random forest classification algorithm, each threshold is again classified 0-1 through machine learning to determine the best avoidance threshold for weather features. Finally, the new construction index evaluation is used to evaluate the reliability of the algorithm. According to the threshold analysis method, the radar reflectivity factor is taken as the research object to carry out an example analysis. The example shows that when the radar reflectivity value is 34 dBZ, the accuracy rate is 96.58 %, the false alarm rate is 2.45 %, and the missing alarm rate is 0.97 %, all of which are better than the decision tree method, thus verifying the reliability and practicability of the algorithm.
Highlights
- This paper innovatively integrates the track data and meteorological data in time and space to facilitate the determination of aircraft flight under the influence of weather.
- In this paper, the clustering method is proposed for the first time to divide the weather into the aircraft that can fly normally without being affected by weak convective weather, and others that cannot fly normally under the effect of the strong convection weather.
- This paper uses the random forest method in machine learning to perform 0-1 classification to determine the final weather feature threshold.
1. Introduction
In recent years, with the rapid development of our country's economy, people’s productive and life demand for air transportation has increased day by day, so the airspace resources have gradually become tight. In this case, the impact of weather is particularly prominent. Convective weather leads to an increase in the complexity of air traffic control [1], especially in the summer thunderstorm season, when a large amount of rain and thunderstorms affect the normal operation of aircraft. Analyzing and determining the threshold of convective weather characteristics is the basis and prerequisite for ensuring flight safety and improving airspace utilization efficiency.
In foreign countries, the extraction and analysis of weather characteristic factors are often combined with the functions of existing meteorological products, and the key meteorological indicators of the impact capacity of strong convective weather are listed. In 1999, Rhoda et al. conducted a preliminary study on pilots’ fly-around preference and used the National Weather Service (NWS) method to divide the radar reflectivity into 6 groups [2-4]. In 2001, the Federal Space Administration of the United States adopted a quantitative method to study the impact of weather on air traffic and obtained the Weather Impacted Traffic Index (WITI) suitable for large-scale and long-term measurement of weather on nationwide delays [5]. In 2016, Xu Qiangjun proposed a lightning nowcasting scheme using the modified echo extrapolation technique [6]. In 2017, Kistan, T. et al. pointed out that airport capacity changed according to the weather, of which the significant meteorological factors included wind direction and intensity, precipitation, visibility, dangerous clouds, and more severe disasters [7]. In China, the main research methods on the influence of weather are the prediction method of weather avoidance area, such as considering the weather movement [8], [9], delineating the avoidance zone by Graham’s method [10-12] and expanding flight restricted zone according to civil aviation regulations [13], [14]. However, the research on weather avoidance factors started in recent years. For example, in 2018, Xu Rong et al. conducted a survey on the spatial structure and capacity of the Pearl River Delta region under the impact of strong convective weather, which was based on the statistics of the reflectance values of each grid point and the degree of weather influence in various regions of the country during the forecast period. They analyzed the data of the actual flight and planned flight of the aircraft in fifteen severe weather events between March and August and obtained the climate characteristic parameters from meteorological clouds to explore the correlation between the two [15]. In 2019, Mao Yongqing et al. acquired the corresponding two-dimensional array by using GrADS software to analyze the combined reflectance data. He also used the grid tracking method to extract the contour lines from the contour map. All the isoline signals of the radar were stored in the file, and the follow-up status indication and the calculation of the dangerous weather avoidance area were carried out. Using this combined reflection amount information processing technology, the functions such as real-time processing and status indication of the combined reflection amount of meteorological and radar technology were completed. It was used as a basic thunderstorm warning product for users such as control and flow control [16]. In 2020, starting from a weather perspective, Liu Jihong selected five important weather indices that flow managers were concerned about, applied the index weights according to the actual operating conditions of the system to further enhance the adaptability of the model to different airspace structures [17].
It can be seen from the above analysis that the threshold of convective weather characteristics is the key factor affecting whether the aircraft can pass normally. However, in the actual operation process, the judgment is often made from expert experience due to insufficient research, which will cause great errors because of subjective assumptions and other shortcomings, imprecise judgment can cause flight delays or even flight accidents so the empirical value method is not suitable for comprehensive promotion. In order to solve the problem of whether the aircraft can fly normally in strong convective weather, in-depth research is still needed. Therefore, based on the fusion processing of historical meteorological data and track data, this paper constructs a feature threshold extraction method based on the combination of data analysis and machine learning, which can realize the judgment and analysis of the convective weather feature threshold that affects the operation of aircraft.
2. Methodology
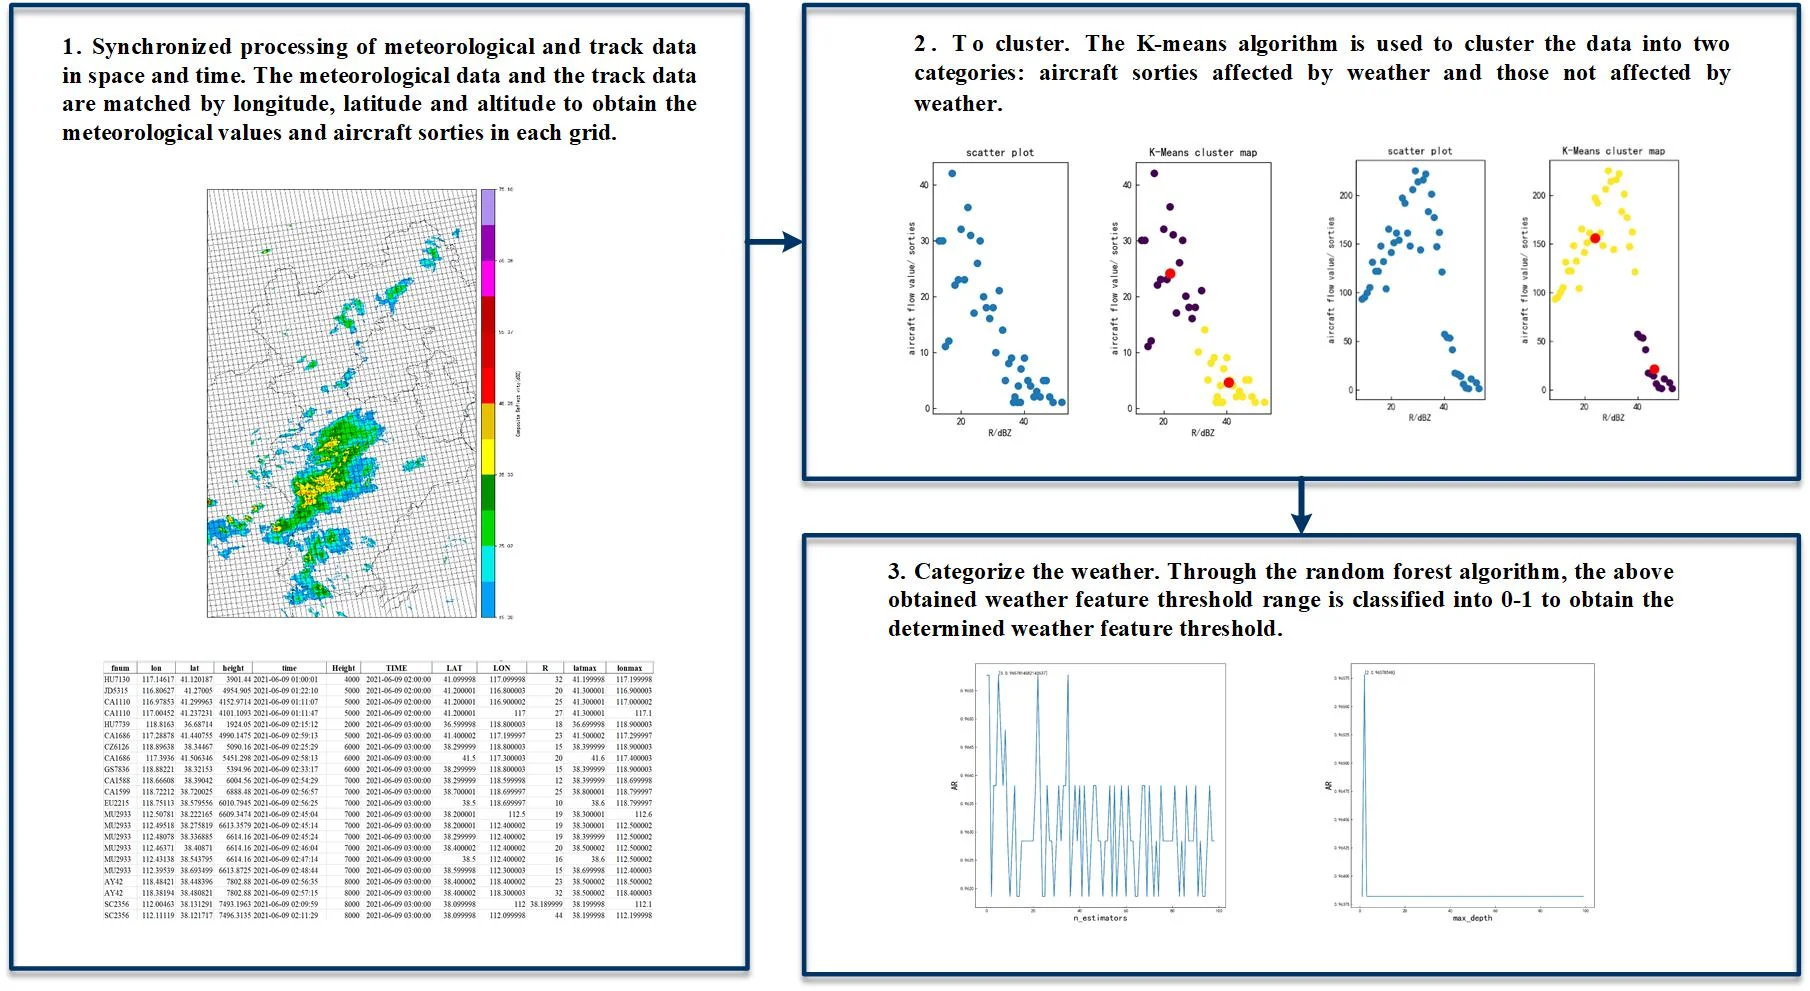
2.1. Data spatiotemporal synchronization processing method
Doppler weather radar is the main tool for detecting and warning thunderstorms and severe convective weather. It consists of radar data acquisition system (RDA), radar product generator (RPG) and primary user processor (PUP), which can provide combined reflectivity (CREF ), hail index (HI), echo top height (ET), medium cyclone (M), storm track information (STI), radar reflectivity factor (R) and other information; Track data is the fusion of radar track data and flight plan data, reflecting important parameters of target flight route, speed, and even flight purpose. Refreshed every 8 seconds, it records the flight dynamics information of takeoff, landing, and overflight flights between airport pairs, including longitude, latitude, height, time, flight number and other information.
Since the sampling frequency of weather products (the time resolution is 6 minutes, 10 minutes, 1 hour, etc.; the spatial resolution is 1°*1KM, 1°*2KM, 1°*4KM, etc.) is inconsistent with the time and spatial granularity of track data, and aircraft flight is affected by weather samples differently, it is necessary to synchronize the information of the two in time and space. This process is realized by calling toolkits such as Os, Numpy, Pandas and Basemap with the help of the python language. After virtually superimposing the two-layer grid information of weather conditions and aircraft flow on the three-dimensional map of the airspace in the same time period, refer to the definition of the Weather Impact Traffic Index (WITI) [18], use functions, such as ‘concat function’, ‘merge function’ or ‘resample function’ to re-divide the airspace into several dense cell grids, that is, each grid point (the total number of rows is , the total number of columns is ) will contain two values of convective weather radar and the number of aircraft flights information. Finally, organize the information in the raster into a dataset.
2.2. K-means algorithm threshold range determination
The K-means algorithm is a typical partition-based clustering algorithm. Since it does not require a given training set to train a model, it belongs to an unsupervised learning algorithm. Based on the original characteristics of the data, this paper removes the abnormal points caused by unarranged or little arranged aircraft in a grid under no convective weather. Then divide the data set into two categories: the aircraft that can fly normally without being affected by weak convective weather, and others that cannot fly normally under the effect of the strong convection weather. The algorithm steps are as follows:
Step 1: Randomly select 2 points from the sample set with total convective weather data each day as the initial center of each cluster in the K-means algorithm, and divide the data into the clusters closest to the two points according to the minimum distance principle of Eq. (1) to complete a division:
where, represents each sample point in the sample set, and is to describe one of the two categories.
Step 2: In the newly generated cluster, recalculate the center point of each cluster according to the algorithm of Eq. (2), and divide it again:
where, represents the center point of each cluster.
Step 3: Constantly iterate step 2 until the result of each division remains unchanged, when the function is considered to have converged. Stop iteration to get the cluster center point that the aircraft can fly normally without being affected by weak convective weather and the final cluster center in two categories where the aircraft is affected and cannot fly normally in strong convective weather.
Step 4: The threshold value of the convective weather characteristic of daily aircraft obstruction can be obtained by Eq. (3):
Step 5: Eq. (4) shows the threshold range of the convective weather characteristic for which the final aircraft is blocked:
The algorithm is simple in principle, fast in convergence, easy to implement, and has a good clustering effect. It is suitable for finding the threshold range of convective weather characteristics that affect the obstruction of aircraft and provides basic data for the best avoidance threshold in the next random forest classification algorithm.
2.3. Determination of optimal avoidance threshold based on random forest classification algorithm
The principle of random forest is to build a forest composed of many decision trees in an irregular way, and all decision trees are unrelated to each other. When a new input sample enters the forest, each decision tree in it will judge which class the sample should belong to, and the class that is selected the most will be the answer [19]. It works by generating multiple classifiers, and each decision tree in the random forest learning and making classification judgments independently to finally combine into a single prediction. Random forest is an ensemble algorithm based on the decision tree, which can effectively process a large amount of data with a high accuracy rate. The result is better than any of those from one single classification and has a better effect on determining the best avoidance threshold. The classification modelling process of the optimal avoidance threshold that affects aircraft flight under convective weather based on the random forest is shown in Fig. 1.
Fig. 1Optimal avoidance threshold modeling process based on random forest
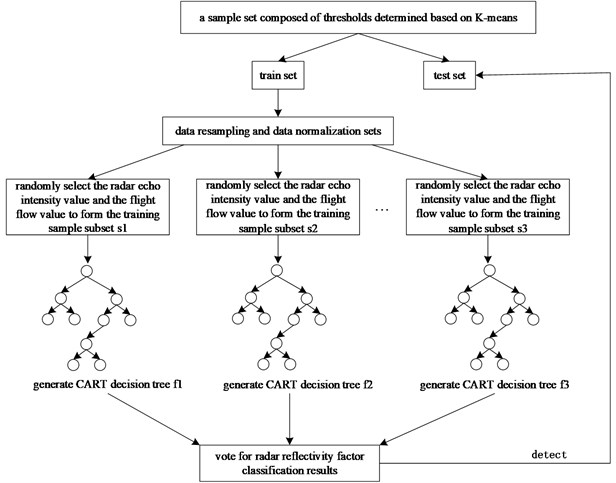
(1) Data set selection. Read the daily affected threshold range of aircraft obtained by the K-means algorithm in 2.2. and combine the 0-1 classification to construct a feature variable set of radar echo intensity value and aircraft flow value and split it into training set and testing set at the rate of 8:2.
(2) Build a CART decision tree. The Classification and Regression Tree (CART) is a binary decision tree that can handle classification problems. When using the CART algorithm for node division, it is necessary to calculate the Gini coefficient value of each feature and select the smallest one for division, and then recursively construct a decision tree to generate classification rules. This paper constructs a CART decision tree by using the Gini coefficient to select the best data segmentation features. As shown in Eq. (5), the size of the Gini coefficient is positively correlated with the error rate of the selected samples:
where, represents the probability that the selected sample belongs to categories, so the probability of this sample being wrongly classified is (), with categories in the sample set.
(3) Generation of training subsets for each decision tree. In the random forest classification model, each decision tree has a corresponding training subset. Assuming that there are decision trees, training subsets must be randomly selected from the original training set. Use a sampling method with replacement to input the training set and train a single decision tree with randomly selected samples and features with replacement; Each node selects an optimal one among features for analysis until it cannot be split, then a decision tree is trained. Repeat this step to generate trees.
(4) Build a Random Forest. After randomly selecting the training set, randomly generate subsets of features for each decision tree. Features in this subset are called random features. In this paper, the original features are randomly selected. First, z feature subsets are randomly selected from the original feature set, and the number of features in each subset is A. For decision trees, each node is split on a subset of features. The decision tree grows to the maximum in the CART method without pruning.
(5) Decision-making of Random Forest. Finally, a random forest classifier is formed by the generated multiple decision trees to classify the data, and the result is determined by the voting of all decision trees [19] [20]. Use the test set data to verify the accuracy of the model. The test sample is used as the input of the random forest, and the output of the th decision tree is:
The output of the random forest classification model is:
where represents a single decision tree classifier model; represents the classification result of a single decision tree; 0 means that the aircraft can fly normally without being affected by weak convective weather, while 1 means that the aircraft is affected and cannot fly normally in strong convective weather; represents the output of the random forest classification model; indicates the total number of decision trees that the random forest model contains.
2.4. Algorithm reliability evaluation
To evaluate the reliability of the algorithm, the Accuracy Rate (AR), the Missing Alarm Rate (MAR), and the False Alarm Rate (FAR) are defined for judgment. The Eqs. (8-10) are as follows:
where is the total number of data; is the number of correct predictions; is the number that has an impact that was predicted to have no impact; is the number that has no impact that was predicted to have impact.
3. Case analysis
3.1. Data source and preprocessing
In order to verify the effectiveness of the method, the radar reflectivity factor R, the core index that most directly reflects convective weather, is selected as the avoidance factor of important cloud characteristic parameters for research. It is the most important basis for weather classification, which reflects the flight risk index of aircraft in the airspace. The research scope is from 112° to 119° east longitude, 36° to 43° north latitude, and 1000 meters to 13000 meters altitude. The meteorological information research object is selected from the hourly-updated radar reflectivity network data with the grid resolution of 0.01° latitude and longitude and each moment corresponding to 13 altitude layers. Simultaneously, the radar track data of the same range is selected as the research object of flow information.
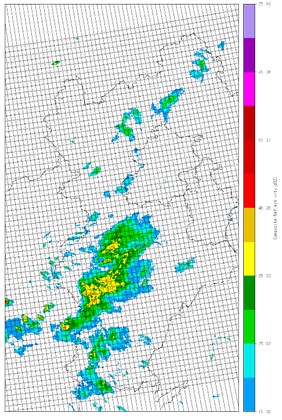
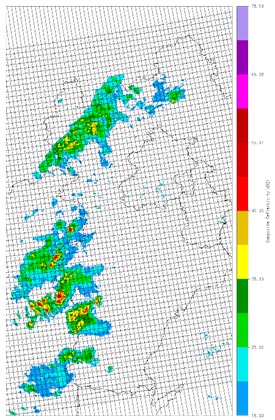
First, divide the meteorological data into 70×70 grids by 0.1 degrees, as shown in Fig. 2 and take the maximum radar reflectivity factor in each range to form the radar reflectivity factor value in the new grid range. Then, match the processed track data in line with altitude and time as standards, which are from the four-dimensional grid (longitude, latitude, altitude, time) divided by meteorological data. Finally, the information on aircraft flying over, taking off and landing in each grid will be obtained, as shown in Fig. 3. Then, to facilitate the subsequent exploration of the relationship between the flow rate and the strength of the radar reflectivity factor , the threshold value of the radar reflectivity factor is determined. Based on the fusion of meteorological and track data, make groups according to different radar reflectivity factor values and calculate the aircraft flow value that corresponds to each radar reflectivity factor while removing the outliers. Table 1 shows the groups of radar reflectivity and the corresponding aircraft flow value (sorties).
Fig. 2Schematic diagram of mesh division
By reviewing the historical radar data for each day in June and July 2021, analyzing the influence of weather on aircraft operation, selecting typical weather processes and corresponding track data, 20 typical convective weather days and 1022 influencing factors are selected as the research objects to analyze the affected characteristics of the aircraft during actual flight.
Fig. 3Fusion results of meteorological and track data (partial data)
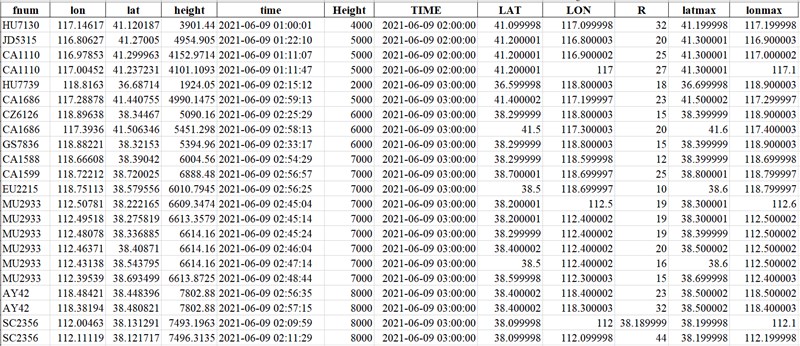
Table 1The radar reflectivity R in the grid corresponds to the aircraft flow (partial data)
Radar reflectivity (dBZ) | Aircraft flow value (sorties) |
10 | 28 |
15 | 63 |
16 | 103 |
22 | 151 |
24 | 123 |
31 | 92 |
32 | 87 |
44 | 21 |
54 | 10 |
60 | 5 |
61 | 2 |
3.2. Determination of threshold range
Based on the statistics of the aircraft flow data corresponding to the radar reflectivity factor on 20 typical convective weather days from June to July, scatter plots and cluster maps of the daily radar reflectivity factor and the flow value is drawn in Fig. 4.
Table 2 shows the daily center point clusters and convective weather feature thresholds. It can be seen from the above that when the threshold range of the radar reflectivity factor is between [30, 36], it is the center point of the two clusters of the clustering algorithm. After exceeding this threshold range, the change of the flow value tends to be stable, so the threshold range of the radar reflectivity factor can be determined to be [30, 36] dBZ.
3.3. Determination of the optimal threshold
To scientifically, objectively, and accurately find the radar reflectivity factor that can affect the operation of aircraft in convective weather, this paper uses the random forest classification method in machine learning for 0-1 classification and obtain the correlation between the radar reflectivity factor and the aircraft operation. This process was implemented by python.
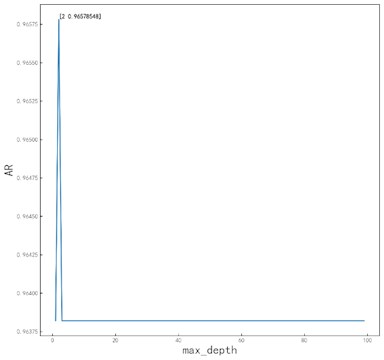
The number of generated decision trees (n_estimators) and the maximum depth of the tree (max_depth) are two relatively important parameters in the random forest model. These two parameters will greatly affect the quality of model training results, for other parameters use default values. Cross-validation is used to find optimal parameters. Under this method, first is to select the number of n_estimators that generate decision trees, and then select max_depth, the maximum depth of the tree. The selection process is shown in Fig. 5 and Fig. 6. It can be seen from these two figures that the accuracy rate is the highest when the number of decision trees is 5 and the maximum depth of the tree is 2.
Fig. 4Scatter and cluster diagrams of some radar reflectivity factors R and flow values
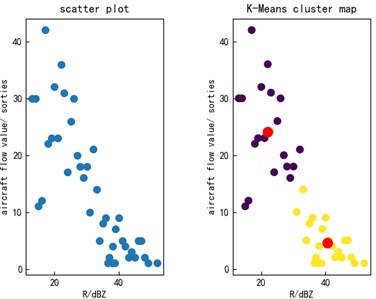
a) June 8, 2021
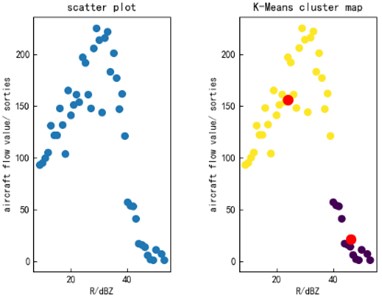
b) June 23, 2021
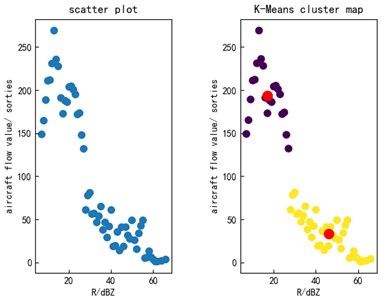
c) July 1, 2021
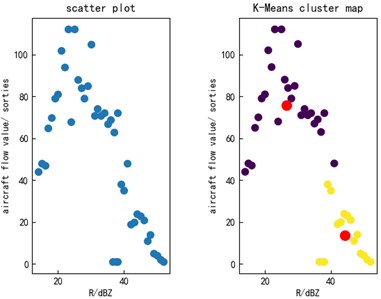
d) July 17, 2021
Table 2K-means clustering results and mean
Sample size | Center cluster 1 (dBZ) | Center cluster 2 (dBZ) | Mean (dBZ) |
1 | 22 | 41 | 31.5 |
2 | 21 | 41 | 31 |
3 | 24 | 45 | 34.5 |
4 | 18 | 42 | 30 |
5 | 24 | 46 | 35 |
6 | 21 | 44 | 32.5 |
7 | 22 | 45 | 33.5 |
8 | 24 | 44 | 34 |
9 | 17 | 46 | 31.5 |
10 | 20 | 41 | 30.5 |
11 | 23 | 45 | 34 |
12 | 22 | 47 | 34.5 |
13 | 20 | 45 | 32.5 |
14 | 19 | 41 | 30 |
15 | 22 | 44 | 33 |
16 | 29 | 38 | 33.5 |
17 | 23 | 46 | 34.5 |
18 | 26 | 46 | 36 |
19 | 23 | 37 | 30 |
20 | 27 | 44 | 35.5 |
Fig. 5Decision tree quantity selection process
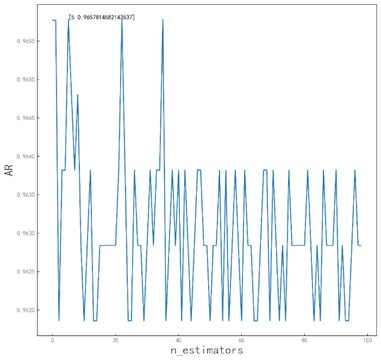
Fig. 6The maximum depth selection process of the tree
For the more accurate determination of the optimal avoidance threshold of the radar reflectivity factor, this paper uses the above model to take 7 dBZ radar reflectivity (the minimum radar reflectivity factor value after removing abnormal points from the original data) as the initial threshold value for the existing data, in which the scope ends at 66 dBZ at 1 dBZ intervals. Calculate the corresponding random forest classification results under different radar reflectivity factors , and the results are shown in Table 3.
Seen in Table 3, while verifying the above model, the classification result changes at the threshold of 34 dBZ. That is, when the avoidance threshold exceeds 34 dBZ, the aircraft cannot fly normally due to the impact of strong convective weather. Therefore, 34 dBZ is defined as the best avoidance threshold that affects the flight of the aircraft. This is similar to the conclusion made in the classification of convective weather characteristics in our country, saying “it is defined as strong convective weather when the radar reflectivity is greater than or equal to 35 dBZ, in which the aircraft needs to avoid flying”.
Table 3Random forest classification results
Threshold range (dBZ) | Classification result | Accuracy |
7-33 | 0 | 96.58 % |
34-66 | 1 |
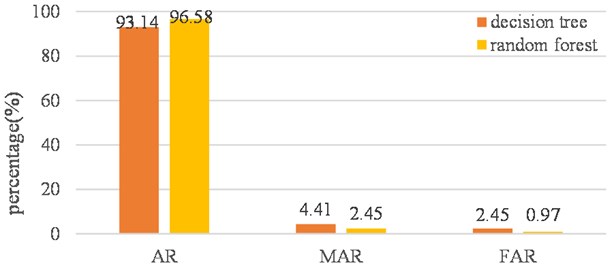
Fig. 7Comparison between decision tree and random forest algorithm
3.4. Inspection and evaluation of classification algorithms
To verify the advantages and disadvantages of the algorithm, the author compares this algorithm with the decision tree algorithm. Fig. 7 shows the compared results of the two algorithms, where the correct rate of the random forest algorithm is 3.44 % higher than that of the decision tree. The false alarm rate is 2.45 %, which is reduced by 1.96 %, and the missing alarm rate comes as low as 0.97 %, reduced by 1.48 % in comparison. In summary, the classification prediction model based on random forest can distinguish whether the radar reflectivity factor has an impact on the aircraft operation, and can prove the validity of the model, thus can be applied and prompted in the aviation business.
4. Conclusions
In this paper, a new method for determining the threshold of aircraft avoidance convective weather features based on the combination of the K-means clustering algorithm and random forest classification algorithm is proposed for the first time. The method uses python language to filter, reorganize, and fuse historical meteorological data and track data, segment the convective weather by the K-means algorithm, and then find the range of the avoidance threshold affecting the operation of the aircraft in the convective weather. In the next step, the random forest classification method is utilized to create a correlation model between aircraft flight and convective weather avoidance factors, and also to obtain the optimal avoidance threshold. Finally, the model is verified by the accuracy rate, false alarm rate and missing alarm rate. Through the analysis and research of a large amount of data combined with machine learning methods, accurate and reliable aircraft avoidance thresholds in strong convective weather are obtained. The results show that this paper has certain application potential, which provides a theoretical basis for the safety analysis of aircraft in convective weather, the effective determination of avoidance thresholds and the formulation of reasonable flight plans. It can also provide a reference for aircraft diversion and airspace capacity assessment.
References
-
“Air Traffic Management: Doc 4444,” International Civil Aviation Organization, Montreal, Quebec, Canada: ICAO, 2007.
-
D. Rhoda and M. Pawlak, “Assessment of thunderstorm penetrations and deviations by commercial aircraft in the terminal area,” Project Report NASA – A/2, MIT Lincoln Laboratory, 1999.
-
Dale A. Rhoda and Margita L. Pawlak, “The thunderstorm penetration/deviation decision in the terminal area,” in 8th Conference on Aviation, Range, and Aerospace Meteorology, pp. 308–312, 1999.
-
Dale A. Rhoda, Elizabeth A. Kocab, and Margo L. Pawlak, “Aircraft encounters with thunderstorms in enroute vs. terminal airspace above Memphis, Tennessee,” in International Congress Series, 2003.
-
M. Callaham et al., “Assessing NAS performance: normalizing for the effects of weather,” in 4th USA/Europe Air Traffic Management R&D Symposium, 2001.
-
Q. J. Xu, “Methods of lightning nowcasting based on radar echo extrapolation technology,” Meteorological and Environmental Research, Vol. 7, No. 5, pp. 46–49, 2016.
-
T. Kistan, A. Gardi, R. Sabatini, S. Ramasamy, and E. Batuwangala, “An evolutionary outlook of air traffic flow management techniques,” Progress in Aerospace Sciences, Vol. 88, No. 6, pp. 15–42, Jan. 2017, https://doi.org/10.1016/j.paerosci.2016.10.001
-
K. Song, “Preliminary study on air traffic flow management and navigation strategy,” M.A. Thesis, Nanjing University of Aeronautics and Astronautics, Nanjing, Jiangsu Province, China, 2002.
-
K. J. Chen and L. L. Chen, “Demarcation and forecasting of restricted areas for flight in hazardous weather,” (in Chinese), Journal of Nanjing University of Aeronautics and Astronautics, Vol. 19, No. 4, pp. 59–63, 2017.
-
X. Li, “Research on the planning of aircraft diversion routes under dangerous flight weather,” M.A. Thesis, Nanjing University of Aeronautics and Astronautics, Nanjing, Jiangsu Province, China, 2009.
-
C. S. Xie and Q. Li, “Hazardous weather affects the designation and assessment of flight areas on the route,” (in Chinese), Chinese Journal of Safety Science, Vol. 20, No. 10, pp. 47–52, 2010.
-
C. Sun et al., “Flight restriction zoning method based on coordinate sorting Graham-scan,” (in Chinese), Command Information Systems and Technology, Vol. 11, No. 5, pp. 40–44, 2020.
-
X. Jiang, “Research on the modification of dynamic aircraft in dangerous weather,” M.A. Thesis, Nanjing University of Aeronautics and Astronautics, Nanjing, Jiangsu Province, China, 2016.
-
Z. H. Wei, “Research on dynamic capacity assessment and diversion method of terminal area under dangerous weather,” M.A. Thesis, Civil Aviation University of China, Tianjin, China, 2016.
-
R. Xu et al., “A preliminary study on the effect of convective weather on airspace capacity in the Pearl River Delta region,” (in Chinese), Air Freight Business, Vol. 4, pp. 14–19, 2019.
-
Y. Q. Mao, Y. B. Ding, and X. F. Chen, “Thunderstorm services and assisted decision-making technologies based on combined reflectance information,” (in Chinese), Command Information Systems and Technology, Vol. 10, No. 6, pp. 40–44, 2020.
-
J. H. Liu, “Evaluation model and method of thunderstorm impact on airspace capacity,” (in Chinese), Civil Aircraft Design and Research, No. 4, pp. 85–91, 2020.
-
Callaham Mb et al., “Assessing NAS performance: normalizing for the effects of weather,” in Proceedings of the USA/FAA Air Traffic Management R&D Seminar, 2001.
-
P. O. Gislason, J. A. Benediktsson, and J. R. Sveinsson, “Random forests for land cover classification,” Pattern Recognition Letters, Vol. 27, No. 4, pp. 294–300, Mar. 2006, https://doi.org/10.1016/j.patrec.2005.08.011
-
Y. Wang and R. G. Wang, “Classification of compact reservoirs based on random forests: A case study of the eastern box 8 section of Yan an gas field,” (in Chinese), Journal of Xi’an Shi you University, Vol. 36, No. 6, pp. 1–8, 2021.
-
S. Q. Dou et al., “High-resolution image classification and land-use change detection based on random forests,” (in Chinese), Radio Engineering, Vol. 51, No. 9, pp. 901–908, 2021.
About this article

This research was supported by Science and Technology Project of North China Regional Air Traffic Management Bureau CAAC, (No. 201904; 202002) and 2020 Civil Aviation Safety Ability Building Funding Project (202072).
