Abstract
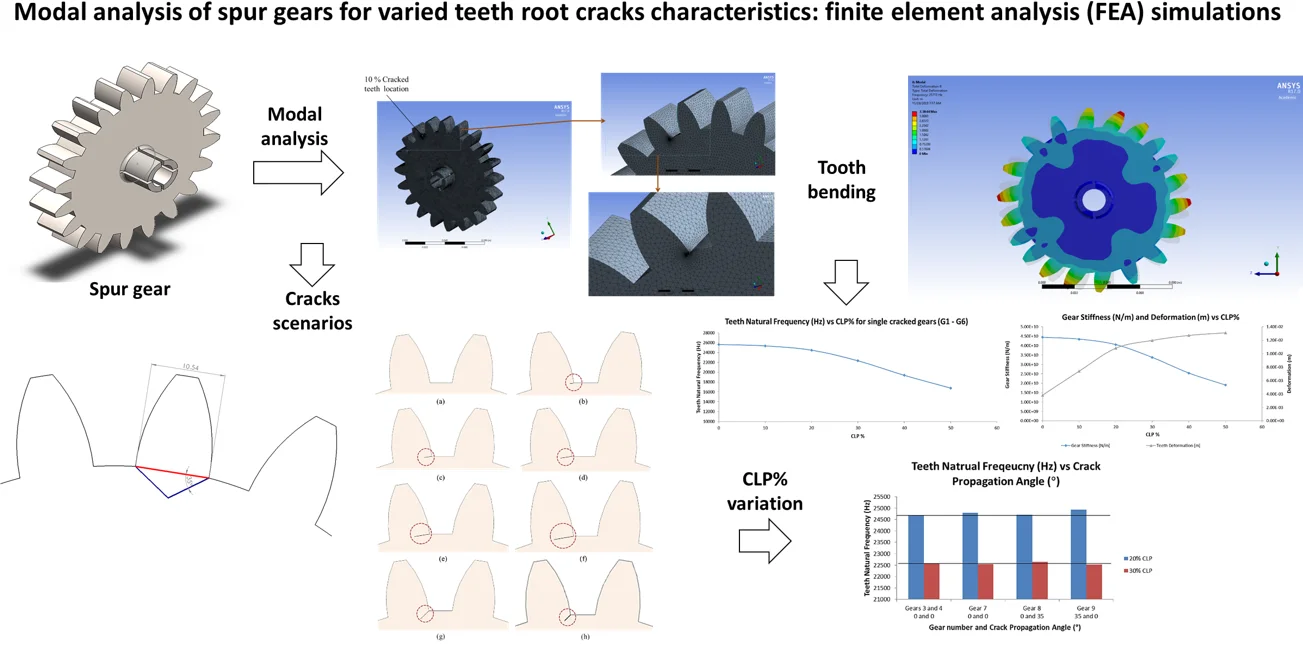
Gear failure is considered the main alarming and undesirable event in gearboxes. Usually, cracks happen by fatigue caused due to cyclic loading. Fatigue stress is focused on the teeth root because of the small tooth fillet radius. This causes progressive damage to gear teeth which causes teeth failure, and hence, a damaged gear. This work shows a numerical framework to identify and quantify cracks' existence at the teeth root of spur gears. The problem is numerically analysed through finite element-based simulation with ANSYS by conducting a modal analysis. There are nine cases of gears with different cracks on their tooth; these cracks are varied by their number (single or multiple), Crack Length Percentage (CLP %), and location. The FEA is used to simulate all nine cases to predict the bending natural frequency of teeth and to investigate the effects of the variation of the crack by looking at the natural frequency of the teeth bending as well as the deformation level. Results revealed that the teeth bending natural frequency decreases as the CLP% increases. In addition, the gear stiffness is calculated based on the natural frequency and gear’s mass and it is indicated that the stiffness decreases as the CLP% increases, while the deformation level increase with CLP%.
Highlights
- This work shows a numerical framework to identify and quantify cracks' existence at the teeth root of spur gears. The problem is numerically analysed through finite element-based simulation with ANSYS by conducting a modal analysis.
- There are nine cases of gears with different cracks on their tooth; these cracks are varied by their number (single or multiple), Crack Length Percentage (CLP %), and location.
- The FEA is used to simulate all nine cases to predict the bending natural frequency of teeth and to investigate the effects of the variation of the crack by looking at the natural frequency the teeth bending as well as the deformation level.
- The bending natural frequency decreases as the CLP% increases, and this can be explained by the change in the stiffness of the gear. Results showed that the stiffness decreases as the CLP% increases. On the other hand, the deformation increases with the CLP%.
- Results showed that there is a small increase in the natural frequency of a cracked tooth if the crack is initiated through the rim.
1. Introduction
Gears are toothed mechanical components that are used to transmit power or motion by meshing without slippage [1]. Gears can also change torque through the mechanical advantage of gear (gear ratio). They can be used with different orientations of shafts, such as parallel, nonparallel, perpendicular, intersecting, and perpendicular and nonintersecting [2]. Early detection and determination of gear cracks are essential for avoiding all these problems and predicting failure time which can be useful for some biomedical application [3]. Approximately 90 % of gear damage is caused by fatigue damage to teeth and their forced fracture, according to [4]. It is tooth bending fatigue that causes the most frequent fatigue breakdowns in gearing [5]. It is common for gear-tooth fractures to begin at the root fillet of the cantilever beam because this is its weakest point [6]. Cracks propagate either towards the teeth's feet or inside their rims after they are initiated.
There have been many prior attempts to identify cracks in gears. The work by [7] produced a FORTRAN code linked to a finite element (FE) software and LEFM approach. A gear section with three successive teeth, featuring a thin meshing and a crack at a tooth foot, was created spontaneously by the code. However, in order to assess the stress intensity component necessary for foretelling fracture propagation, complex computations were required. [8] applied the FE approach for a gearbox and compared the results to the results of the trials. By employing fracture mechanics and measuring the stress intensity components, which were determined using the virtual crack extension approach, numerical crack prediction was made possible. Regarding the growing direction of the cracks, there was a significant deal of consensus. In order to assess the precision of the stress intensity factor, [9] created FE and Weight function approaches, which aided in the precision of the crack development prediction. [10] examined the crack propagation path for gear pairs with various contact ratios, and the study created a 2-D finite element approach based on the linear elastic fracture mechanics’ concept. The 2D dimensional static analysis contains four finite element models of three consecutive teeth of a gear section with varying backup ratios. This effective approach is based on pseudo evolutionary structural optimization (ESO) [11].
In this article, a numerical modal analysis investigation for teeth cracks of spur gears is conducted using the Finite Element Analysis (FEA). There are nine cases of spur gears with different cracks on their tooth: the number of cracks, CPL%, and location. Modal analysis is utilized to simulate all nine cases to predict the bending natural frequency of teeth and the deformation; to investigate the effect of different teeth root cracks characteristics on the dynamic response of the gear.
This paper is outlined as follows: Section 1 introduces the scope of work, and brief literature of previous studies is reported. Section 2 discusses the workflow and methodology starting by showing the spur gears specifications. Then, the crack configurations and scenarios are presented, and the spur gear model is shown. Section 3 presents all results for the modal analysis for single and multiple cracked gears. Finally, Section 4 concludes the work done by summarizing it and mentioning the remarks of this article, followed by some recommendations for future work.
2. FEA framework and methods
2.1. Gears modelling and cracks scenarios
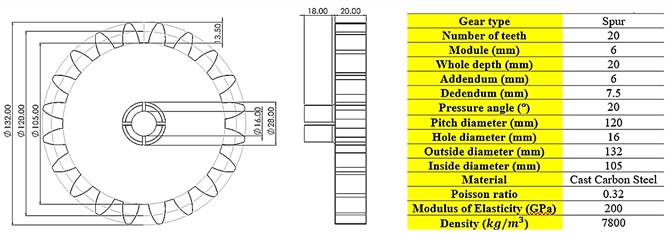
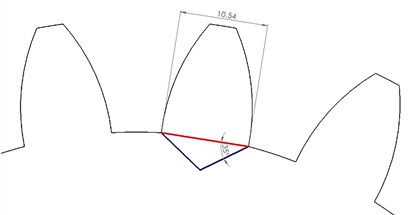
There is a total of nine gears which are to be studied. One healthy gear and the other eight gears have different Crack Length Percentages (CLP%), locations as well as number of cracks. The material of the gear is Cast Carbon Steel. Spur gear specifications, dimensions and material properties can be depicted in Fig. 1(a). As for the crack’s scenarios for each gear, assuming that CL is the length of the crack and PL is the total length of the crack path shown as blue and red lines as in Fig. 1(b). There are mainly two paths; the 1st path is marked in red by which the crack path is along with the teeth. The 2nd path marked in blue shows a 35° angle crack path along the rim of the gear. Hence, the crack length percentage (CLP%) can be developed as:
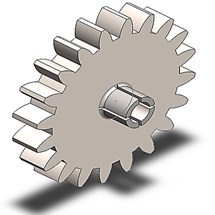
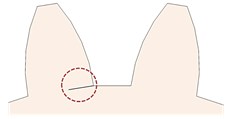
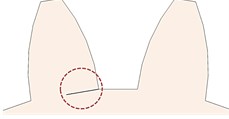
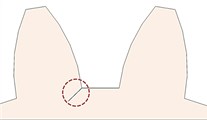
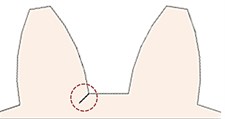
In this study, the CLP% is considered as changing from 0 % to 50 %. Various crack cases were considered, starting from 0 % to 50 %. However, there are a total of nine cases (gears) to be studied. All gears are numbered from 1 to 9. The numbering details to identify the gears based on their crack’s location, and the number by which there are gears with single cracks or multiple cracks. The crack thickness for all cases is 0.2 mm. There are two types of crack propagation paths in this study; cracks through the teeth themselves and cracks through the rim which makes an angle with the teeth crack path. Table 1 summarizes all the different crack scenarios on each gear and the crack characteristics. Eq. (1) is used to calculate the CLP% and hence, the crack length is calculated. The cracks were sketched on one face of the tooth (on the propagation path either on the tooth or the rim) and then a ‘3 points arc’ is sketched based on the crack length. Then, using the ‘extruded cut’ feature on SolidWorks, the cracks were initiated and modelled. SolidWorks® software is used to model all gears and cracks. SolidWorks allows making the sketches, building 3D models from the sketches, modifying the parts to fit in assemblies, and then performing various engineering analyses on your models. Fig. 1(c) shows the 3D CAD drawing of the gear, with no cracks in it (healthy). Fig. 2 shows the CLP% for all the possible cases whether the crack is through the tooth or the rim.
Fig. 1a) Spur gear specifications, dimensions, and materials, b) crack propagation scenarios formation, and c) 3D CAD model for spur gear used in this study
a)
b)
c)
Table 1Gears, CLP% scenarios, location, and specifications
Gear number | Case | Number of cracks | CLP (%) | Crack propagation angle (°) | Crack location | Crack length (mm) |
G1 | Healthy | 0 | 0 | 0 | On 1 tooth | 0 |
G2 | Cracked (single) | 1 | 10 | 0 | On 1 tooth | 1.054 |
G3 | Cracked (single) | 1 | 20 | 0 | On 1 tooth | 2.108 |
G4 | Cracked (single) | 1 | 30 | 0 | On 1 tooth | 3.162 |
G5 | Cracked (single) | 1 | 40 | 0 | On 1 tooth | 4.216 |
G6 | Cracked (single) | 1 | 50 | 0 | On 1 tooth | 5.27 |
G7 | Cracked (multiple) | 2 | 20 and 30 | 0 and 0 | On 2 teeth separated by 180° | 2.108 and 3.162 |
G8 | Cracked (multiple) | 2 | 20 and 30 | 0 and 35 | On 2 teeth separated by 90° | 2.108 and 3.162 |
G9 | Cracked (multiple) | 2 | 20 and 30 | 35 and 0 | On 2 consecutive teeth | 2.108 and 3.162 |
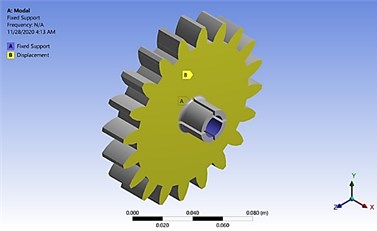
2.2. Boundary conditions
The boundary conditions of this study are aiming to capture the natural frequency at which the teeth of each gear teeth are being bent. To investigate the required mode of vibration, which is the mode by which the gear teeth bend, the hole of the gear is being fixed, and one surface of the gear is fixed in the normal direction (-axis in this case). This is to prevent the gear from showing the lateral mode of vibration which is not desired in this work. In addition, one surface only is being fixed to give flexibility to the gear teeth to bend around the -axis. The boundary conditions for this study for ANSYS are summarized in Table 2. Also, Fig. 3(a) shows the boundary conditions for all simulations of the nine gears. The first ten modes of vibration will be presented. However, the mode in which we are interested in the mode of bending of the teeth.
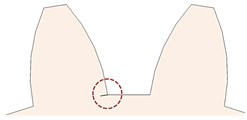
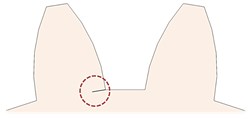
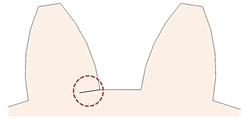
Fig. 2CLP% a) 0 %, b) 10 %, c) 20 %, d) 30 %, e) 40 %, f) 50 %, g) 30 % through the rim, and h) 20 % through the rim
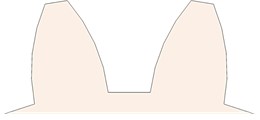
a)
b)
c)
d)
e)
f)
g)
h)
Table 2Boundary conditions for the gear.
Software | Boundary Conditions | Details | Directions | # of modes of vibration |
ANSYS | Fixed support | Gear inner hole | No rotation around the x-axis | 10 |
Displacement | One face of the gear | Free displacement on the y and z axis 0 displacement on the x-axis |
Fig. 3a) Boundary conditions for the frequency study, and b) meshing for the cracked tooth using mesh sizing
a)
b)
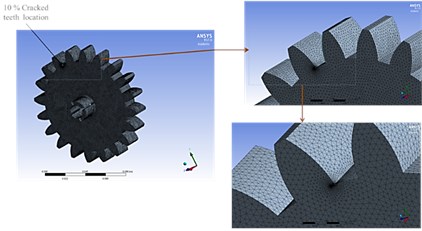
2.3. Meshing properties
Meshing is an integral part of the computer-aided engineering simulation process [12, 13]. An unstructured mesh is used; a grid of tetrahedral cells is generated. The sizing properties of the mesh are fine for the relevance centre, the smoothening is high while the transition is slow to guarantee a better meshing. The curvature normal angle used is different for each case. For the cracked gears, and since the crack area and the location at which the force is applied are tiny regions, the mesh density at these regions was increased using the ‘sizing’ method. A program-controlled mesh is used for curves and edges. The maximum and minimum element size is 0.05 mm and 0.005 mm, respectively. The size function is curvature, with a tetrahedral element type. Relevance and span angle centre are fine. Fig. 3(b) shows the meshing of the cracks for the case of 10 % (G1).
3. Results and discussion
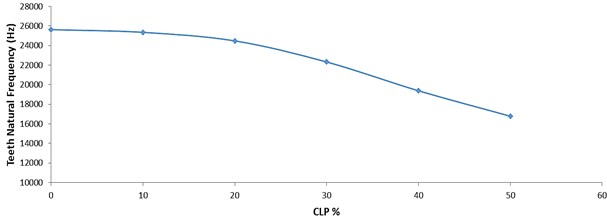
3.1. Teeth bending mode natural frequency for single cracked gears
The 1st ten modes of vibration are listed and the mode responsible for in-plane bending deformation is plotted. This mode shows the bending of the teeth of the gear. The teeth bending decreases when the CLP% increases. Fig. 4 shows the teeth bending natural frequency with respect to the CLP%, as the CLP% increases, the natural frequency of that mode decreases. The natural frequency of a healthy tooth (G1) is 25632 Hz and it dropped to 16779 Hz (G6). This can be explained by the stiffness variation of the teeth, and the crack length is responsible for the removal of more material from the gear teeth. This can influence two main parameters, stiffness, and mass. However, the mass cut is negligible because the crack thickness is 0.2 mm which is very small. Therefore, the decrease in the natural frequency is caused by the change in the stiffness of the gear tooth.
Fig. 4Single cracked gears teeth bending natural frequency with respect to the CLP %
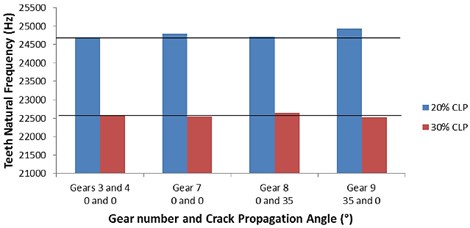
3.2. Teeth bending mode natural frequency for multiple cracked gears
For the multiple cracked gears, G7 to G9 are gears with multiple cracks on their teeth (2 cracks) varied by their location, CLP%, crack propagation path (through the teeth and the rim), and their locations. These gears consist of 20 % CLP% and 30 % CLP%, G7 consists of two cracks which are separated by a 180° angle, G8 consists of a 90° separation angle between the two cracks, and G9 consists of two consecutive cracks. The tooth bending natural frequency of the teeth cracks for G3 (20 %) and G4 (30 %) are 24483 Hz and 22325 Hz, respectively. These cracks are propagated through the tooth itself where no angle propagation is presented. For 20 % CLP, G7 and G8 show approximately identical results as the crack is the same (through the tooth) with values of 24675 Hz and 24675 Hz, respectively. However, for G9, the natural frequency slightly increased to 24499 Hz, which shows a 2.1 % increase. This can be explained by the fact that the tooth which is cracked through the rim is harder to be fractured, and its natural frequency is increased slightly. Similarly, for 30 % CLP%, G8 which consists of one cracked tooth propagated through the rim, showed a slight increase in its natural frequency (22394 Hz) compared to G4 (22325 Hz), which also can indicate that the crack propagation through the rim will have a higher natural frequency.
Fig. 5 shows a graphical representation (bar chart) of G7-G9, where the effect of the crack propagation angle effect is to be investigated. If G3 and G4 are the references for this comparison, two horizontal lines are constructed on the figure. The blue bar indicates the tooth bending natural frequency of the 20 % CLP% cracks whereas the green bar shows the 30 % CLP% cracks for G3, G4, G7, G8, and G9. The x-axis clearly states the gear number as well as the angle whether is a propagation angle or not. For G9, the natural frequency of the 20 % cracked tooth is slightly higher than the reference gear (G3). Similarly, the 30 % CLP% crack of G8 shows a slight increase to the reference (G4).
Fig. 5The effect of the crack propagation angle effect (bar chart)
3.3. Deformation and gear stiffness analysis for single cracked gears
The bending natural frequency is obtained for each case; some calculations can be made to identify the stiffness of each gear. For this analysis, gears with a single crack are to be considered (G1 to G6). In addition, since the mass is constant (1.711 kg) for all gears as there is no effect of the crack on the gear’s masses, the stiffness can be calculated using the correlations below:
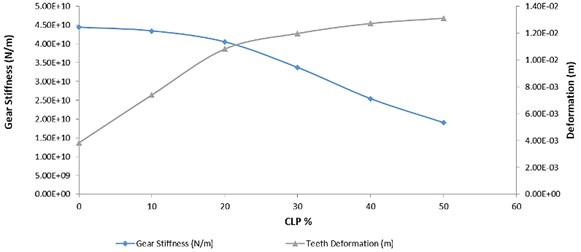
where is the natural frequency (rad/s), is the stiffness (N/m), and is the mass (kg). The deformation results are obtained from the plot of the mode of vibration of the tooth bending. The maximum deformation was considered and obtained for each case. Fig. 6 shows the stiffness and deformation for all single cracked gears. It can be clearly seen that the stiffness decreases as the CLP% increases. When there is no crack presented (G1), the gear stiffness is 4.54E+10 N/m. However, when the CLP% is increased to 50 %, the stiffness significantly decreased to 1.84E+10 N/m. This is due to the decrease of the natural frequency as they are directly correlated to each other. Inversely, the deformation increases as the CLP% increases. This is due to the increase of the crack length on the tooth which makes it easier to be fractured.
Fig. 6Stiffness and deformation vs CLP% for all single cracked gears
4. Conclusions
This work has studied the cracks of the spur gear for different crack configurations using modal analysis implemented by FEA. Firstly, the FEA was performed on nine gears with different cracks scenarios in terms of CLP%, location and number of cracks. All gears were modelled using SolidWorks software and modal analysis is carried out by ANSYS. These simulation studies aim to find the teeth bending mode natural frequency of the cracked gears as well as the healthy gear. Cracks scenarios are discussed based on the CLP% calculations, and illustration of the different cases is mentioned. The boundary conditions for the study are fixation of the gear surfaces for the face in a normal direction while allowing movement in other directions, and the fixation of the gear inner hole. This is to guarantee the bending of the teeth. Controlled mesh near the crack area is done to ensure higher accuracy of the modelling scheme, and meshing statistics are obtained. The following conclusions and remarks are obtained:
1. The bending natural frequency decreases as the CLP% increases, and this can be explained by the change in the stiffness of the gear.
2. The mass removal by the crack is negligible as the crack thickness is 0.2 mm, and the mass is constant for all ceases.
3. The FEA was used also to calculate the stiffness and the deformation of each gear. Results showed that the stiffness decreases as the CLP% increases. On the other hand, the deformation increases with the CLP%.
4. Results showed that there is a small increase in the natural frequency of a cracked tooth if the crack is initiated through the rim.
This analysis can be the ground for extended works, this effort can be improved by studying different modes of vibration that act on the gear’s teeth such as torsional and longitudinal modes. Moreover, different cracks modelling can be studied by modelling curved cracks instead of a straight line through the root and the rim, which might capture the real-life gears’ teeth cracking and failure.
References
-
S. Jia and I. Howard, “Comparison of localised spalling and crack damage from dynamic modelling of spur gear vibrations,” Mechanical Systems and Signal Processing, Vol. 20, No. 2, pp. 332–349, Feb. 2006, https://doi.org/10.1016/j.ymssp.2005.02.009
-
T. M. I. Syam and A. G. A. Muthalif, “Magnetorheological elastomer based torsional vibration isolator for application in a prototype drilling shaft,” Journal of Low Frequency Noise, Vibration and Active Control, Vol. 41, No. 2, pp. 676–700, Jun. 2022, https://doi.org/10.1177/14613484211044627
-
A. G. A. Muthalif, A. M. Zulkefli, D. N. H. Nordin, and T. M. I. Syam, “Intelligent glove for suppression of resting tremor in Parkinson’s disease,” Vibroengineering Procedia, Vol. 29, pp. 176–181, Nov. 2019, https://doi.org/10.21595/vp.2019.21078
-
Y. Pandya and A. Parey, “Simulation of crack propagation in spur gear tooth for different gear parameter and its influence on mesh stiffness,” Engineering Failure Analysis, Vol. 30, pp. 124–137, Jun. 2013, https://doi.org/10.1016/j.engfailanal.2013.01.011
-
T. Syam, Y. Badri, O. Abdallah, S. Sassi, J. Renno, and O. D. Mohammed, “Towards a simplified technique for crack recognition in gearing systems,” Comptes Rendus. Mécanique, Vol. 350, No. G3, pp. 477–494, Sep. 2022, https://doi.org/10.5802/crmeca.128
-
S. Sirichai, “Torsional properties of spur gears in mesh using nonlinear finite element analysis,” Ph.D. thesis, Curtin University of Technology, 2022.
-
S. Li, “Finite element analyses for contact strength and bending strength of a pair of spur gears with machining errors, assembly errors and tooth modifications,” Mechanism and Machine Theory, Vol. 42, No. 1, pp. 88–114, Jan. 2007, https://doi.org/10.1016/j.mechmachtheory.2006.01.009
-
H. Ma, J. Yang, R. Song, S. Zhang, and B. Wen, “Effects of tip relief on vibration responses of a geared rotor system,” Proceedings of the Institution of Mechanical Engineers, Part C: Journal of Mechanical Engineering Science, Vol. 228, No. 7, pp. 1132–1154, May 2014, https://doi.org/10.1177/0954406213500615
-
F. Chaari, T. Fakhfakh, and M. Haddar, “Analytical modelling of spur gear tooth crack and influence on gearmesh stiffness,” European Journal of Mechanics – A/Solids, Vol. 28, No. 3, pp. 461–468, May 2009, https://doi.org/10.1016/j.euromechsol.2008.07.007
-
S. Wu, M. J. Zuo, and A. Parey, “Simulation of spur gear dynamics and estimation of fault growth,” Journal of Sound and Vibration, Vol. 317, No. 3-5, pp. 608–624, Nov. 2008, https://doi.org/10.1016/j.jsv.2008.03.038
-
H. Dong, C. Zhang, X. Wang, and D. Wang, “A precise FE model of a spur gear set considering eccentric error for quasi-static analysis,” Lecture Notes in Electrical Engineering, Vol. 408, pp. 1263–1274, 2017, https://doi.org/10.1007/978-981-10-2875-5_101/cover
-
A. G. A. Muthalif, T. M. I. Syam, A. M. H. Salem, and A. A. A. Hejazi, “3D numerical modelling and analysis of a magnetorheological elastomer (MRE),” Journal of Vibroengineering, Vol. 22, No. 5, pp. 1251–1265, Aug. 2020, https://doi.org/10.21595/jve.2020.21377
-
E. M. Alawadhi, “Meshing guide,” Finite Element Simulations Using ANSYS, Vol. 15317, pp. 407–424, Sep. 2015, https://doi.org/10.1201/b18949-12
About this article

The authors have not disclosed any funding.
The datasets generated during and/or analyzed during the current study are available from the corresponding author on reasonable request.
The authors declare that they have no conflict of interest.
