Abstract
Based on the shield tunnel construction of the left line of Guowei road station-Qingshan lake west station of Nanchang metro line 3, the study focuses on the adverse effects of tunnel segment convergence and settlement deformation of vault and arch bottom on shield construction in the process of shield tunnel construction in water-rich complex stratum. The time-space curves of segment convergence and settlement value on typical monitoring sections are drawn, their variation laws are analyzed, and the deformation values of monitoring data are analyzed and tested. Based on the analysis results, the qualitative and quantitative evaluation of the overall or local deformation state of each monitoring object of tunnel segment is carried out. The results show that the cumulative deformation of each typical monitoring section is lower than the warning value, and the tunnel segment has a systematic offset in the horizontal and vertical directions of the clearance.
1. Introduction
During the tunneling process of the shield machine, it is also easy to encounter complex stratum and poor geological conditions. The underground water level is high, the water content is large, the strength is low, the stratum is sensitive, and the precipitation settlement is large in the water-rich complex stratum, which causes the shield to cross this kind of soil layer to easily cause the foundation settlement and increase the construction difficulty. Shen Xiang et al. [1] analyzed the tunneling parameter control technology and its variation law of shield tunneling under complex stratum conditions based on a tunnel project under complex geological conditions in Dalian. Liu [2] used mortar backfilling method to solve the construction problem of shield tunnel directly crossing the middle air shaft in a water-rich complex stratum in Changsha. Based on the engineering background of Shenzhen metro line 5, Li et al. [3] analyzed the mechanism of surface subsidence caused by tunneling shield construction in water-rich complex stratum through field monitoring and mathematical statistics.
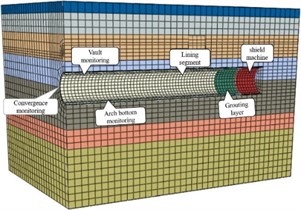
In order to monitor the surrounding environment changes and engineering safety in the process of shield construction in real time, different types of section monitoring points should be arranged in different sections to monitor the construction site. The deformation monitoring of the tunnel segment is an important part. The segment is not only the supporting structure of the tunnel, but also the main structure of the tunnel. It is very important to monitor the vertical settlement deformation and clearance convergence deformation of the segment structure, and to correctly evaluate the quality and safety of the tunnel during construction and operation [4-6].
2. Project overview
The shield section of Guowei road station-Qingshan lake west station is located in the Qingshan lake area, and the section is west-east oriented. The line tunnel buried depth of 15-20 m, left and right double line, and the length is about 1.88 km. Shield tunnel excavation area is mainly gravel sand and round gravel layer, local area is coarse sand and fine sand layer. Engineering geological environment is basically sandy soil, so the shield technology has been used to excavate left and right line tunnel. The excavation of the left tunnel lasted 12 months. In this process, the corresponding tunnel monitoring data are analyzed, and the causes of tunnel segment convergence and vault and arch bottom settlement deformation and their adverse effects on shield construction are introduced in the process of shield construction in water-rich complex stratum. Tunnel segment convergence and settlement monitoring points are set up every 8 rings and the relative height difference between each monitoring point and the nearby reference point is observed using precision length measuring instruments, as shown in Fig. 1.
Fig. 1Engineering geological profile of Guowei road Station-Qingshan lake west station
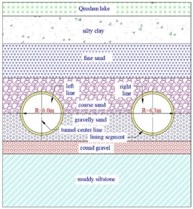
a) Engineering geological plan diagram
b) Engineering geological section diagram
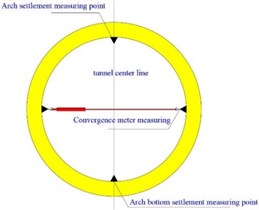
c) Segment convergence and settlement monitoring layout
3. Tunnel segment deformation monitoring
In the process of tunnel segment construction monitoring, when the internal clearance size of the segment structure changes geometrically in the horizontal direction, it indicates that the tunnel segment has undergone lateral relative dynamic deformation. When the geometric length of the segment vault or arch bottom changes in the vertical direction, it indicates that the segment has a rigid absolute settlement deformation in the vertical direction [7, 8]. Notes: the “+” and “–” of the deformation characteristics indicate the dynamic deformation of the tunnel tube sheet in the horizontal and vertical directions, as seen in Table 1.
Table 1Deformation state of tunnel segment
Serial number | Deformation type | Deformation characteristic | Deformation state |
1 | Convergence deformation | + | Relatively dynamic deformation, up and down flattening |
2 | Convergence deformation | – | Relatively dynamic deformation, left and right extrusion flat |
3 | Vault settlement | + | The absolute deformation is overall upward and squashed from side to side |
4 | Vault settlement | – | The absolute deformation moves down and flattens up and down |
5 | Settlement of arch bottom | + | Absolute deformation overall upward movement, the bottom heave |
6 | Settlement of arch bottom | – | Absolute deformation of the whole downward, left and right extrusion flat |
4. Data analysis of tunnel segment convergence and deformation
4.1. Analysis of variation law of convergence value data
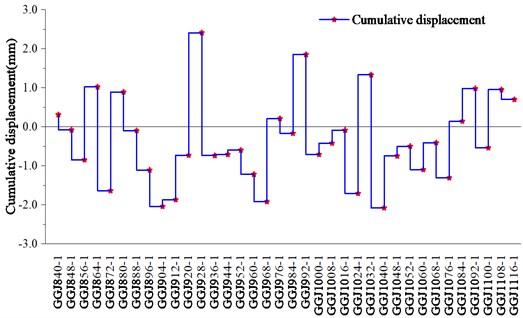
From Table 2 and Fig. 2, the clearance convergence cumulative change of the measurement points of each segment section is different. Most of the segments at the monitoring section are squeezed by the surrounding soil, and the convergence deformation of the horizontal inward contraction occurs in the direction of the clearance. A small part of the section deformation is horizontal outward expansion. The point with the largest cumulative change is GGJ928, and the cumulative displacement is 2.41 mm within the safe and controllable range.
Table 2Tunnel interval convergence monitoring data
Monitoring point number | Cumulative Displacement / mm | Monitoring point number | Cumulative displacement / mm | Monitoring point number | Cumulative displacement / mm |
GGJ840 | 0.31 | GGJ936 | –0.74 | GGJ1032 | 1.33 |
GGJ848 | –0.08 | GGJ944 | –0.71 | GGJ1040 | –2.08 |
GGJ856 | –0.85 | GGJ952 | –0.60 | GGJ1048 | –0.75 |
GGJ864 | 1.02 | GGJ960 | –1.22 | GGJ1052 | –0.50 |
GGJ872 | –1.64 | GGJ968 | –1.92 | GGJ1060 | –1.10 |
GGJ880 | 0.89 | GGJ976 | 0.21 | GGJ1068 | –0.41 |
GGJ888 | –0.10 | GGJ984 | –0.17 | GGJ1076 | –1.31 |
GGJ896 | –1.11 | GGJ992 | 1.85 | GGJ1084 | 0.14 |
GGJ904 | –2.04 | GGJ1000 | –0.71 | GGJ1092 | 0.98 |
GGJ912 | –1.87 | GGJ1008 | –0.42 | GGJ1100 | –0.54 |
GGJ920 | –0.73 | GGJ1016 | –0.09 | GGJ1108 | 0.95 |
GGJ928 | 2.41 | GGJ1024 | –1.71 | GGJ1116 | 0.70 |
The average | –0.35 |
Fig. 2Cumulative value curve of segment convergence deformation
4.2. Engineering convergence data distribution pattern
Table 3 shows the convergence deformation values on each typical monitoring section. The statistical analysis software SPSS is used to test the normality of the engineering data in the table to determine whether the convergence data obeys the normal distribution [9, 10]. The test results are shown in Table 3.
Table 3 uses Kolmogorov-Smirnov and Shapiro-Wilk methods to test the data. The results show that the significance values of both are greater than 0.05, indicating that the monitored data conform to the normal distribution.
Table 3SPSS normality test results of convergence monitoring values
Kolmogorov-Smirnov∂ | Shapiro-Wilk | ||||
Statistic | Statistic | ||||
0.105 | 36 | 0.200 | 0.966 | 36 | 0.331 |
a) Lilliefors significant level correction | |||||
4.3. Test for accidental errors in convergent data
Based on the theory of probability and statistics, the monitoring data of segment convergence in Table 3 is analyzed, and the characteristics of accidental error are tested, so as to judge whether the convergence data is accidental error or systematic error [11].
(1) Test method and formula of random error characteristics.
1) Hypothesis: specify the specific test content of the null hypothesis ;
2) Determine the test statistic: select the corresponding statistic according to the hypothesis content;
3) Determined the rejection region of : under the condition that the significance level (01) is determined, the rejection region corresponding to the critical value is obtained.
The rejection region of positive and negative error signs number test is:
The rejection region of positive and negative error allocation order test is:
The rejection region of error value and test is:
The rejection region of the maximum error value test is:
4) Make a judgment: if the critical value meets the range of the rejection region, reject ; Otherwise, accept and pass the test.
(2) The estimated standard deviation of convergence value was calculated by statistical theory ±1.10 mm, and the significance level 0.0455 was used to test the following error characteristics of convergence monitoring data.
1) Positive and negative error signs number test.
Proposing the null hypothesis : the number of positive and negative error signs is equal; The positive error number is 11, the negative error number is 25, then 14, and the critical value is 12, that is , is rejected, which does not conform to the symmetry of accidental error.
2) Positive and negative error allocation order test.
Proposing the null hypothesis : the alternations number of the same or opposite sign of the adjacent two errors is equal; The number of two adjacent errors with the same sign is 21, the number of adjacent error with opposite sign is 14, then 7, and the critical value is 11.8 ≈ 12, that is , the null hypothesis is accepted and the test is passed.
3) The sum of error values test.
Proposing the null hypothesis : the mean error is zero; The sum of all monitored values is 12.61, and the critical value is ±13.2, that is, , the null hypothesisis accepted and the test is passed.
4) The maximum error value test.
Proposing the null hypothesis : The critical value of limit error is ±2.2 mm; The maximum closure difference in all monitoring values is 2.41 mm, then , that is, the error value at the GGJ928-1 monitoring point is abnormal, is rejected, which does not conform to the boundedness of accidental errors.
Through the above error characteristics test, it can be seen that the convergence value data does not satisfy the symmetry and boundedness of accidental errors, and there are two rejection terms. Firstly, the number of positive and negative error signs is tested and is rejected, indicating that the probability of positive and negative errors with equal absolute values is different. It is considered that these deformation values have systematic tendency characteristics.
4.4. Comprehensive analysis of convergence data
Through the normality test and error characteristic test, the convergence value data obeys the normal distribution, and does not conform to the characteristics of accidental error. It is considered that the tunnel segment has a systematic tendency in the direction of clearance convergence, and there is a relative dynamic deformation with an offset of –0.35 mm horizontally inward extrusion.
5. Analysis of settlement data of tunnel section vault and arch bottom
5.1. Analysis of settlement data of segmental vault
From Table 4 and Fig. 3, It can be seen that the change rate of the cumulative settlement of the whole vault fluctuates greatly, and in the process of shield construction, the segments at most monitoring sections have vertical upward displacement deformation in the vertical direction, resulting in floating phenomenon, and the segment vault at a few sections has normal settlement. The point with the largest cumulative change is GGC1000, and the cumulative displacement is 3.10 mm, which does not reach the warning value.
Table 4Tunnel interval vault monitoring data
Monitoring point number | Cumulative displacement / mm | Monitoring point number | Cumulative displacement / mm | Monitoring point number | Cumulative displacement / mm |
GGC840 | –0.20 | GGC936 | –0.20 | GGC1032 | 0.30 |
GGC848 | 1.00 | GGC944 | 2.50 | GGC1040 | 0.10 |
GGC856 | 1.80 | GGC952 | 2.00 | GGC1048 | 0.10 |
GGC864 | –0.40 | GGC960 | 1.80 | GGC1052 | –1.40 |
GGC872 | 2.10 | GGC968 | 3.02 | GGC1060 | –0.20 |
GGC880 | -0.80 | GGC976 | 0.80 | GGC1068 | 1.10 |
GGC888 | 0.20 | GGC984 | 0.40 | GGC1076 | 0.90 |
GGC896 | 1.60 | GGC992 | 2.80 | GGC1084 | 0.20 |
GGC904 | –0.40 | GGC1000 | 3.10 | GGC1092 | 0.50 |
GGC912 | –1.10 | GGC1008 | 0.30 | GGC1100 | 0.00 |
GGC920 | 1.00 | GGC1016 | 1.60 | GGC1108 | –1.40 |
GGC928 | 0.60 | GGC1024 | 0.40 | GGC1116 | –1.00 |
Average | 0.64 |
5.2. Data analysis of segment arch bottom settlement
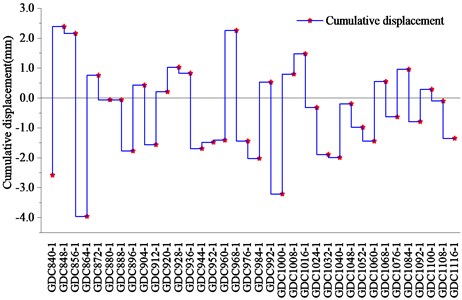
From Table 5 and Fig. 4, it can be seen that except for the large fluctuation of individual monitoring point data caused by construction, the overall change rate of the settlement curve of the arch bottom is relatively gentle. Most of the segments on the monitoring section are in normal settlement, and only a few sections have a certain uplift at the bottom of the tunnel segment. Among them, the point with the largest cumulative change is GDC864, with a cumulative displacement of –3.96 mm, which does not reach the warning value.
Through the normality and error characteristics of the settlement values at the top and bottom of the arch, it can be seen that the settlement data obeys a normal distribution and does not satisfy the requirements of symmetry, boundedness and compensation for chance errors. Both the top and bottom of the arch have a rigid absolute deflection with offsets of +0.64 mm and –0.45 mm respectively.
Fig. 3Cumulative value curve of segment vault settlement
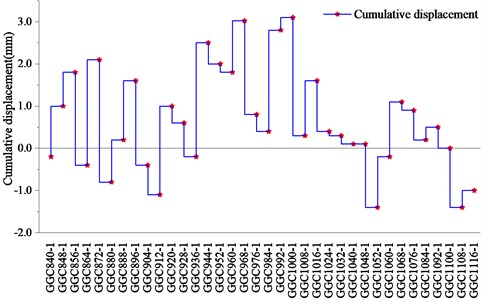
Table 5Tunnel interval under-arch monitoring data
Monitoring point number | Cumulative displacement / mm | Monitoring point number | Cumulative displacement / mm | Monitoring point number | Cumulative displacement / mm |
GDC840-1 | –2.58 | GDC936-1 | 0.83 | GDC1032-1 | –1.89 |
GDC848-1 | 2.39 | GDC944-1 | –1.69 | GDC1040-1 | –1.99 |
GDC856-1 | 2.16 | GDC952-1 | –1.48 | GDC1048-1 | –0.19 |
GDC864-1 | –3.96 | GDC960-1 | –1.41 | GDC1052-1 | –0.98 |
GDC872-1 | 0.76 | GDC968-1 | 2.26 | GDC1060-1 | –1.44 |
GDC880-1 | –0.06 | GDC976-1 | –1.44 | GDC1068-1 | 0.55 |
GDC888-1 | –0.06 | GDC984-1 | –2.02 | GDC1076-1 | –0.63 |
GDC896-1 | –1.77 | GDC992-1 | 0.53 | GDC1084-1 | 0.96 |
GDC904-1 | 0.43 | GDC1000-1 | –3.21 | GDC1092-1 | –0.79 |
GDC912-1 | –1.56 | GDC1008-1 | 0.8 | GDC1100-1 | 0.29 |
GDC920-1 | 0.21 | GDC1016-1 | 1.48 | GDC1108-1 | –0.1 |
GDC928-1 | 1.03 | GDC1024-1 | –0.32 | GDC1116-1 | –1.35 |
Average | –0.45 |
Fig. 4Cumulative value curve of segment arch bottom settlement
5.3. Comprehensive evaluation of the project
Through the statistical analysis and test of the convergence and settlement data of the segment, and according to the judgment of the deformation state in Table 1, it can be seen that the project belongs to the comprehensive deformation phenomenon of the 2, 4 and 8 cases. The deformation of the tunnel segment is judged as follows: in the direction of clearance convergence, the segment is squeezed by the surrounding soil to produce a relative dynamic deformation of –0.35 mm horizontally inward, and the rigid absolute deformation of the vertical upward 0.64 mm of the vault and the vertical downward –0.45 mm of the arch bottom is accompanied.
6. Conclusions
1) In the direction of clearance convergence, the tunnel segments are squeezed by the surrounding soil. In the vertical direction, most sections have a certain floating phenomenon at the top of the tunnel, and a few sections have a certain uplift at the bottom.
2) The point with the largest change in convergence is GGJ928 with a cumulative displacement of 2.41 mm, the point with the largest change in vault is GGC1000 with a cumulative change of 3.10 mm, and the point with the largest change in arch bottom is GDC848 with a cumulative settlement of –3.96 mm. The monitoring values are lower than the warning value within the safe range.
3) In the direction of clearance, the tunnel segment has a systematic relative dynamic deformation of –0.35 mm. In the vertical direction, the top of the tunnel segment has an offset of + 0.64 mm, and the bottom has a rigid absolute deformation of –0.45 mm. The overall deformation state of the tunnel segment meets the engineering design requirements.
References
-
Liu Bin, “Key technology of slurry balanced shield machine passing through air shaft under water-rich complicated stratum,” Railway Construction Technology, Vol. 2, pp. 102–105, 2019.
-
Li Tao, Han Xuefeng, Huang Hua, and Liu Wei, “Laws of surface subsidence caused by the excavation of a bored subway tunnel in a water-rich mixed ground in Shenzhen,” Modern Tunnelling Technology, Vol. 51, No. 2, pp. 76–82, 2014.
-
Y. Zhou, Z. Zhang, and S. Liang, “Key technologies in construction of railway tunnel in large cross-section and rich-water composite stratum,” Railway Standard Design, Vol. 59, No. 12, pp. 64–68, 2015.
-
X. Li, X. Lin, H. Zhu, X. Wang, and Z. Liu, “Condition assessment of shield tunnel using a new indicator: The tunnel serviceability index,” Tunnelling and Underground Space Technology, Vol. 67, pp. 98–106, Aug. 2017, https://doi.org/10.1016/j.tust.2017.05.007
-
H.-W. Huang, Y.-J. Zhang, D.-M. Zhang, and B. M. Ayyub, “Field data-based probabilistic assessment on degradation of deformational performance for shield tunnel in soft clay,” Tunnelling and Underground Space Technology, Vol. 67, pp. 107–119, Aug. 2017, https://doi.org/10.1016/j.tust.2017.05.005
-
X. Chen, X. Li, and H. Zhu, “Condition evaluation of urban metro shield tunnels in Shanghai through multiple indicators multiple causes model combined with multiple regression method,” Tunnelling and Underground Space Technology, Vol. 85, pp. 170–181, Mar. 2019, https://doi.org/10.1016/j.tust.2018.11.044
-
Y. Li et al., “Data processing and analysis for convergent and settlement monitoring in subway shield tunnel,” Journal of Southeast University (Natural Science Edition), Vol. 43, pp. 296–301, 2013.
-
X. Shao et al., “Research on Reinforcement Technology of Launching End of Close-spaced Twin Tunnels in Water-rich Sand Stratum,” Railway Standard Design, Vol. 66, No. 2, pp. 1–7, 2021.
-
X. Zeng, “Normality Test and Analysis on Detection Data of Automatic Pavement Deflector,” China Academic Journals (CD Version).
-
Y. Feng et al., “Seismic response and damage law of CRTS II Slab Ballastless track key components between layers on bridge,” Railway Standard Design, Vol. 64, No. 10, pp. 30–34, 2020.
-
“Theory of Error and Base of Survey Adjustment,” School of Geodesy and Geomatics, Wuhan University, 2014.
About this article

Research and Application Project of Shield Control Parameters in Nanchang Strata (HX2021-413).
The datasets generated during and/or analyzed during the current study are available from the corresponding author on reasonable request.
The authors declare that they have no conflict of interest.
