Abstract
Experimental study on consolidation test of remolded saturated loess is carried out by GDS static triaxial apparatus. The deformation characteristics of specimens, under different loading rates, are discussed and the test results are compared and analyzed. The results show that the changing trend of the curve modeling the relation between the axial stress and the axial strain of the sample is consistent even with the change in loading rates. Thus, under this same context, the larger the loading rate is, the greater the axial strain will be, when the axial stress reaches the same value. Moreover, under different loading rates, the trend of the relationship curve between the lateral pressure coefficient and the axial strain of the soil sample is basically consistent. The stability value of the lateral pressure coefficient of the sample varies with the loading rate, but only within a fixed range.
Highlights
- Under different loading rates, the change trend of the relationship curve between the axial stress σ_1 and the axial strain ε_1 of the specimen is consistent, which can be expressed through a cubic polynomial. Moreover, under different loading rates, when the axial stress σ_1 reaches the same value, the axial strain ε_1 of the specimen with a larger loading rate will get also larger.
- Under different loading rates, the trend of the relationship curve between the lateral pressure coefficient K0 and the axial stress σ_1 is basically consistent. The stability value of the lateral pressure coefficient K0 varies with the loading rate; however, the stability value of the lateral pressure coefficient varies between 0.42 and 0.56.
- When the loading rate is very slow, the pore water pressure is very small, and it basically does not change with the variation of strain.
1. Introduction
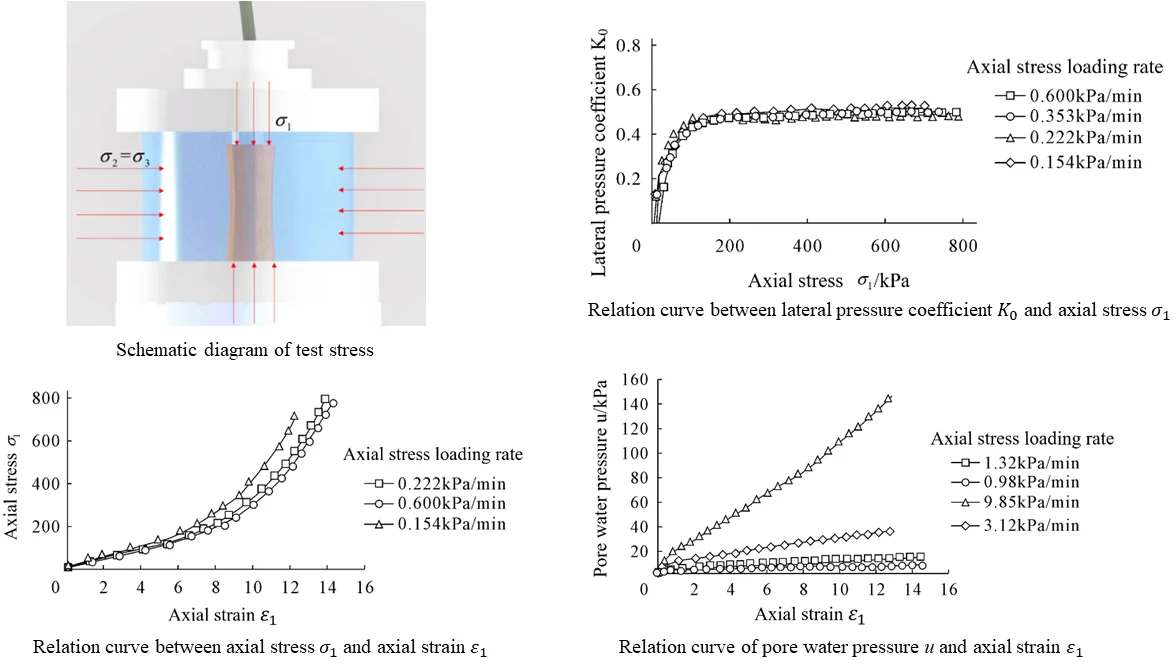
Soil is a porous, multiphase, and loose deposit [1]. Moreover, the geotechnical problems relative to soil are complex, which implies that the primary elements should be emphasized in the laboratory geotechnical test while the subsidiary factors should be neglected. In the soil triaxial test [2], four kinds of tests are commonly used to study the soil stress-strain characteristics; these tests are namely the isotropic compression test, the confined compression () test, the triaxial compression test, and the direct shear test. consolidation test is adopted in this paper, and its main stress characteristics are , as shown below in Fig. 1.
Fig. 1Schematic diagram of test stress
While the natural soil is generally considered to be in consolidation state, the stress, the strain, and the pore water pressure will also vary with the consolidation state of the test piece [3], which affects the permeability and the strength test parameters of the test piece in the process of axial loading. For typical loading projects such as highways and dams, it is generally believed that the foundation soil is loaded on the basis of consolidation [4-8]. Therefore, it is of great practical significance to carry out consolidation triaxial test to restore the corresponding stress state of soil at a certain depth.
To sum up, this paper will be divided as follow: in Section 2, the test raw materials will be presented whereas the test scheme design will be introduced in Section 3. Test results and their analysis will be detailed in Section 4 and, finally, a conclusion and some future works will be provided in Section 5.
2. Test raw materials
The soil for the test is obtained from the typical loess of Xi’an, with a depth of 12.4-13.5 m, thus belonging to Q3 loess. The natural density of the specimen is 1.76-1.83 g/cm3, which consist of a brownish-yellow and hard plastic. The natural water content of the sample is 21.85 %, the natural void ratio is 0.72-0.74, the natural saturation is greater than 80.0 %, the liquid limit is 30.2 %, and the plastic limit is 19.5 %.
3. Test scheme design
3.1. Sample preparation
The method for preparing a remolded loess sample involves spreading out an undisturbed raw loess soil sample and letting it air dry. Then, a rubber hammer is used to smash and disperse the soil sample, but not too forcefully so as to avoid crushing the soil sample particles, which could affect the soil sample’s structure and properties and the accuracy of the test results. The soil sample required for the test is crushed and passed through a 2 mm sieve. The sample is prepared according to the moisture content of the loess after air drying and sieving, the required sample volume , the required soil, and the required water mass. The soil container should be sealed after material preparation, and the sample shall be blocked for use during day and night. The dry density of the test is 1.5 g/cm3, and the initial water content is 27 %. Mixing the stuffy sample in the soil container evenly, extruding some air from the sample, and taking an appropriate amount of sample at four different positions to measure the moisture content of the four samples constitute the next stage. When the difference value and the allowed value are equal, the average value is retained, and the sample preparation is launched. Wiping the soil evenly into the three-plate mold with a soil-wiping knife and trying not to create a void are key elements to succeed with this procedure. Then, the top surface of the sample should be leveled, and the dry density will be calculated by weighing the mass of the loaded sample until it meets the test requirements.
3.2. Sample size
The size and the specification of the test piece are as follows: the diameter is 39.1 mm, the height is 80.0 mm, and the volume of the test piece is 96 cm3, by adopting GDS triaxial test system.
3.3. Saturation of sample
The saturation method of the sample is the vacuum pumping saturation method. Once the mold is fixed and the test piece is in the saturator, it can be placed in the vacuum cylinder, the cylinder head edge can be sealed with Vaseline, and the air extractor can be turned on to begin the air extraction process. When the vacuum pressure gauge shows a pressure close to 1 atmosphere, the water inlet pipe clamp is opened so that it looks like it had been placed in the water to make the water enter slowly the vacuum pumping cylinder. During the water inflow process, adjusting the water inflow rate through the pipe clamp, keeping the value displayed on the vacuum pressure gauge basically unchanged until the water surface is 2-3 cm higher than the saturator, closing the pipe clamp, and continuing to pump air for about 15 minutes to extract the gas in the water is also a prerequired process to achieve. Finally, the power supply will be turned off, the pumping system will stop, the pipe clamp will open to let the atmosphere pressure enter the vacuum cylinder, and this melt will stand up for one day and night to saturate the test piece under the action of atmospheric pressure.
4. Equipment of the test and working principle
4.1. Test equipment
GDS triaxial tester is used in the test. The instrument is composed of one dynamic and one static triaxial systems. The test flow can be controlled either manually or directly by using the special GDSLAB software of the computer, and data will be recorded automatically during the test.
The axial stress and confining pressure are applied and measured by the axial pressure and confining pressure controllers, respectively. The strain is obtained by back calculation of the axial displacement and the cross-sectional area of the specimen, and the volumetric strain can be measured using the back pressure controller.
4.2. Working principle
When the GDS triaxial test system conducts the saturation test, this test measures the volume change of the test piece through the back pressure controller (for the saturated soil, it is the change of the water volume in the test piece), so as to back-calculate the average cross-sectional area of the test piece, and to coordinate the work between the confining pressure controller, the back pressure controller, and the axial displacement control systems. Thus, the lateral and the axial stresses are constantly adjusted to make sure that the specimen does not produce any lateral deformation; therefore, the sample diameter remains unchanged, so as to meet the consolidation condition.
The accuracy measured by GDS triaxial test system meets the following requirements: an axial stress test accuracy that is not less than 0.1 kPa and a displacement measurement accuracy that must be better than 0.08 %.
4.3. Method of the test
This test adopts the Constant Loading Rate (CLR) test method. It consists that the stress growth rate on the test piece remains constant during the loading process. During this test, the confining pressure is continuously loaded from 0 kPa to 400 kPa, and different loading rates are achieved by setting different loading times. The loading time is 1.5, 4.5, 10.0, 13.5, 20.0, 40.0, 60.0, 80.0 hours respectively. Moreover, the axial stress loading rate can be seen in Table 1.
Eight loading rates are selected for the test, and each loading rate is tested in parallel with three test pieces to eliminate operating errors.
Table 1The axial stress loading rate
Loading time / h | 20 | 40 | 60 | 80 | 1.5 | 4.5 | 10 | 13.5 |
The axial stress loading rate / (kPa·min-1) | 0.600 | 0.350 | 0.222 | 0.154 | 9.85 | 3.12 | 1.32 | 0.98 |
5. Test results and analysis
5.1. Stress-strain relationship
The stress-strain relationship of the soil is very complex. As soil is composed of broken solid particles, its macroscopic deformation is mainly caused by the position changes between particles. Under different stress levels, the strain increment, caused by the same stress increment, will not be different, that is, nonlinearities are dominant.
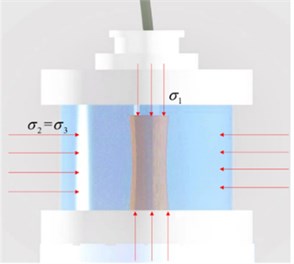
Fig. 2Relation curve between axial stress σ1 and axial strain ε1
The axial stress and the strain of specimen under different loading rates relation curves are shown in Fig. 2.
It can be seen from Fig. 2 that the axial stress and the axial strain of the test piece, corresponding to each loading rate, show an obvious nonlinear relationship in the process of consolidation test. On the one hand, for each loading rate, when the stress is small, the stress-strain relationship is basically linear, and its nonlinear behavior is not obvious. On the other hand, when the stress increases, the nonlinear behavior of the stress-strain relationship is more obvious. For different loading rates, the stress-strain relationship curve basically coincides at the beginning of the stage when the stress is small; however, with the increase of stress, the stress-strain curves, corresponding to different loading rates, gradually separate, and the degree of separation becomes much larger. Moreover, the larger the loading rate is, the larger the change of strain will be relative to the change of stress. The reason is that the stress is small, and the deformation of the specimen is mainly elastic; thus, the stress-strain relationship curve is linear at the beginning. With the increase of stress, the deformation of the specimen is mainly of plastic-type and the stress-strain relationship is nonlinear. According to the Technical Manual of Soil Test, when the axial strain () reaches 15 %, the specimen will be basically destroyed [9]. It can also be seen from Fig. 2 that, under each loading rate, the specimen does not reach the failure state.
To sum up, the stress-strain curve can be expressed as:
where, , and are parameters related to soil properties.
When the loading rate is 0.222 kPa/min:
When the loading rate is 0.60 kPa/min:
When the loading rate is 0.154 kPa/min:
5.2. Relationship between lateral pressure coefficient and axial stress
The lateral pressure coefficient of soil refers to the ratio of the lateral effective stress to the vertical effective stress when the soil is compressed under semi-infinite body conditions. The foundation soil can be regarded as a semi-infinite body, that is, the object extends infinitely in the positive and negative directions of the horizontal and axes, while the vertical axis extends infinitely only in the downward positive direction, and the upward negative direction is fixed and maintained at zero value. The foundation soil in the horizontal and depth directions can be considered as an infinite extension relative to the size of the building foundation.
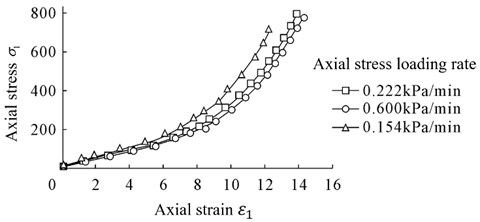
The variation curve of the lateral pressure coefficient with axial stress under different loading rates is shown in Fig. 3.
It can be seen from Fig. 3 that, during consolidation test, at a certain loading rate, the relationship curve between the lateral pressure coefficient and the axial stress can be roughly divided into three sections at a certain loading rate. When the stress is small, the curve tends to be a straight line. As the stress increases, the nonlinearity of the curve becomes more significant. When the axial stress reaches 80-120 kPa, the lateral pressure coefficient tends to be stable gradually. In the stable stage, the axial stress continues to increase, and the lateral pressure coefficient basically maintains a constant value.
It can be seen, from the test curve, that the relationship curve between the lateral pressure coefficient and the axial stress, under different loading rates, is basically equivalent in the first two stages whereas the stable value of the lateral pressure coefficient in the third stage varies between 0.42 and 0.56.
Fig. 3Relation curve between lateral pressure coefficient K0 and axial stress σ1
5.3. Relationship between pore water pressure and axial strain
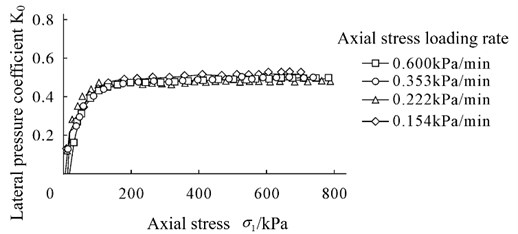
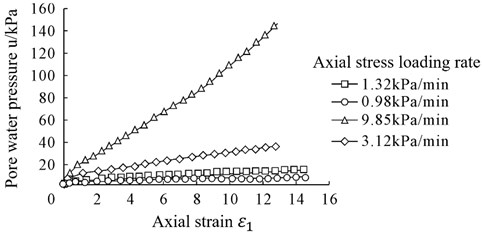
Any section of soil contains a soil particle section and a soil skeleton pore section. Moreover, the interparticle stress transmitted through the soil particle contact point is called effective stress in soil. The stress transmitted through pores in the soil is called pore stress, which includes pore water and gas pressures. However, hydrostatic pressure will not cause soil deformation. What really affects the soil is the excess pore water pressure, which is commonly called pore water pressure. The relationship curve of pore water pressure and axial strain is shown in Fig. 4.
It can be seen from Fig. 4 that the pore water pressure increases with the strain under different loading rates. Moreover, under the condition of constant incremental strain, the pore water pressure rises as strain and loading rate increase. When the loading rate is very slow, the pore water pressure is very small (for this test, the loading rate reaches 1.32 kPa/min), and basically does not change with the variation of strain.
Fig. 4Relation curve of pore water pressure u and axial strain ε1
6. Conclusion
In this paper, the consolidation test of saturated remolded loess is conducted, and the deformation characteristics of the specimen, under different loading rates, are discussed. The conclusions are as follows:
1) Under different loading rates, the change trend of the relationship curve between the axial stress and the axial strain of the specimen is consistent, which can be expressed through a cubic polynomial. Moreover, under different loading rates, when the axial stress reaches the same value, the axial strain of the specimen with a larger loading rate will get also larger.
2) Under different loading rates, the trend of the relationship curve between the lateral pressure coefficient and the axial stress is basically consistent. The stability value of the lateral pressure coefficient varies with the loading rate; however, the stability value of the lateral pressure coefficient varies between 0.42 and 0.56.
3) When the loading rate is very slow, the pore water pressure is very small, and it basically does not change with the variation of strain.
Moreover, loess is widely distributed all over the world, and its strength changes after encountering water. The above tests analyzed the deformation strength characteristics of saturated remolded loess under different loading rates. The results reveal the deformation characteristics of saturated remolded loess on the one hand, and provide some basic data and reference for the modification of loess constitutive model on the other hand in the future.
References
-
B. P. Zhang and J. Q. Dang, Soil Mechanics and Ground Foundation. Beijing: China Water & Power Press, 2006.
-
X. Lig, Advanced Soil Mechanics. Beijing: Tsinghua University Press, 2004.
-
Zhao, M. H., and X. Yu, Soil Mechanics and Foundations. Wuhan: Wuhan University of Technology Press, 2009.
-
H. T. Cheng et al., “K0 consolidation characteristics of compacted loess under continuous loading,” Chinese Journal of Rock Mechanics and Engineering, Vol. 26, pp. 3203–3208, 2007.
-
M. S. Qi et al., “Research of intact loess through continuous loading K0 consolidation tests,” Chinese Journal of Underground Space and Engineering, Vol. 1, No. 3, p. 370–373, 2005.
-
X. B. Yue, “Study on K0 consolidation characteristics of remolded saturated loess,” Chang’an University, Xi’an, 2012.
-
C. L. Guo, “The study on K0 consolidation characteristics of remolded saturated loess,” Shanxi Science and Technology of Communications, Vol. 6, p. 10–12, 2013.
-
H. W. Tong and W. W. Deng, “Study on shear tests with K0 consolidation unloading for soil,” Geotechnical Investigation and Surveying, Vol. 5, p. 13–16, 2008.
-
“Technical Manual of Geotechnical Tests,” Beijing, China Communications Press, Research Institute of Geotechnical Engineering, Nanjing Hydraulic Research Institute, 2003.
About this article

The authors have not disclosed any funding.
The datasets generated during and/or analyzed during the current study are available from the corresponding author on reasonable request.
The authors declare that they have no conflict of interest.
