Abstract
Road and subway tunnels in soft clay soils subjected to traffic loading often cause lager settlement. It can pose danger to the surrounding buildings and structures. Hence, it is necessary for engineers to correctly predict the long-term deformation of saturated clay foundations under cyclic loading. In this paper, a series of dynamic triaxial tests were carried out on Nanning clay to investigate the effect of loading frequency and cyclic stress on axial strain accumulation of clay under undrained condition. Results show that loading frequency has a great effect on the axial strain accumulation of clay. Based on the experimental results, an empirical formula for calculating the accumulated deformation of saturated clay under cyclic loading was presented.
1. Introduction
Saturated clay is widely distributed on the silty coast and estuarine coast areas. When it is used as building foundation or road base, it will produce long-term uneven settlement under cyclic loading (such as machine vibration, traffic load, etc.), which will seriously affect the normal use of the structure. Therefore, it is very important for engineers to correctly predict the long-term deformation of saturated clay foundations under cyclic loading.
The cumulative plastic deformation models under cyclic loading are mainly divided into two categories: theoretical models and empirical models [1]. The existing theoretical models mainly include the modified Cambridge model, the nested yield surface model, the boundary surface model, and so on. These theoretical models are able to calculate the plastic strain generated by each cyclic load with high accuracy but complex calculation, and most of them need to use small enough calculation steps to simulate each cyclic loading and unloading process. In the case of a large number of cycles, the models often fail due to excessive computational effort. Empirical models are usually built from the results of indoor tests and field tests, avoiding the problem of excessive computational effort. Since empirical models meet the requirements of engineering practice, they have been widely used in practical engineering. Many empirical models have been used to predict the development of cumulative plastic deformation of soil under cyclic loading. The most commonly used model is the power function model proposed by Monismith et al. [2], and based on this model, some similar or modified models have been developed, such as Chai et al. [3], which considers the effect of initial static deflection stress, and Guo et al. [4], which considers the effect of stress ratio. The above models are simple and convenient, with low computational cost, and have good prediction effect, but the effect of frequency is neglected.
In this paper, dynamic triaxial tests of saturated clay under different dynamic stress ratios and loading frequencies were carried out, and based on the test data, an empirical formula for calculating the accumulated deformation of saturated clay under cyclic loading was established, and the test data and calculated results were compared and analyzed.
2. Sample preparation and test results
The test was performed using the GDS dynamic triaxial instrument. The test clay was extracted from a subway construction site in Mingxiu East Road, Xingning District, Nanning, China. The diameter and height of samples are 50 mm and 60 mm, respectively. In case of isotropically consolidation stress, an effective confining pressure reached 100 kPa. After that, sinusoidal one-way cyclic loading was applied to the samples. The cyclic stress amplitudes (peak to peak value) were 21, 31 and 36 kPa. Table 1 is the test schemes.
Table 1Compress cyclic triaxial tests series
Test | (kPa) | (Hz) | |
1 | 21 | 9452 | 1 |
2 | 31 | 1000 | 0.1 |
3 | 5000 | 0.5 | |
4 | 10000 | 1 | |
5 | 20000 | 2 | |
6 | 36 | 10000 | 1 |
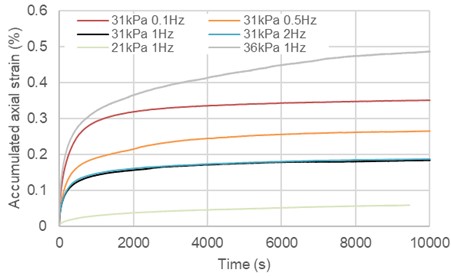
Fig. 1 presents the development of axial strain with time of loading cyclic under different loading frequencies and different cyclic stress. Both loading frequency and cyclic stress have significant effect on strain accumulation. The accumulated axial strain is bigger under larger cyclic stress, and the accumulated axial strain decreases with the increase of frequency. The similar experimental phenomenon was observed in the experiments of Yang et al. [5] and Hyde et al. [6].
Fig. 1The relationship between accumulated axial strain and loading duration
3. Empirical formula
The empirical model is typically developed using results from laboratory and field tests, which helps to avoid issues of excessive calculation. Since the empirical model meets the demands of engineering practice, it has been widely utilized in practical engineering applications. Several empirical models have been used to predict the cumulative plastic deformation of soils under cyclic loading. The power function model proposed by Monismith et al. [2] is the most frequently used model:
where is cumulative strain, is the number of cycles corresponding to a load duration of 1000 s, and are dependent on factors such as soil type, soil property and stress state.
Li et al. [7] incorporated the influence of dynamic deviatoric stress and proposed a calculation equation for A in the Monismith model:
where, denotes the dynamic deviator stress of traffic load, while represents the static failure deviator stress of soil. Moreover, and m is related to the plasticity index of the foundation.
Taking into account the influence of stress ratio, Guo et al. [4] proposed an undrained deformation prediction formula for saturated soft clay under long-term cyclic loading:
where represents the cumulative plastic strain corresponding to the 1000th cycle, while represents the slope of the double logarithmic relationship curve between the cumulative plastic strain and the number of cycles.
These models are simple, convenient, and have a low computational cost, making them effective in predicting the settlement of clay subgrades under traffic load. However, they do not consider the influence of frequency, which can affect the accuracy of predictions. To make the empirical model more realistic and applicable to actual working conditions, it is necessary to consider these factors.
From the above test results, it can be seen that the cumulative strain of saturated clay is affected by cyclic frequency and cyclic stress ratio under the same cyclic number. Based on the Monismith model, the following three conditions should be considered when establishing the cumulative strain prediction formula of Nanning saturated clay under cyclic loading, such as Eq. (4):
Fig. 2 presents the double logarithmic relationship between the cumulative strain caused by cyclic loading and the number of cycles at different frequencies. It is worth noting that the dots in the figure represent the corresponding points when the loading duration is 1000 s. After loading 1000 s, the double logarithmic relationship curve is almost linear before failure. Therefore, the relationship between the cumulative strain and the number of cycles can be expressed as Eq. (5):
Eq. (5) can be written as Eq. (6):
where is cyclic frequency, is the number of cycles corresponding to a load duration of 1000s, iscumulative strain corresponding to a load duration of 1000 s, is the slope of the line.
is related to frequency, stress ratio and soil state, and Eq. (7) is a possible expression:
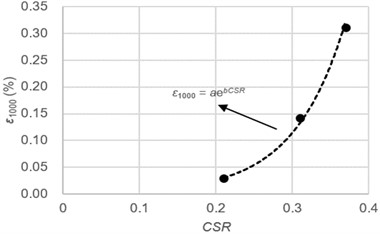
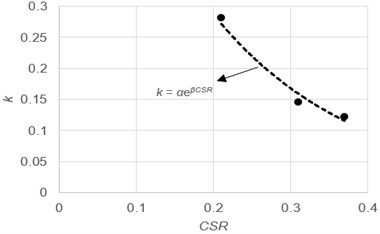
Fig. 3(a) shows the relationship between and stress ratio at 1 Hz. The black dot in the diagram represents the axial strain of samples with stress ratios of 21, 31, and 36 kPa at 1 Hz, corresponding to a loading time of 1000 s. increases with the increase of stress ratio, and its relationship can be expressed by exponential function:
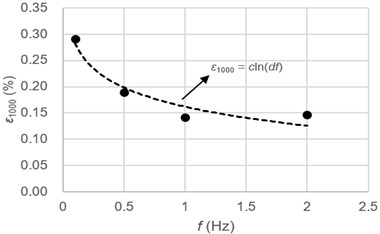
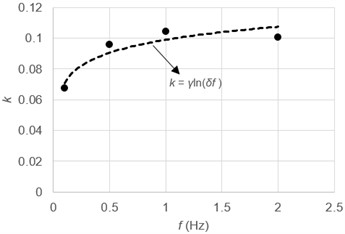
where is the fitting correction parameter, is the parameter affected by frequency. Fig. 3(b) shows the relationship between and frequency under the cyclic stress of 31 kPa and it can be expressed by exponential function:
where and are the parameter affected by stress ratio. Thus, the ecpression of with three parameters can be obtained:
where is the fitting correction parameter, .
Fig. 4(a) and (b) are the relationship between and stress ratio and frequency, respectively. The dots in the figure represent the corresponding points when the loading duration is 1000 s. As the stress ratio increases, decreases. Conversely, at the same stress ratio, increases with frequency, except for 2 Hz, which is an anomaly as explained below. Similar to the derivation process of calculation formula, frequency, stress ratio and soil state are also the influencing factors of :
where is the fitting correction parameter, , are parameter affected by cyclic stress ratio and frequency, respectively.
Therefore, the empirical formula for the cumulative strain of saturated clay under undrained cyclic loading is characterized by six parameters:
The best values of each parameter can be obtained by fitting the test results, and the values of each parameter are shown in Table 2.
Table 2Model parameters
–0.00068 | 0.04495 | 14.89500 | 0.01020 | 3359.97499 | -5.35500 |
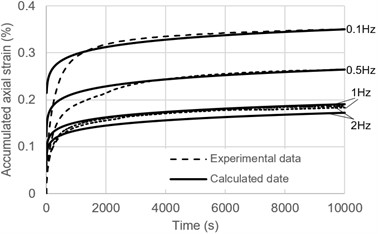
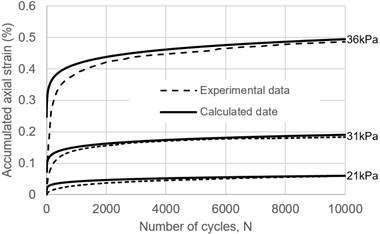
Fig. 5(a) and (b) show that the cumulative strain calculation results at different frequencies and different stress ratios are slightly higher than the test results in the early stage of the cycle. With the increase of the number of cycles, the two data gradually fit, and basically coincide after about 2000 s. In Fig. 5(a), when the cycle frequency is 2 Hz, the calculation results of most of the time are lower than the experimental data. This is due to the limitation of the Dynamic Triaxial Testing System. When a high frequency load of 2 Hz is applied, the first few cyclic stress amplitudes will exceed the set value and then gradually recover. The cumulative strain of the first few cycles accounts for a large proportion of the cumulative strain in the whole cycle, so the cumulative strain test data of 2 Hz is high. The maximum cumulative strain difference between all the calculation results and the test data is less than 10 %, indicating that Eq. (11) can effectively predict the cumulative strain of the saturated clay at the later stage of the cycle.
Fig. 2Logarithmic relationship between accumulated strain and number of cycles
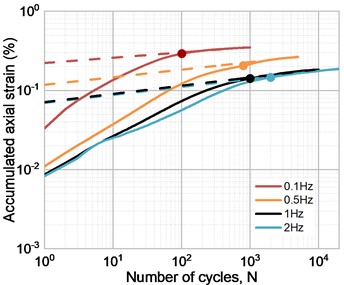
Fig. 3Relationship between ε1000 and CSR or frequency: a) CSR; b) frequency
a)
b)
Fig. 4Relationship between k and CSR or frequency: a) CSR; b) frequency
a)
b)
Fig. 5Comparison of test data with calculated data: a) different frequencies; b) different stress
a)
b)
4. Conclusions
The cumulative axial strain of saturated clay is affected by the number of cycles, cyclic frequency and stress ratio. Based on a series of cyclic triaxial test results of Nanning clay under undrained conditions, an empirical formula for cumulative strain of saturated clay under cyclic loading is established to predict the short-term cyclic settlement of clay foundation highway. It has a good fitting effect and can effectively predict the axial cyclic cumulative strain of clay.
References
-
X.-W. Ren, Q. Xu, J. Teng, N. Zhao, and L. Lv, “A novel model for the cumulative plastic strain of soft marine clay under long-term low cyclic loads,” Ocean Engineering, Vol. 149, pp. 194–204, Feb. 2018, https://doi.org/10.1016/j.oceaneng.2017.12.028
-
C. Monismith, N. Ogawa, and C. Freeme, “Permanent deformation characteristics of subgrade soils due to repeated loading,” Transportation Research Record, pp. 1–17, 1975.
-
J.-C. Chai and N. Miura, “Traffic-load-induced permanent deformation of road on soft subsoil,” Journal of Geotechnical and Geoenvironmental Engineering, Vol. 128, No. 11, pp. 907–916, Nov. 2002, https://doi.org/10.1061/(asce)1090-0241(2002)128:11(907)
-
L. Guo, J. Wang, Y. Cai, H. Liu, Y. Gao, and H. Sun, “Undrained deformation behavior of saturated soft clay under long-term cyclic loading,” Soil Dynamics and Earthquake Engineering, Vol. 50, pp. 28–37, Jul. 2013, https://doi.org/10.1016/j.soildyn.2013.01.029
-
Q. Yang, Y. Tang, B. Yuan, and J. Zhou, “Cyclic stress-strain behaviour of soft clay under traffic loading through hollow cylinder apparatus: effect of loading frequency,” Road Materials and Pavement Design, Vol. 20, No. 5, pp. 1026–1058, Jul. 2019, https://doi.org/10.1080/14680629.2018.1428219
-
A. F. L. Hyde and S. F. Brown, “The plastic deformation of a silty clay under creep and repeated loading,” Géotechnique, Vol. 26, No. 1, pp. 173–184, Mar. 1976, https://doi.org/10.1680/geot.1976.26.1.173
-
D. Li and E. T. Selig, “Cumulative plastic deformation for fine-grained subgrade soils,” Journal of Geotechnical Engineering, Vol. 122, No. 12, pp. 1006–1013, Dec. 1996, https://doi.org/10.1061/(asce)0733-9410(1996)122:12(1006)
About this article

The project was funded by the Zhejiang Provincial Institute of Communications Planning, Design & Research, the Guangxi Natural Science Foundation (No. 2019GXNSFBA185038).
The datasets generated during and/or analyzed during the current study are available from the corresponding author on reasonable request.
The authors declare that they have no conflict of interest.
