Abstract
The article discusses the possibility of applying the results of regression analysis [1], fuzzy logic modelling and adaptive systems as such for use in heating control circuits of railway turnouts in order to reduce energy consumption, reduce current surges during on/off switching, and extend the life of heating elements. Based on various researches [2-4] some new solutions are proposed to fulfil shortages of current solutions. As a proposed solution to the described problem, an experimental point electric heating adaptive control system is proposed and described. Experiment of controlling point electric heating system using pulse-width modulation driven by values of regression analysis and fuzzy logic elements. Adaptive methods allowed to dismiss contact temperature sensors, which is associated with a decrease in the reliability of the system, but this fact is prevented by the use of such control methods that can indirectly determine the required rail heating temperature. Conclusions show that the approach of introducing adaptive methods like pulse-width modulation allows to control point electric heating in more efficient way – using program code, control system will adjust heating by adjusting time intervals when the heating is turned on and off.
1. Introduction
In order to transport cargo safely and uninterruptedly using railway, all elements of railway infrastructure must function without failures. According to researches [1-6] main safety focus is on railway automatics and signalling, shunting movement, level crossings and turnouts or points. All of these elements are not heavily dependent on weather conditions except points. During winter, condition of the area between stock rail and blade can become icy or it can be filled with snow thus blocking point switching from one extreme position to another.
Railways in Commonwealth of Independent States (CIS) countries are usually equipped with point pneumatic cleaning systems and electric heating systems. This article will focus on one of the most effective methods of point cleaning – point heating with electric heating elements. By using point electric heating (PEH), snow and ice most definitely will be melted, and point will be clean. Unfortunately, the downside of this method is cost for consumed electricity. Existing systems do not apply the method of limiting the power of the heating elements, which significantly increases the energy consumption in “mild to medium” weather conditions. The article considers the possibility of developing a control system for heating a turnout with reduced energy consumption.
2. Main objectives
In order to evaluate the point as a regulated thermal object, it is necessary to know the thermal technical parameters: heated mass, exposure and stabilized temperature, reaction time.
Point material is steel with a specific heat capacity of 460 J/(kg·°C). Usually, the length of the 1/9 type point is 8 meters, and the heated length is 5 meters. Heating elements are located and attached to the point frame rail exactly 5 meters long. Since the frame rail is heated, the parameters of the frame rail were used in the calculations. The frame rail has a rail type (brand) R50, which in practice means that the mass of one running meter rail is 50 kg. The total heated mass is 250 kg [7, 8].
For example, to heat one point frame rail to a temperature of +5 °C, if the ambient air temperature is −15 °C, the amount of heat is required, which is calculated according to the formula:
where – thermal energy J, – mass kg, – specific heat capacity of the material J/(kg·°C), – the final temperature of the material after heating, – initial temperature of the material. 250·460·(5 – (–15)) = 2 300 000 J = 2 300 kJ.
If it is necessary to heat such a mass in 1 minute, then the supplied power can be calculated as follows:
where is the required heating or reaction time. Of course, in real conditions, there is no need to heat the frame rail to a stable positive temperature in such a short time. As a rule, the frame rail should be heated to a stable positive temperature, which ensures melting of snow between it and the blade within no more than 15 minutes from the moment of turning on the heating. Therefore, recalculating the result according to the formula above, the following result is obtained:
which is a correct result since the rated power of the heating element is 2,3 kW.
However, the continuous use of the maximum power of the entire heating element is not economically feasible, since most of the time the effects of the environment and precipitation are not at extreme values and overheating and excessive consumption of electricity ultimately has a negative impact on the environment [9]. Thus, the task is to control the power of the heated element depending on a variety of climatic and physical factors.
3. Development of the heating element power control concept
In order to obtain the effect of all impact factors on power, a power expression was formed:
For temperature correction +5 °C, –45 °C, +5 °C, for the effect of precipitation 30 mm/h, 0 mm/h, wind speed 0 m/s, 30 m/s.
Three impact coefficients are adopted: (ambient temperature), which can take the values –1 (–45 °C) and +1 (+5 °C), (precipitation in the form of snow and ice), which can take the values –1 (precipitation level is 0 mm/h) and +1 (precipitation intensity is 30 mm/h) and (wind speed), which can take the values from –1 (0 m/s) and +1 (30 m/s).
Formula to calculate the impact factor :
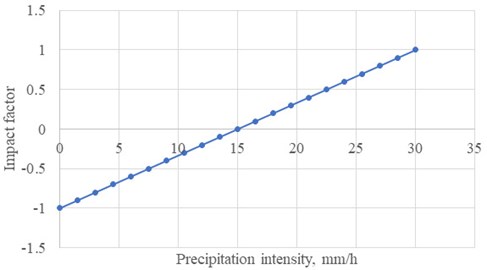
The heating process of the frame rail is impacted by several factors: the most important is the outdoor temperature during the heating process , which in Latvian climatic conditions can vary from –45 °C, marking on the linear scale – the extreme left point with a relative value of –1 and up to +5 °C with a relative value +1 on the linear scale. At temperature +5 °C, heating is only necessary if there is precipitation in the form of rain and the wind is so strong that all the generated heat is dispersed in the outdoor space and there is a risk of the point blade freezing to the frame rail. A wind with a speed of 30 m/s (+1 on the linear scale) can be considered a very strong wind. If it is completely windless and there is no precipitation in the form of rain or ice, then at +5 °C the point may not be heated. So, a very important factor is the amount of precipitation – if the rails are covered, then the amount of heating can be reduced. Similarly, if there is no snowfall (0 mm/h), then it is accepted on the linear scale as –1, but if there is heavy snowfall (30 mm/h), then it is accepted as +1.
The impact of all three factors on the required heating power can be estimated with the following regression expression:
where is the required power at the average values of all 3 impact factors (zero on the linear scale).
If only the extreme values of the linearized scales –1 and +1 are used, then it is necessary to initially create a table of the required powers with 23 = 8 possible factor situations. It is best to make such a table experimentally, but then it is necessary to find the possibility to change all 3 factors in a wide range. Therefore, the expert method is usually used with an approximate calculation of power – an expert’s assessment by the size of the effect.
By setting the minimum value (–1), the maximum value (+1), a power table with the following powers is obtained, which according to experts looks like this for the 10-minute mode. Expert’s assessment was made based on experimental data of the heating power using actual measurements of temperature and power in different climatic conditions. After experimental measurements, results were analysed and table with assessment of required power was created (see Table 1).
Table 1Expert’s assessment of required power
Value / impact factor | Power , kW | |||
–1 | –1 | –1 | ||
–1 | –1 | +1 | ||
–1 | +1 | –1 | ||
–1 | +1 | +1 | ||
+1 | –1 | –1 | ||
+1 | –1 | +1 | ||
+1 | +1 | –1 | ||
+1 | +1 | +1 | ||
* In case the power exceeds the maximum power of the heating element, this parameter indicates an increase in the heating time | ||||
The average power value is determined simply by summing all 8 power measurements and dividing the sum by 8 (3 factors):
The ambient air temperature impact factor is determined by summing the product of each measurement result with the relative value of the factor in the measurement:
Similarly, the snowfall impact coefficient is determined:
and the wind effect factor:
Overall:
Fig. 1Changes in the impact factor depending on ambient temperature changes
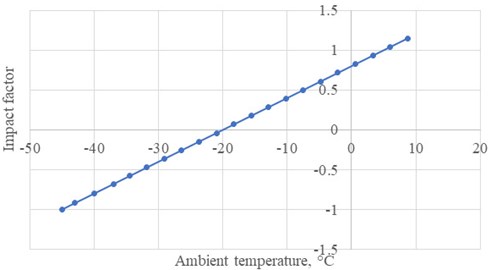
Fig. 2Changes in the impact factor depending on changes in the precipitation intensity
Maximum power will be required in low ambient temperature, heavy precipitation and very strong wind: 11,8 kW.
The minimum required power in the evaluation area will be at +6 °C, uncovered rails, no snowfall and no wind: 1,88 kW.
Actually, at ambient temperature = +5 °C heating can be stopped.
It should be noted that the link between the relative and the real value is expressed as:
If –45 °C, +5 °C and for example, –15 °C, then the relative value is:
If the amount of precipitation intensity is 5 mm/h, then the relative value:
but if the wind speed is 3 m/s, then relatively it is:
If the regression expression with impact factors has been obtained, then the values of the necessary powers can be obtained at all the real values of the impact factors, the research range of these values, i.e. for ambient air temperature from –45 °C to +5 °C, precipitation amount from 1 mm/h to 30 mm/h, wind strength from 0 m/s to 30 m/s, i.e. get .
In reality, it is very difficult to estimate the required power, because it depends on both stationary parameters (mass, heat capacity, partly the difference between the required changeover temperature and the temperature of the surrounding environment) and dynamic ones – the rate of environmental temperature change, changes in climatic conditions depending on the climatic dynamic impacting factors – wind strength, humidity, atmospheric pressure [10, 11]. In the study [12], the study of power changes depending on various environmental factors was carried out. The research was conducted in one of Scandinavian country, where the climatic conditions are close to the conditions in Latvia. The last impacting factor is the geographical position (location) of the object, which is very important [13], and this geographical location largely determines the requirements for the creation of the exchange heating system. The movement route can start (end) at a geographical point where special heating is not needed at all, and end (start) in harsh climatic conditions. This means that even for one route, if it is long, it may be necessary to create an individual system for each section according to the required nominal power, as well as the maximum power for extreme situations, which must be ensured by the functioning of the turnout.
If maximum impact factors are observed, the power will be very high, but in reality, such a situation is unlikely, and the system will operate with a reduced power compared to the maximum possible value.
The above shows that the study of impact factors is a very important issue that needs to be addressed, because the rational and efficient operation of the system depends on it.
4. Definitions of equations of the state of the system
To implement the task, a system was chosen based on an industrial programmable logical controller with feedback implemented as a rail temperature sensor. In this case, the system is described by the following equations.
The state of the system at any time depends on the input function :
where – system state function (transient function).
The state of the system at any moment also depends on its previous states at time moments , , ..., i.e. from its state functions (transitions):
where – system state function (transient function).
Fig. 3Block diagram of a single feedback system
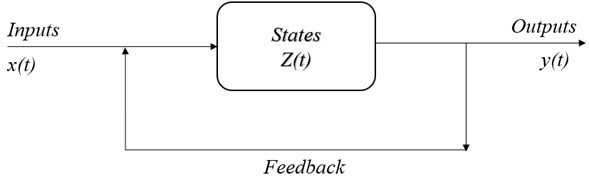
The relationship between the input function and the output function of the system, ignoring the previous states, can be represented as:
where – function of system outputs.
A system with such an output function is called static.
If the system depends not only on the input functions , but also on the state (transition) functions , , ..., then:
Systems with this output function are called dynamic (or behavioural systems).
Depending on the mathematical properties of the input and output functions of the systems, discrete and continuous systems are distinguished.
For continuous systems, expressions Eq. (10) and (11) are calculated as follows:
5. Synthesis of an intelligent control system and the results of practical experiment
The results of the effectiveness of the proposed solution can be simulated in various simulation programs [5, 14-18], however, in this case, the method of practical experiment was chosen. For practical implementation, an object was identified – a point in the neck of the station, which is located in urban area and thus is subject to rather strong changes in temperature, wind and snow cover. An experiment on a point in a woodland area or in an open greenfield could not cover all possible combinations of impact factors and their changes.
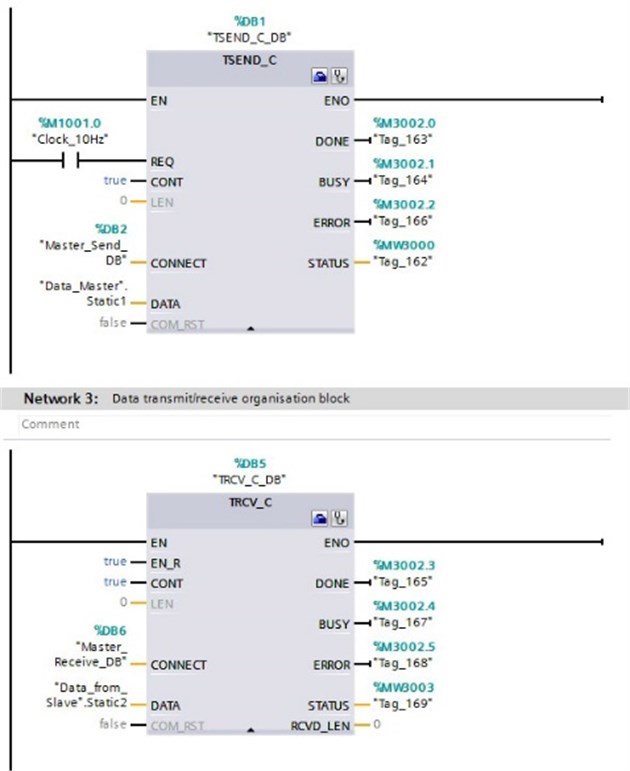
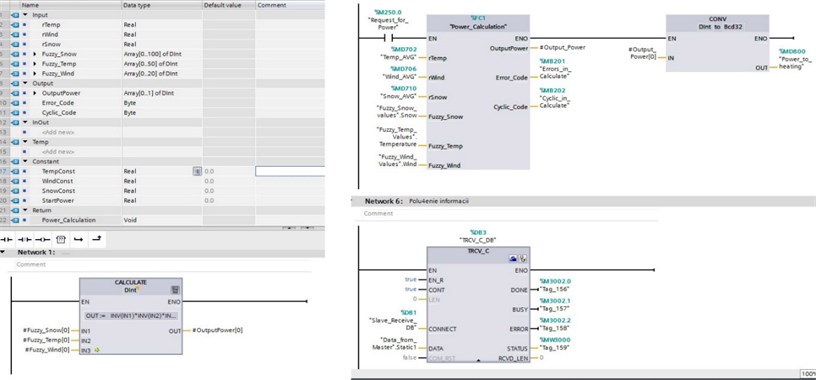
On the basis of two SIEMENS S7-1214 programmable logical controllers (PLCs), a project of an automated heating system was created, taking into account the influence of temperature, wind speed and precipitation to determine the heating power for the turnout. The main blocks of the program are blocks for transmitting and receiving information between controllers (Fig. 4), which allows transmitting metrological data from the PLC to which the sensors are connected into the PLC that directly controls the heating power. In the %DB1 “TSEND_C_DB” block input there are: REQ – sets the periodical data exchange, CONNECT and DATA inputs – describe array of data for exchange, DONE output is 1 when data transfer is successful, BUSY and ERROR outputs indicate bit 1 if the channel is busy or data transfer has error, STATUS output provides information about block status. The %DB5 “TRCV_C_DB” block has same inputs for data array description (CONNECT and DATA), also designation of outputs is totally same as for the block %DB1 “TSEND_C_DB”.
Fig. 4Project of an automated system based on programmable controllers
The power control of the heating element was implemented by means of PWM control of a solid-state relay directly switching the voltage supply to the heating element. The program code for PWM processing is shown in Fig. 5. The elements ADD and MUL on the first row calculate right level on PWM signal, on next row by the MOVE block this figure is written to the output %QW1000 “RelayControl” and for change actualisation, block %DB7 “CTRL_PWM_DB” is used which is shown in row 3.
The calculation of the value of the pulse-width modulation coefficient, and, accordingly, the required power supplied to the heating element, is implemented as a function block Calculate (Fig. 6) (FB1). Inputs of this block: #FuzzySnow, #FuzzyTemp and #FuzzyWind contain fuzzy set of variables. Next step is to process fuzzy rules in block %FC1 “PowerCalculation”. In this block, the value is calculated based on Fuzzy Logic algorithm which is implemented as array of values: Fuzzy_Temp_Values; Fuzzy_Wind_Values and Fuzzy_Snow_Values. The information about current weather conditions is put into the Power_Calculation block trough the inputs: Temp_AVG; Snow_AVG and Wind_AVG. After conversion in CONV block the output value is sent to Output register.
Fig. 5Implementation of PWM controller output control
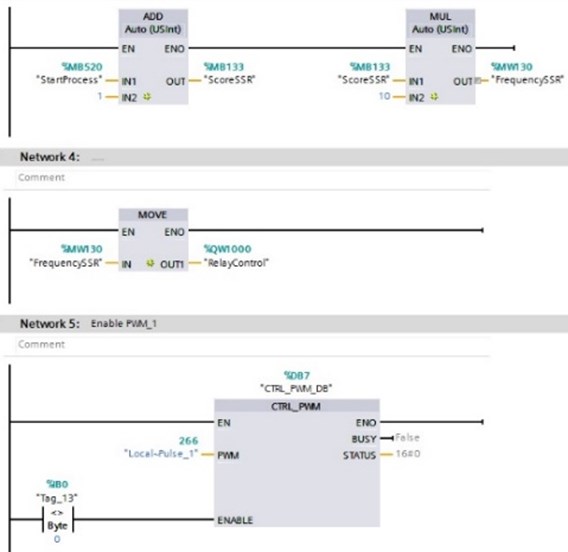
Fig. 6Implementation of power calculation based on regression analysis
The result of the developed intelligent heating power control system is shown in Figs. 7 and 8. Analysis of the rail temperature shows a spread of values within 2-3 degrees, which clearly indicates that Fuzzy Logic algorithm integration to the power control system increases precision of target temperature.
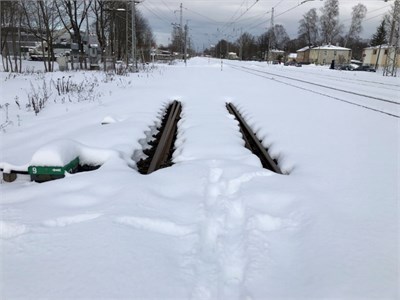
As can be seen from the presented photograph (Fig. 8), the turnout zone is completely cleared of snow (snow is melted), which makes it possible to reliably control the turnout and ensure the safe movement of trains. The photo was taken by authors on the railway turnout zone at the Zasulauks station area, during real experiment in winter conditions. Analysis of the rail temperature showed a spread of parameters within 2-3 degrees, which clearly indicates the correctness of the approach.
Fig. 7Graph of stabilized rail temperature in various outside temperature ranges
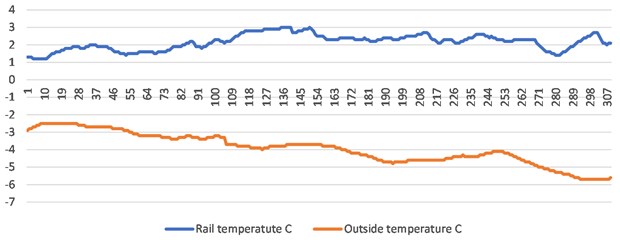
Fig. 8Results of practical experiment in heavy snowfall conditions
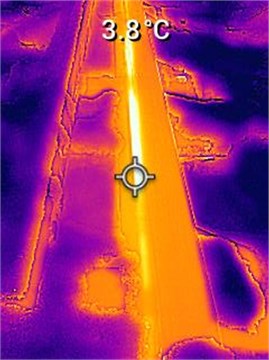
Another way how authors verified the work of proposed control system was using the FLIR TG267 thermal camera. FLIR TG267 displayed and recorded Multi-Spectral Dynamic thermal images and visual images with temperature readings (Fig. 9). Hot and cool zones were easily identified using this FLIR TG267 thermography camera. As can be ascertained from Fig. 9, during operation of the experimental system, the area between the point’s blade and the frame rail was thawed and at the same time the temperature in the lower part of the rail neck was 3.8 °C, which is the desired result – the frame rail was not heated excessively, and the snow has melted.
Fig. 9Overall thermal image of the experimental turnout
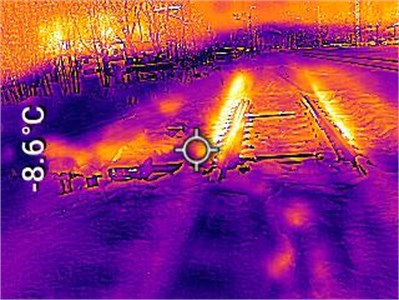
As can be seen in Fig. 10, then the average temperature in district of point No. 9 (outside the heated area) was –8.6 °C, which roughly corresponds to the outdoor temperature at the time of observation (–9.4 °C). As confirmation of a positive result of the experiment, a common thermal image from point No. 9 area (Fig. 10), where the ambient temperature at the point machine of the turnout (outside the heated zone) is shown. Also, a relatively dark overall thermal image can be observed, which indicates a low temperature at the location of the thermal image.
Fig. 10Overall thermal image of the experimental turnout
6. Conclusions
In the article, a system of control of the heating of the turnout is proposed, the basis of which is adaptive system utilising the automated control principle with the use of negative feedback. The effectiveness of the proposed method directly depends on the correctness and accuracy of the calculation of coefficients , and [19-21], which in turn determines the complexity of building and copying such systems for various situations.
The results of the experiment showed that the proposed solution will reduce the energy consumption of the turnout heating system by 15-20 % for the entire winter period compared to the systems currently in use on the Latvian railway and built on the basis of heating to a certain temperature with the subsequent turning off of the heating element and cooling rail. Adaptive methods make it possible to dismiss the contact temperature sensors, which is associated with a decrease in the reliability of the system and use such control methods that can indirectly determine the required rail heating temperature.
References
-
F. S. V. Campos, F. A. Assis, A. M. Leite Da Silva, A. J. C. Coelho, R. A. R. Moura, and M. A. O. Schroeder, “Reliability evaluation of composite generation and transmission systems via binary logistic regression and parallel processing,” International Journal of Electrical Power and Energy Systems, Vol. 142, p. 108380, Nov. 2022, https://doi.org/10.1016/j.ijepes.2022.108380
-
M. Mezitis, V. Panchenko, M. Kutsenko, and A. Maslii, “Mathematical model for defining rational constructional technological parameters of marshalling equipment used during gravitational target braking of retarders,” Procedia Computer Science, Vol. 149, pp. 288–296, 2019, https://doi.org/10.1016/j.procs.2019.01.137
-
R. Muhitovs, M. Mezitis, and J. Freimane, “Intelligent railway point electric heating control system,” in 2019 IEEE 60th International Scientific Conference on Power and Electrical Engineering of Riga Technical University (RTUCON), pp. 978–17281, Oct. 2019, https://doi.org/10.1109/rtucon48111.2019.8982345
-
R. Muhitovs, M. Mezitis, and I. Korago, “Development of the railway point electric heating intellectual control algorithm,” Transport Problems, Vol. 15, No. 1, pp. 71–80, 2020, https://doi.org/10.21307/tp-2020-007
-
J. Freimane, M. Mezitis, and F. Mihailovs, “Maneuver movements’ safety increase using maneuver locomotive identification and distance control,” Procedia Computer Science, Vol. 104, pp. 375–379, 2017, https://doi.org/10.1016/j.procs.2017.01.148
-
Mareks Mezītis and Aleksejs Vasiļjevs, “Feasibility of IIoT application in railway signalling and interlocking systems,” in Transport Means 2019: Sustainability: Research and Solutions: Proceedings of the 23rd International Scientific Conference. Part 1, Vol. 2019, pp. 169–175, 2019.
-
V. Yatsun et al., “Searching for the two-frequency motion modes of a three-mass vibratory machine with a vibration exciter in the form of a passive auto-balancer,” Eastern-European Journal of Enterprise Technologies, Vol. 4, No. 7 (106), pp. 103–111, Aug. 2020, https://doi.org/10.15587/1729-4061.2020.209269
-
R. Muhitovs, M. Mezītis, J. Freimane, and I. Korago, “Development of the decision-making algorithm for railway maneuverer park equipment with independent controllers,” Procedia Computer Science, Vol. 149, pp. 202–205, 2019, https://doi.org/10.1016/j.procs.2019.01.124
-
M. Mezitis, G. Strautmanis, A. Baranovskis, and R. Muhitovs, “Environment safety improving due to railway noise management decreasing of RMR method adaptation,” Ecology in Transport: Problems and Solutions, Vol. 124, pp. 505–563, 2020, https://doi.org/10.1007/978-3-030-42323-0_9
-
J. Chen, H. Liu, C. Chen, and Z. Duan, “Wind speed forecasting using multi-scale feature adaptive extraction ensemble model with error regression correction,” Expert Systems with Applications, Vol. 207, p. 117358, Nov. 2022, https://doi.org/10.1016/j.eswa.2022.117358
-
L. Ren, N. Wang, W. Pang, Y. Li, and G. Zhang, “Modeling and monitoring the material removal rate of abrasive belt grinding based on vision measurement and the gene expression programming (GEP) algorithm,” The International Journal of Advanced Manufacturing Technology, Vol. 120, No. 1-2, pp. 385–401, May 2022, https://doi.org/10.1007/s00170-022-08822-z
-
J. Ji, Y. Bie, Z. Zeng, and L. Wang, “Trip energy consumption estimation for electric buses,” Communications in Transportation Research, Vol. 2, p. 100069, Dec. 2022, https://doi.org/10.1016/j.commtr.2022.100069
-
B. Gao, Y. Liu, B. Shao, and H. Ran, “A path analysis method to study the subsynchronous oscillation mechanism in direct-drive wind farm with VSC-HVDC system,” International Journal of Electrical Power and Energy Systems, Vol. 142, p. 108328, Nov. 2022, https://doi.org/10.1016/j.ijepes.2022.108328
-
F. Mihailovs, Z. Sansyzbajeva, and M. Mezitis, “Simulation of the Interaction of railway station and harbor,” Procedia Computer Science, Vol. 104, pp. 222–226, 2017, https://doi.org/10.1016/j.procs.2017.01.117
-
Y. Zhou, “A regression learner-based approach for battery cycling ageing prediction-advances in energy management strategy and techno-economic analysis,” Energy, Vol. 256, p. 124668, Oct. 2022, https://doi.org/10.1016/j.energy.2022.124668
-
E. Ginters, M. Mezitis, and D. Aizstrauta, “Sustainability simulation and assessment of bicycle network design and maintenance environment,” in 2018 International Conference on Intelligent and Innovative Computing Applications (ICONIC), pp. 978–15386, Dec. 2018, https://doi.org/10.1109/iconic.2018.8601225
-
G. Strautmanis, M. Mezītis, and Valentina Strautmane, “Model of a vertical rotor with a ball-type automatic balancer,” Vibroengineering Procedia, Vol. 8, pp. 57–62, 2016.
-
T. A.-L. Aboul-Atta and S. B. E. Elmaraghy, “Factors affecting performance improvement of the metro system in cities,” Journal of Engineering and Applied Science, Vol. 69, No. 1, pp. 1–18, Dec. 2022, https://doi.org/10.1186/s44147-022-00078-4
-
S. Alamdari, M. H. Basiri, A. Mousavi, and A. Soofastaei, “Application of machine learning techniques to predict haul truck fuel consumption in open-pit mines,” Journal of Mining and Environment, Vol. 13, No. 1, pp. 69–85, Jan. 2022, https://doi.org/10.22044/jme.2022.11577.2145
-
S. Chakravarty, H. Demirhan, and F. Baser, “Modified fuzzy regression functions with a noise cluster against outlier contamination,” Expert Systems with Applications, Vol. 205, p. 117717, Nov. 2022, https://doi.org/10.1016/j.eswa.2022.117717
-
R. Muhitovs, M. Mezitis, A. Spunitis, and V. Iriskovs, “Analysis of experimental railway point electric heating system,” in 2020 IEEE 8th Workshop on Advances in Information, Electronic and Electrical Engineering (AIEEE), pp. 2689–7342, Apr. 2021, https://doi.org/10.1109/aieee51419.2021.9435805
About this article

The authors have not disclosed any funding.
The datasets generated during and/or analyzed during the current study are available from the corresponding author on reasonable request.
The authors declare that they have no conflict of interest.
