Abstract
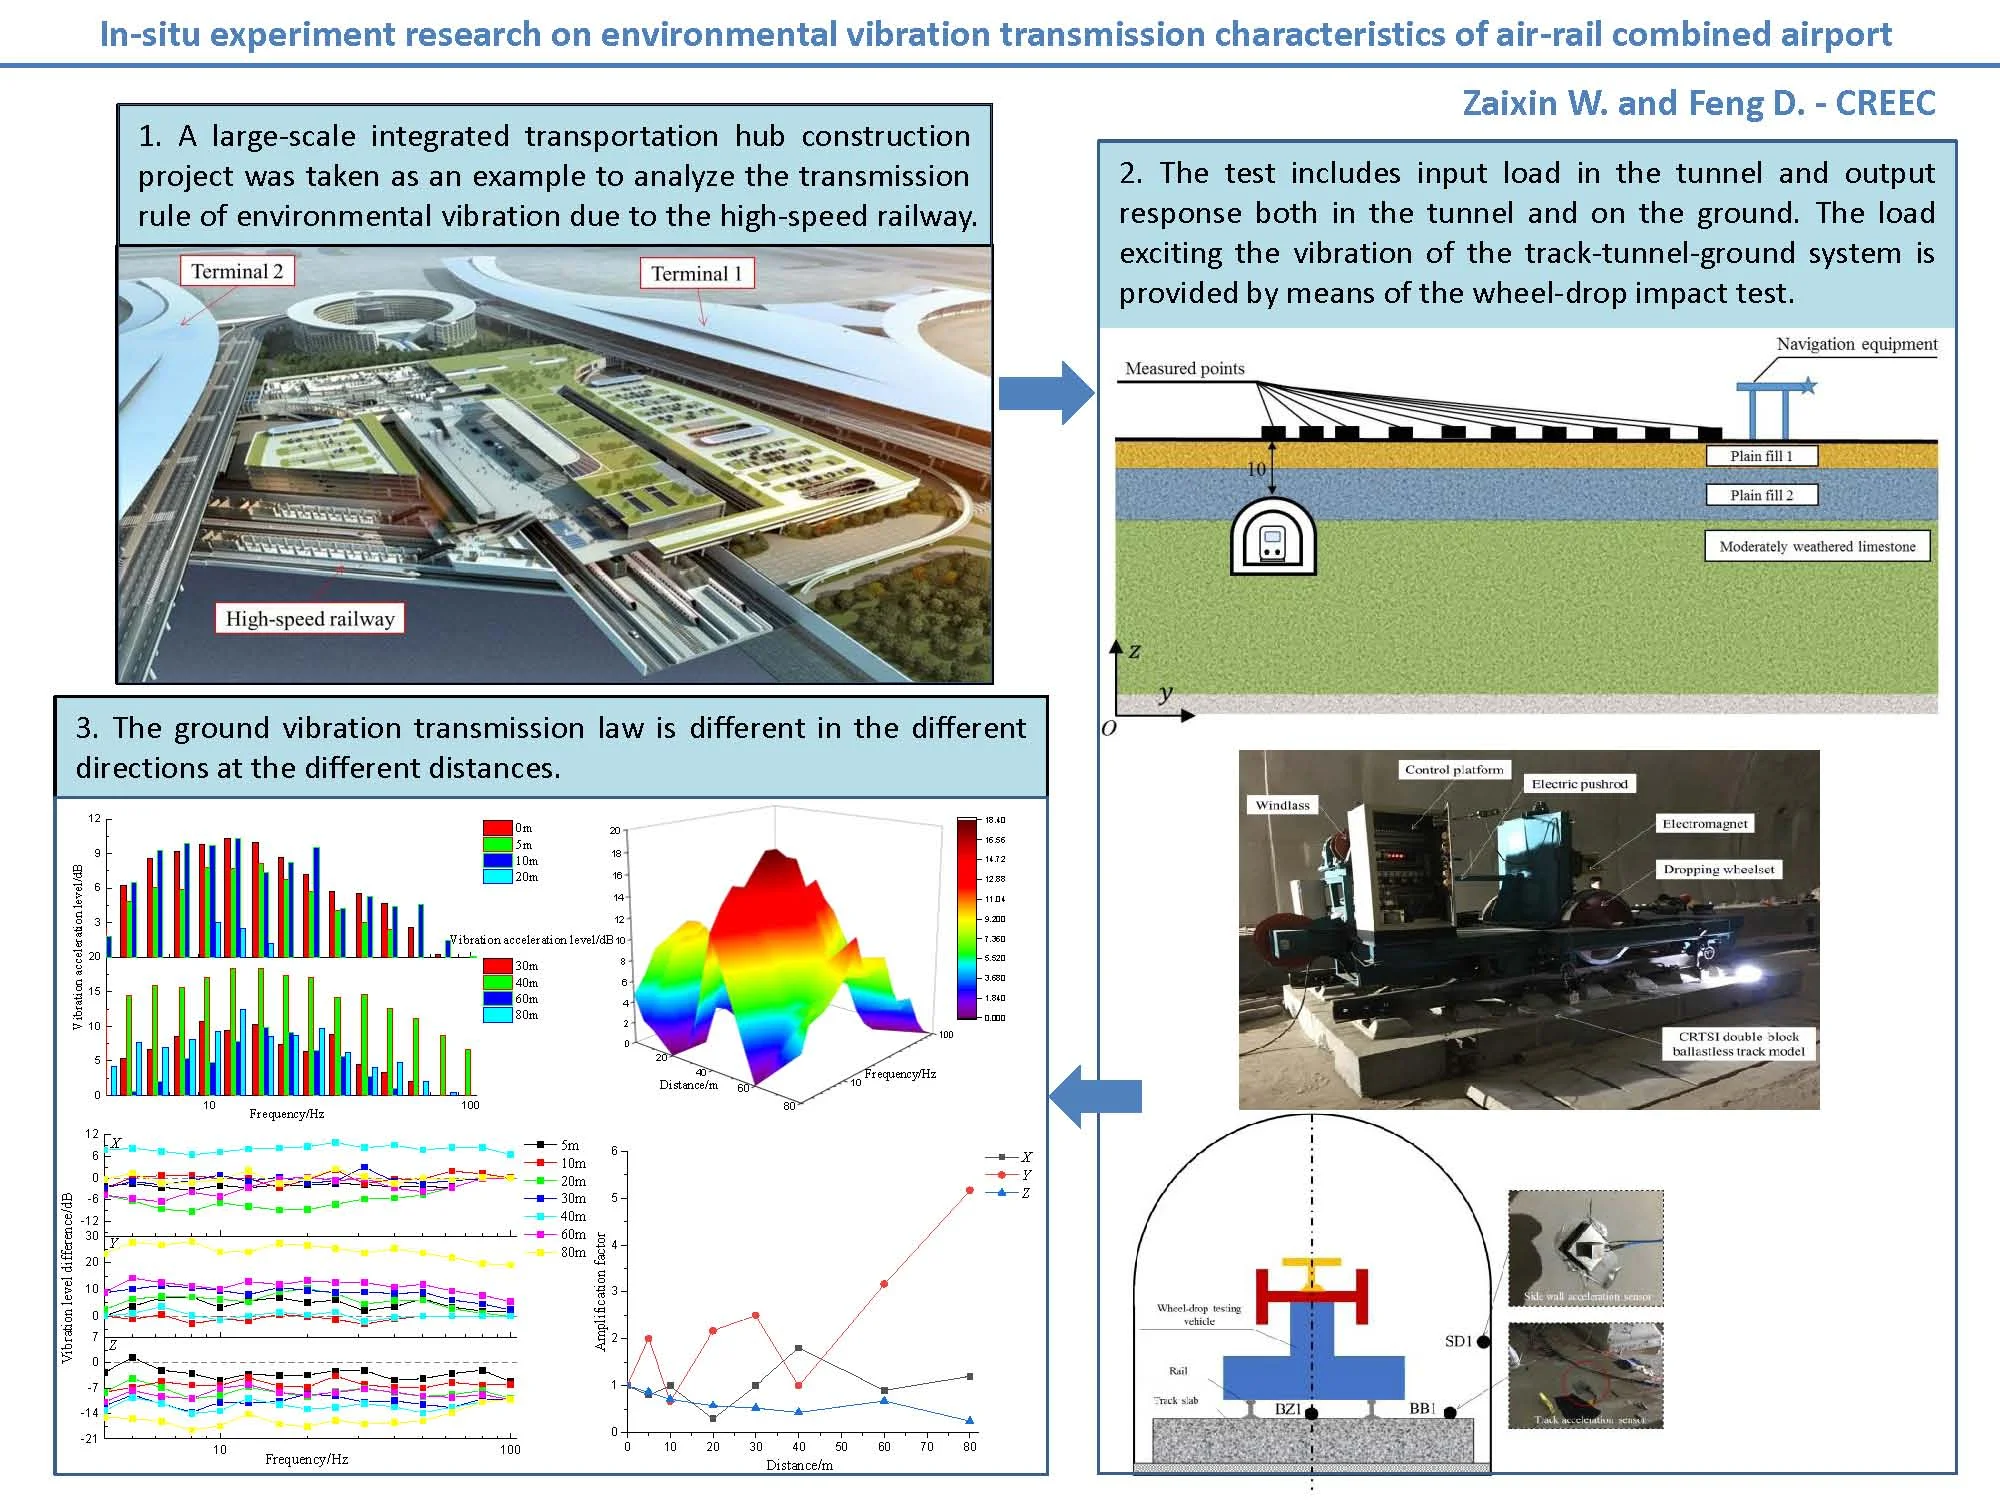
The rail transit and civil aviation are the important components of the comprehensive transportation system. The development of the air-rail combined transport is an important effective way for China to become a country with strong transportation network. The transportation intersection form of railway under-passing airport transportation hub gradually becomes popular, thus the environmental vibration due to the under-passing railway cannot be ignored. In this paper, a large-scale integrated transportation hub construction project was taken as an example to analyze the transmission rule of environmental vibration due to the high-speed railway at the speed of 350 km/h under-passing airport in terms of the time domain and frequency domain by means of the on-site in-situ wheel-drop test. The research results show that the vertical vibration response of the ground surface along the normal direction of the railway is greater than those of the other two directions within 40 m from the centerline of the track. A vibration amplification zone appears within 5-40 m. The longitudinal vibration response of the ground surface is greater than those of the other two directions within 40-70 m. The local vibration amplification zones appear within 5-20 m and 30-60 m. The lateral vibration level of the ground surface along the normal direction of the railway increase gradually, but attenuates at the distance of 40 m and 10 m with the maximum attenuation rate of 0.67. The vertical vibration level amplifies at the distance of 60 m. The longitudinal vibration level attenuates at the distance of 20 m with the maximum attenuation rate of 0.3, but amplifies at the distance of 40 m with the maximum amplification rate of 1.8.
Highlights
- The vertical ground vibration response along the railway line largely attenuates within the range of 20 m, while the longitudinal vibration response large increases away from the location of 40 m.
- There exists the vibration amplification zone within the range of 5~40 m for the vertical vibration response, while there is also the local amplification zones for the longitudinal vibration response within the range of 5~20 m and 30~60 m.
- The longitudinal and lateral vibration levels of the ground surface increase gradually along the railway line, but attenuate gradually at about 15 Hz.
- The longitudinal and vertical vibration levels largely increase within 40~60 m, while the lateral vibration level substantially increase within 0~40 m.
- The vertical vibration level amplifies at the distance of 60 m.
1. Introduction
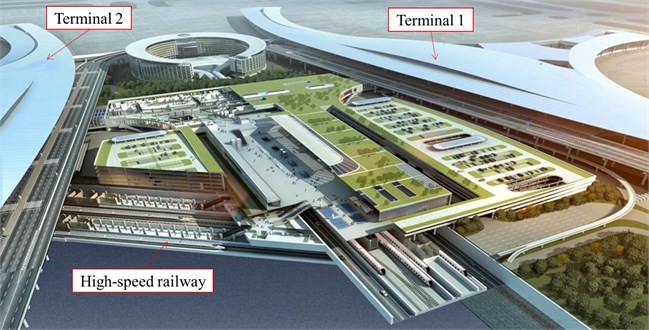
The high-speed railway has developed rapidly with the advantages of high speed, safety and convenience. With the rapid growth of civil aviation transportation, the introduction of high-speed railway into airports to realize the function of air-rail combined transportation is becoming more and more common [1, 2]. In order to achieve the seamless connection of “zero-transfer” as much as possible, the introduction of high-speed railways is in the way of underpassing the airport shown in Fig. 1. And the impact of environmental vibration caused by the underpassing high-speed railway cannot be ignored. The high-speed railway has the characteristics of high operation speed and high tunnel clearance. The vibration generated by the coupling of the high-speed train and the track is transmitted to the surrounding soil through the lower foundation, which is likely to affect the safety of airport buildings, the application of aviation precision instruments and the work for airport staff [3]. Due to the lack of mastering the environmental vibration characteristics and transmission laws of the high-speed railway, in consideration of the conservative design, multiple high-speed railways in China have to reduce the operation speed to 200 km/h or below, such as the into-city section of Beijing-Zhangjiakou high-speed railway, the Shijiazhuang section of Beijing-Guangzhou high-speed railway, the Qingdao section of Jinan-Qingdao high-speed railway. Also, the actual operation speed of the railways are all less than the design speed at the section near the vibration-sensitive points, which seriously affects the operation efficiency [4]. Additionally, the navigation equipments in the airport are required not to have the harmonic vibration for the antennae due to the environmental vibration as per the requirements from Civil Aviation Air Traffic Management Bureau in China.
Therefore, it is of great significance to determine the environmental vibration transmission characteristics of the airport due to the underpassing high-speed railway to provide the technical support for the anti-vibration design of the airport, and to ensure the operational safety of the air-rail combined transportation hub.
Fig. 1High-speed railway underpassing airport. (Note: The picture shown in Fig. 1 is provided by China Railway Eryuan Engineering Group Co. Ltd.)
Theoretically, the transmission of the environmental vibration due to the moving train is attributed to a three-dimensional problem allowing for the geometry irregularity of the track and tunnel to solve the problem of the boundary effect due to the artificial truncation and the time-consuming problem for the multiscale and multigrid calculations. Wang Lidong [5] et al. proposed a fast computation method used for the analysis of full scale three-dimensional random vibrations induced by railway traffic. Francois [6] et al. assumed that the track and soil layer are distributed uniformly along the longitudinal direction to make the Fourier transform to the frequency-wavenumber domain to generate the 2.5 dimensional calculation method. Degrande [7] et al. introduced the periodic finite element method to map the three-dimensional problem into a periodic element with a unit thickness to avoid the effect of the periodic support of track structure. Based on the calculation strategies mentioned above, the different kinds of numerical methods are widely applied to the calculation of the environmental vibration in recent years. For instance, Jin Qiyun [8] et al. and He Chao [9] et al. cross adopted the 2.5 dimensional calculation method and the finite element-boundary element coupling method to analyze the ground vibration from trains in tunnels. Germonpre [10] et al. applied the periodic method with the finite element-boundary element coupling method to analyze the railway induced vibration, while Cui Gaohang [11] et al. and Costa [12] et al. applied the 2.5 dimensional calculation method with the finite element-infinite element coupling method.
It has been known however that the theoretical and numerical approaches to analyze the environmental vibration are generally based on several simplifying assumptions and may be incapable of simulating all of the inherent complexities and uncertainties in soil behavior. The vibration data based on the actual measurements can reflect the environmental vibration characteristics most realistically and avoid the interference of the assumptions in simulation models on the evaluation results. Thus, the field tests are of significant value. The experts in the related fields have carried out some field test researches on the environmental vibration problems caused by the ordinary-speed railways, high-speed railways or subways. Xiao Guiyuan [13] et al. conducted a field test study on the environmental vibration characteristics of the buildings co-constructed with Shanghai Metro Line 10, and obtained the environmental vibration propagation law and frequency distribution characteristics. Sheng Tao [14] et al. in-situ measured the three-dimensional environmental vibrations induced by a shallow buried subway to analyze the vibration transferring characteristics between the tunnel and the open filed. Wang Xiangqiu [15] et al. analyzed the environmental vibration characteristics of the surrounding ground and buildings induced by the Wuhan-Guangzhou high-speed railway through the site test, and evaluated the impact of the environmental vibration based on the vibration control standards for the urban railway. Luo Jingfeng [16] conducted an experimental study on the environmental vibration level and attenuation law of an elevated simply-supported girder bridge with a high-speed train at the speed of 300 km/h passing through. Zheng Guochen [17] et al. measured the ground vibration under four conditions at a representative field with the overlapping section of metro and ground traffic to evaluate the impacts of environmental vibration by the comparison with the numerical results. Liu Weining [18] et al. applied the deep-hole excitation test to predict the impact of subway train on the environmental vibration. Liu Tao [19] measured and analyzed the ground environmental vibration response due to the running train against the underpassing-airport section of the intercity railway from Zhengzhou East Railway Station to the airport. Connolly [20, 21] et al. and Marshall [22] et al. conducted the field measurement and spectrum analysis of the environmental vibration due to the high-speed railway in Berlin and across Europe.
The above research is based on the field measurement of the operating high-speed railway and intercity railway, or on the test prediction of the low-speed subway. There isn’t any research on the environmental vibration transmission characteristics caused by the high-speed railway at the speed of 350 km/h at the beginning of the construction, especially based on the field test results for the high-speed railway.
The objective of this paper is to obtain the environmental vibration transmission law due to the high-speed railway at the speed of 350 km/h underpassing the airport from the perspectives of time and frequency domains by means of the field test approach, so as to provide the data support and design reference for the solution of environmental vibration problems due to the introductions of high-speed railways into the airport.
2. On-site in-situ test
2.1. Test method
The test includes input load in the tunnel and output response both in the tunnel and on the ground, as shown in Fig. 2. The load exciting the vibration of the track-tunnel-ground system is provided by means of the wheel-drop impact test. The vibration accelerations of the track, tunnel and ground constituting the vibration transmission path are picked up. The ground vibration both along the railway line and perpendicular to the railway line are taken into account in the test.
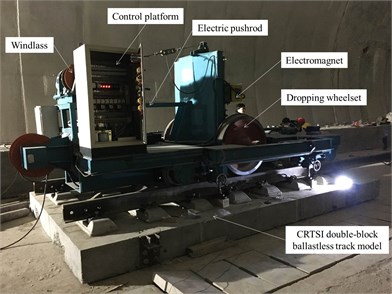
The wheel-drop impact test method is a common method to study the dynamic characteristics of the vibration system and determine the quality of the vibration performance [23]. A specific wheel-drop device [24, 25] shown in Fig. 3 is applied to freely drop the wheelset of the vehicle from the different heights to act the impact load on the track to excite the vibration of the track structure, tunnel foundation, surrounding soil, thus obtaining the vibration response of each part of the dynamic system. The dropping wheelset is connected to the electric pushrod which is used to adjust the horizontal position of the dropping wheelset. The dropping height of the wheelset is adjusted by the attraction of the electromagnet lifted by the windlass. The operations of the main components in the wheel-drop device mentioned above except the dropping wheelset are all connected to the control platform. After the wheel-drop device is lifted to a certain height, the wheelset alignment, lifting, measuring and wheel-drop height review are performed in sequence. The wheelset mass is 1020 kg. The wheel-rail vertical force is calculated based on the rail strain measured by the strain gages pasted on the rail after calibrating the relation between the rail strain and wheel-rail vertical force.
Fig. 2Framework of test method
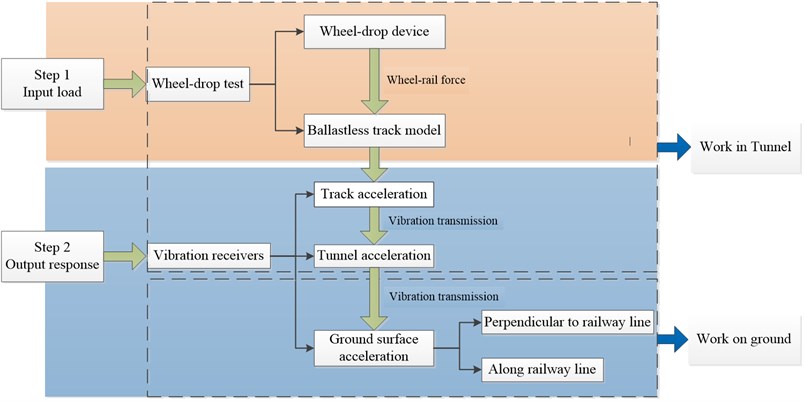
Fig. 3Wheel-drop device and track model inside tunnel. (Note: The photo was taken by Dai Feng in the tunnel of the Chengdu-Zigong high-speed railway at the Tianfu International Airport in November 2020)
The wheel-drop location and height are the key parameters for the wheel-drop test. The wheel-drop height reflects the wheel flat and the random irregularity on rail surface. The running flat wheel are the important factor leading to the wheel-rail impact, as shown in Fig. 4.
Fig. 4Running trace of flat wheel
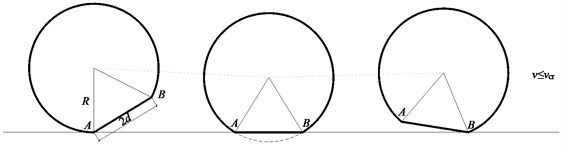
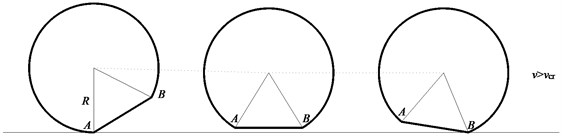
Under the condition of the low running speed of the flat wheel, the wheel rotates around the contact point on the rail surface. And the rail is impacted when the dropping height of the wheel center is equal to the depth of the flat wheel. While under the low speed condition, the wheel rotates and impacts the rail at the contact point , so the critical speed of the wheel leaving the rail [26, 27] is:
where denotes the critical speed; denotes the wheel radius; denotes (unsprung mass+sprung mass)/unsprung mass; denotes the acceleration of gravity.
When the wheel is impacting the rail, the vertical component of the impact speed is:
where denotes the coefficient for converting the rotational inertial of the wheelset to the reciprocating inertial mass; denotes the wheel flat length; denotes the train speed.
When the train speed is equal to the critical speed, the vertical impact speed reaches to the maximum, namely:
The maximum vertical impact speed is proportional to the flat length, the relationship between the wheel-drop height and the wheel flat length is determined by Eq. (4):
where denotes the wheel-drop height.
When there is the random irregularity on rail surface, the impact speed for the energy when the wheelset falling equal to the standard deviation of power for the running train is calculated by Eq. (5):
where denotes the coefficient that characterizes the power spectrum of the irregularity; denotes the constant.
2.2. Test outline
The on-site test site is located in the airport site of a large-scale air-rail combined transportation integrated transportation hub shown in Fig. 1, in which the high-speed railway at the speed of 350 km/h will underpass the airport runway and taxiing area. The tunnel is buried at the depth of 10 m in the ground consisting of three kinds of soil layers shown in Fig. 5. The mechanical performance parameters of the rock and soil around the tunnel are shown in Table 1.
The wheel-drop test site is far away from the high-speed railway section under construction. The test at night was conducted to avoid vibration interference sources such as the construction site nearby. With consideration of the fact that the track hasn’t been paved in the high-speed railway tunnel, a full-scale model of the CRTSI double-block ballastless track shown in Fig. 3 was cast in the tunnel. The track model consists of rails, fasteners, double-block sleepers and track slab. The length, width and height of the track slab model are 4.8 m, 2.8 m and 0.255 m respectively. The rails are installed on the double-block sleepers by the WJ-8 fasteners. In order to reduce the influence of boundary conditions, the wheel-drop position is set in the middle of the track slab. It is known that the high-speed trains of CRH380A are planned to operate on this high-speed railway. Based on Railway Technical Management Regulations, supposed that there is the wheel flat at the length of 30 mm existing for the train of CRH380A, the wheel-drop height is taken as 30 mm by Eq. (4) and (6).
Fig. 5Test site outline
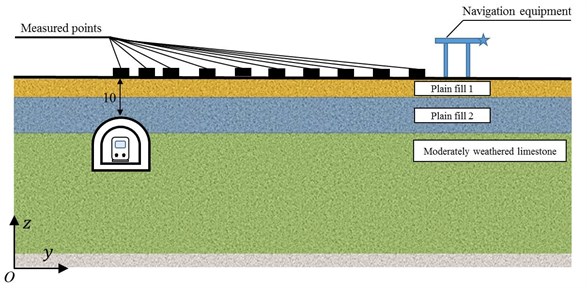
Table 1Parameters of mechanical properties of rock and earth mass
Soil layer | Thickness / m | Modulus of elasticity / MPa | Shear wave velocity / m/s | Compressional velocity / m/s | Poisson’s ratio | Density / kg/m3 |
Plain fill 1 | 5.0 | 184 | 120 | 848 | 0.35 | 1850 |
Plain fill 2 | 10.0 | 206 | 177 | 1172 | 0.35 | 1950 |
Moderately weathered limestone | 30.0 | 3000 | 295 | 2673 | 0.24 | 2350 |
2.3. Measured points arrangement
The measured points along the longitudinal and normal directions of the railway line on the ground, track surface and side wall in tunnel were arranged.
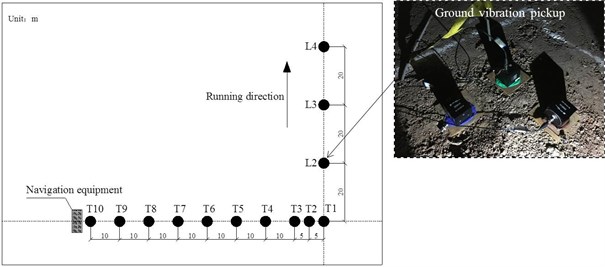
On the ground surface the measured points were distributed in the range between the tunnel and the navigation equipment on the ground horizontally closest to the tunnel as shown in Fig. 5. In detail, the ten measured points T1~T10 along the normal direction of the railway line horizontally started from the wheel-drop center, while the three measured points L2~L4 were at equal intervals along the railway line, see Fig. 6. The vibration pickups of type 991B for the longitudinal, lateral and vertical directions were arranged for each measured points on the ground surface.
Fig. 6Measured points on ground surface. (Note: The photos were taken by Dai Feng in the yard of the Tianfu International Airport that the Chengdu-Zigong high-speed railway underpasses in November 2020)
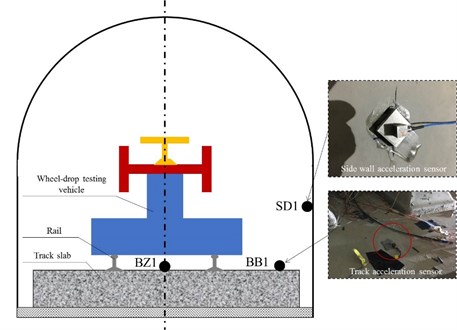
In order to account for the vibration transmission contributions from the track and tunnel finally to the ground for the whole dynamic system, the measured points BZ1 and BB1 on the track surface in tunnel were respectively arranged in the middle and at the side of the track slab along the central axis of the wheel-drop, while the measured point SD1 on the side wall of the tunnel was at the position of 1.5 m from the base at the same cross-section as the track measured points, see Fig. 7. The acceleration sensors of type 3145A and 3100D24 were adopted for the vertical acceleration test in tunnel.
Fig. 7Measured points inside tunnel. (Note: The photo was taken by Dai Feng in the tunnel of the Chengdu-Zigong high-speed railway at the Tianfu International Airport in November 2020)
3. Time-domain analysis
3.1. Wheel-rail vertical force
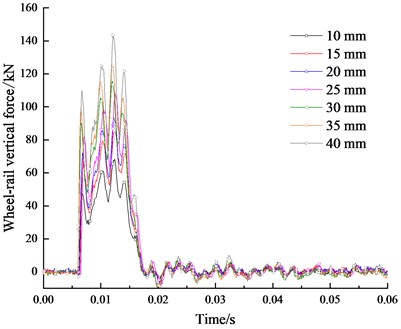
The wheel-rail force reflects the dynamic characteristics of the wheel-rail interaction and provides the initial dynamic conditions for the train-track-tunnel-soil system. The time-domain response of the wheel-rail vertical force directly below the cross-section of the wheel-drop is shown in Fig. 8 for the CRTS I double-block ballastless track system under the impact at the different wheel-drop heights. The wheel-rail vertical force is for the local source of excitation. The first peak of the wheel-rail vertical force denotes the transient impact force at the high frequency with the duration of about 2 ms. The amplitude of the wheel-rail vertical force ranges from 48 kN to 110 kN at the wheel-drop height from 10 mm to 40 mm. Due to the limitation of the track model length, there exist more peaks after 0.01 s. Compared with the existing research findings [28], the test results correspond to the measured and simulated wheel-rail vertical force obtained in the wheel-drop impact test.
Fig. 8Wheel-rail vertical force under wheel-drop impact load
3.2. Vibration response of measured points in tunnel
The vibration accelerations of the measured points in tunnel along the respective longitudinal (), lateral () and vertical () direction were analyzed. The variation trend of the vibration acceleration responses of the same measured point at the different wheel-drop heights is the same, so the average value of the two groups of test data at the wheel-drop height of 30 mm is taken as the corresponding peak vibration acceleration as shown in Fig. 9.
Fig. 9Vibration response of measured points inside tunnel
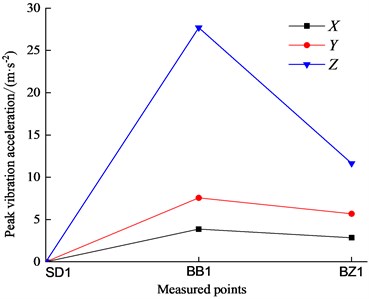
The vibration response of the track slab is significantly greater than that of the side wall in tunnel. The vibration response of the side wall in tunnel tends to zero, which shows that the effect of the impact load greatly attenuates along the lateral direction of the track slab towards the side wall in tunnel. Since the two ends of the track slab are freely unconstrained, the acceleration of the track slab at the side is significantly greater than that in the middle. The vertical peak vibration acceleration of the track slab is obviously larger than that in the other two directions, but attenuates the fastest.
3.3. Vibration response of measured points on ground
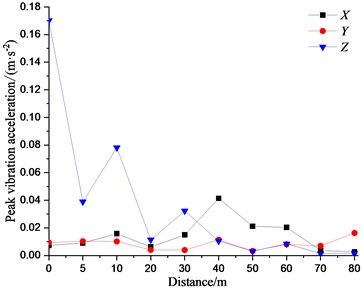
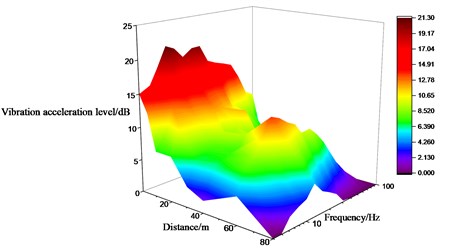
The peak vibration accelerations of the measured points on the ground are illustrated in Fig. 10. The vertical vibration response of the measured points along the direction perpendicular to the railway line at the distance of 40 m away from the centerline of the track is significantly larger than that in other two directions. There appears the vibration amplification area within 5-40 m with the maximum amplification rate of 6.8 times, which is due to the superposition effect of the incidence and reflection of the near-field body waves on the ground surface. The vibration responses of the measured points in the longitudinal direction is larger than that in other two directions within the range of 40-70 m. And there appear the local amplifications at different level within the respective range of 5-20 m and 30-60 m. The corresponding maximum amplification rate reaches to 6.7 times. The lateral vibration however dominates at 80 m. The three-dimensional vibration intensity of the measured points along the direction perpendicular to the railway line on the ground surface presents the different dominant changes within the different distance ranges.
The attenuation laws of the vibration responses for the measured points on the ground surface along the direction of the railway line are different in different directions. The vertical vibration response attenuates sharply within the range of 20 m away from the wheel-drop center, and then increases gradually. The peak vibration accelerations in the other two directions are basically in the same order of magnitude. And the peak vibration accelerations in the longitudinal direction largely increase within the range above 40 m.
Fig. 10Vibration response of measured points on ground surface
a) Along railway line
b) Perpendicular to railway line
4. Frequency-domain analysis
4.1. Vibration acceleration level of track measured points
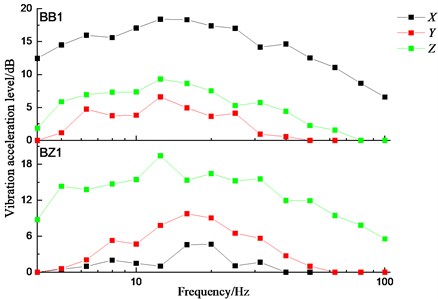
In order to quantitatively analyze the environmental vibration transmission and frequency-division vibration level of the airport under the impact load of the wheel-drop in tunnel, the 1/3 octave frequency analysis on the vibration signals in time domain was carried out. And the vibration acceleration level is calculated according to Eq. (7). The 1/3 octave vibration level spectra for the track measured points in tunnel is listed in Fig. 11. The distribution laws of the vibration level in frequency domain for the track slab in the middle and at the side are different. The vertical vibration level of the track slab in the middle is obviously larger than that in the other two directions. And the ratio of the vibration level in one direction to that in another direction for the three directions is up to 4.2 times. The smaller vibration levels in all the directions correspond to the narrower frequency range. The longitudinal vibration level of the track slab at the side is the maximum. And the ratio of the vibration level in one direction to that in another direction for the three directions is up to 2.8 times:
where denotes the RMS of the vibration acceleration; denotes the reference value of the acceleration.
Fig. 11Vibration acceleration level of track measured points
4.2. Vibration acceleration level of ground measured points
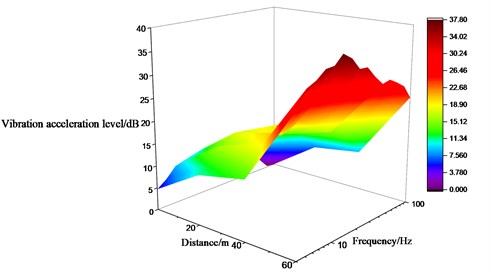
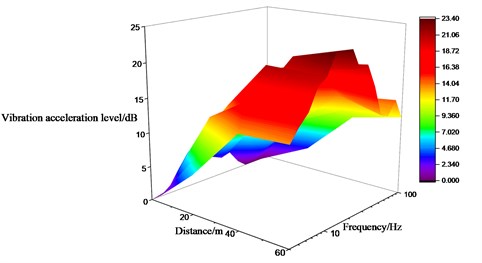
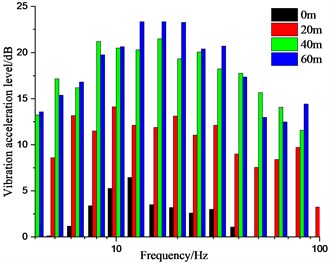
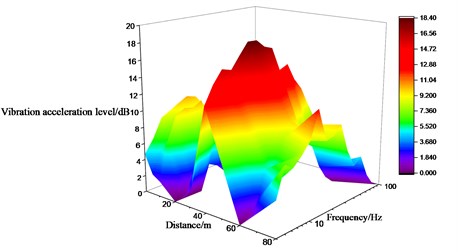
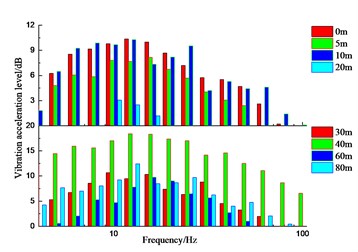
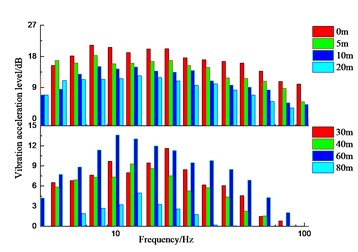
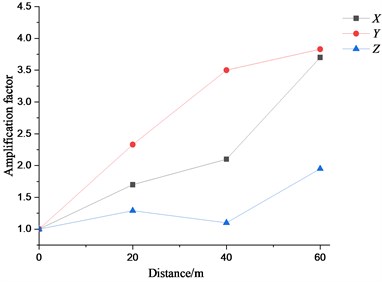
Figs. 12 to 14 summarize the 1/3 octave vibration acceleration level for the measured points on the ground surface along the direction of the railway line, while those along the direction perpendicular to the railway line are shown in Figs. 15 to 17. The longer distance from the wheel-drop center to the measured points along the direction of the railway line correspond to the larger longitudinal and lateral vibration level which gradually attenuates at about 15 Hz. The longitudinal and vertical vibration level increase sharply within the range of 40-60 m, while the lateral vibration level increase significantly within the range of 0-40 m. Detailedly in Table 2, the vertical vibration level is 1.1 times larger than the longitudinal one and 1.8 times larger than the lateral one respectively. The magnification factor of the longitudinal vibration level along the direction of the railway is larger than that of the lateral and vertical ones. The vertical vibration level of the measurement point L4 increased slightly at 5 Hz, 12.5 Hz and 31.5 Hz, which indicates that those frequencies are the sensitive frequencies for the vertical vibration of the airport ground.
Table 2Maximum vibration level of measured points on ground surface along railway line
Number of measured points | Maximum vibration level / dB | Amplification coefficient | ||||
X | Y | Z | X | Y | Z | |
T1 | 10 | 6 | 21 | 1.00 | 1.00 | 1.00 |
L2 | 17 | 14 | 27 | 1.70 | 2.33 | 1.29 |
L3 | 21 | 21 | 23 | 2.10 | 3.50 | 1.10 |
L4 | 37 | 23 | 41 | 3.70 | 3.83 | 1.95 |
Fig. 12Vibration acceleration level in X direction of measured points on ground surface along railway line
a) Variation tendency
b) Amplitude distribution
Fig. 13Vibration acceleration level in Y direction of measured points on ground surface along railway line
a) Variation tendency
b) Amplitude distribution
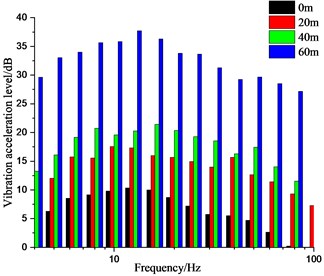
Fig. 14Vibration acceleration level in Z direction of measured points on ground surface along railway line
a) Variation tendency
b) Amplitude distribution
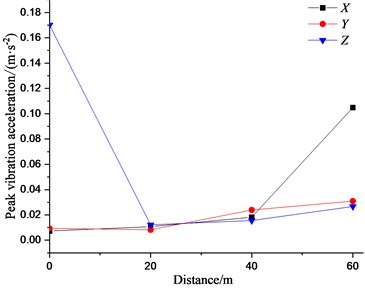
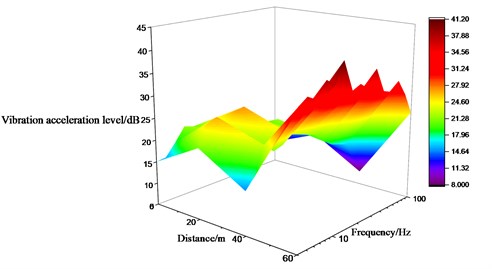
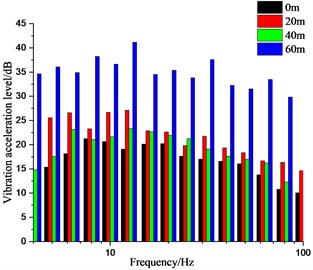
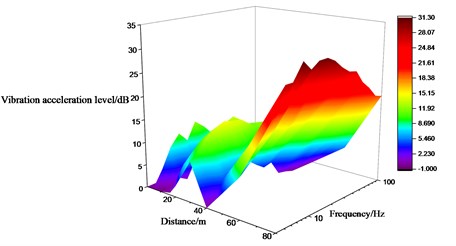
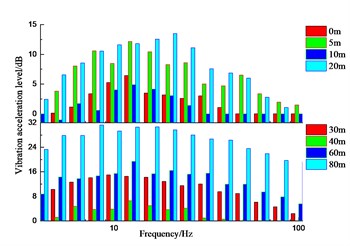
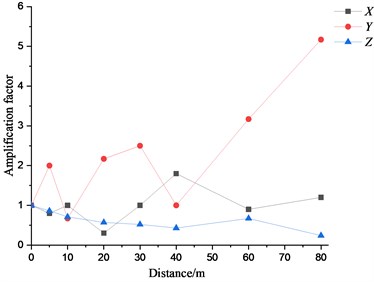
It can be seen from Figs. 15 to 17 as well as Table 3 that the variation law of the measured points along the direction perpendicular to the railway line on the ground is different. The lateral vibration level gradually increases along the direction perpendicular to the railway line, but attenuates at the distance of 10 m and 40 m away from the wheel-drop center to different extent. It attenuates the most about 0.67 times of the original. The vertical vibration level gradually decreases along the direction perpendicular to the railway line, but amplifies at the distance of 60 m away from the wheel-drop center. The longitudinal vibration level attenuates the most to 0.3 times of the original at the distance of 20 m, but amplifies to 1.8 times of the original at the distance of 40 m. And the longitudinal vibration level doesn’t obviously change with the distance. The longer distance away from the wheel-drop center corresponds to the narrow frequency range for the vertical vibration on the ground. The vibrations at the low and high frequencies move towards the intermediate frequencies.
Fig. 15Vibration acceleration level in X direction of measured points on ground surface along direction perpendicular to railway line
a) Variation tendency
b) Amplitude distribution
Fig. 16Vibration acceleration level in Y direction of measured points on ground surface along direction perpendicular to railway line
a) Variation tendency
b) Amplitude distribution
Fig. 17Vibration acceleration level in Z direction of measured points on ground surface along direction perpendicular to railway line
a) Variation tendency
b) Amplitude distribution
Moreover, the vibration level of the measured points along the railway line on the ground attenuates above 80 Hz, see Fig. 18. The vertical vibration level increases with the further distance within a smaller range than that in the other two directions, see Fig. 19. The lateral vibration level is more sensitive to the distance change and increases most sharply. The maximum vibration level occurs in the lateral direction for the measured points along the direction perpendicular to the railway line. The later vibration level attenuates above 50 Hz regardless of the distance. The sensitive frequency for the vertical vibration level occurs at 5 HZ, 12.5 Hz, 25 Hz and 80 Hz.
Table 3Maximum vibration level of measured points on ground surface along direction perpendicular to railway line
Number of measured points | Maximum vibration level / dB | Amplification coefficient | ||||
X | Y | Z | X | Y | Z | |
T1 | 10 | 6 | 21 | 1.00 | 1.00 | 1.00 |
T2 | 8 | 12 | 18 | 0.80 | 2.00 | 0.86 |
T3 | 10 | 4 | 15 | 1.00 | 0.67 | 0.71 |
T4 | 3 | 13 | 12 | 0.30 | 2.17 | 0.57 |
T5 | 10 | 15 | 11 | 1.00 | 2.50 | 0.52 |
T6 | 18 | 6 | 9 | 1.80 | 1.00 | 0.43 |
T8 | 9 | 19 | 14 | 0.90 | 3.17 | 0.67 |
T10 | 12 | 31 | 5 | 1.20 | 5.17 | 0.24 |
Fig. 18Vibration level differences relative to T1
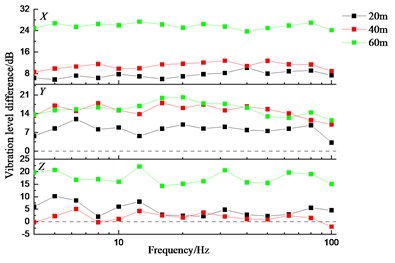
a) Along railway line
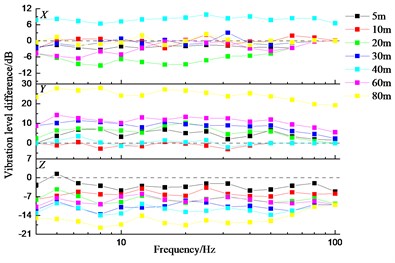
b) Perpendicular to railway line
Fig. 19Vibration level amplification coefficient relative to T1
a) Along railway line
b) Perpendicular to railway line
It can be inferred from the analysis above that the vertical vibration of the airport ground induced by the underpassing high-speed railway should be paid close attention to with the horizontal distance of 0-30 m away from the high-speed railway centerline, while the longitudinal vibration should be taken into full consideration within 40-70 m. The local amplification for the vertical vibration at 10 m and 30 m from the high-speed railway centerline as well as that for the longitudinal vibration 40 m and 60 m should be observed carefully while placing the necessary precise instruments on the airport ground. In terms of the operation of the precise instruments, the vibration of the precise instruments due to the underpassing high-speed railway should be avoided at the sensitive frequency of 5 Hz, 12.5 Hz, 25Hz, 31.5 Hz and 80 Hz for the ground vibration. For the navigation equipment in this site, the necessity of the lateral vibration prohibition can be investigated further.
5. Conclusions
1) The vertical ground vibration response along the railway line largely attenuates within the range of 20 m, while the longitudinal vibration response large increases away from the location of 40 m.
2) The vertical ground vibration response along the direction perpendicular to the railway line is larger than that of the other two directions within the range of 40 m away from the wheel-drop center. And there exists the vibration amplification zone within the range of 5-40 m. The longitudinal vibration response of the ground surface is greater than those of the other two directions within 40-70 m. There is also the local amplification zones for the longitudinal vibration response within the range of 5-20 m and 30-60 m.
3) The longitudinal and lateral vibration levels of the ground surface increase gradually along the railway line, but attenuate gradually at about 15 Hz. The longitudinal and vertical vibration levels largely increase within 40-60 m, while the lateral vibration level substantially increase within 0-40 m.
4) The lateral vibration level of the ground surface increase gradually along the direction perpendicular to the railway line, but attenuates at the distance of 10 m and 40 m with the maximum attenuation rate of 0.67. The vertical vibration level amplifies at the distance of 60 m. The longitudinal vibration level attenuates at the distance of 20 m with the maximum attenuation rate of 0.3, but amplifies at the distance of 40 m with the maximum amplification rate of 1.8.
References
-
X. L. Zhou, “Discussion on the design of air-Rail intermodal transportation and the introduction of high-speed railways into airports,” (in Chinese), Railway Standard Design, Vol. 64, No. 3, pp. 6–11, 2020.
-
K. L. Xue et al., “Discussion on the mode of high-speed railway entering airport,” (in Chinese), Civil Airports, No. 2, pp. 72–77, 2019.
-
H. Xia, Traffic Induced Environmental Vibrations and Controls. (in Chinese), Beijing: Science Press, 2010.
-
C. L. Sun, “Prediction and control study on environmental vibration of underground lines in high-speed railways,” (in Chinese), Beijing Jiaotong University, Beijing, 2020.
-
L. Wang, Z. Zhu, Y. Bai, Q. Li, P. A. Costa, and Z. Yu, “A fast random method for three-dimensional analysis of train-track-soil dynamic interaction,” Soil Dynamics and Earthquake Engineering, Vol. 115, pp. 252–262, Dec. 2018, https://doi.org/10.1016/j.soildyn.2018.08.021
-
S. François, M. Schevenels, P. Galvín, G. Lombaert, and G. Degrande, “A 2.5D coupled FE-BE methodology for the dynamic interaction between longitudinally invariant structures and a layered halfspace,” Computer Methods in Applied Mechanics and Engineering, Vol. 199, No. 23-24, pp. 1536–1548, Apr. 2010, https://doi.org/10.1016/j.cma.2010.01.001
-
G. Degrande et al., “A numerical model for ground-borne vibrations from underground railway traffic based on a periodic finite element-boundary element formulation,” Journal of Sound and Vibration, Vol. 293, No. 3-5, pp. 645–666, Jun. 2006, https://doi.org/10.1016/j.jsv.2005.12.023
-
Q. Jin, D. J. Thompson, D. E. J. Lurcock, M. G. R. Toward, and E. Ntotsios, “A 2.5D finite element and boundary element model for the ground vibration from trains in tunnels and validation using measurement data,” Journal of Sound and Vibration, Vol. 422, pp. 373–389, May 2018, https://doi.org/10.1016/j.jsv.2018.02.019
-
C. He, S. Zhou, P. Guo, H. Di, and X. Zhang, “Modelling of ground vibration from tunnels in a poroelastic half-space using a 2.5-D FE-BE formulation,” Tunnelling and Underground Space Technology, Vol. 82, pp. 211–221, Dec. 2018, https://doi.org/10.1016/j.tust.2018.08.043
-
M. Germonpré, G. Degrande, and G. Lombaert, “Periodic track model for the prediction of railway induced vibration due to parametric excitation,” Transportation Geotechnics, Vol. 17, pp. 98–108, Dec. 2018, https://doi.org/10.1016/j.trgeo.2018.09.015
-
G. H. Cui, H. R. Ouyang, and X. X. Tao., “Semi-analytical finite element method for ground environment vibration responses along urban rail,” (in Chinese), Journal of Vibration and Shock, Vol. 38, No. 15, pp. 109–114, 2019.
-
P. Alves Costa, R. Calçada, A. Silva Cardoso, and A. Bodare, “Influence of soil non-linearity on the dynamic response of high-speed railway tracks,” Soil Dynamics and Earthquake Engineering, Vol. 30, No. 4, pp. 221–235, Apr. 2010, https://doi.org/10.1016/j.soildyn.2009.11.002
-
G. Y. Xiao et al., “In-situ experiment and analysis of train-induced vibration characteristics of jointly-built structure of subway and buildings,” (in Chinese), Journal of the China Railway Society, Vol. 37, No. 5, pp. 88–93, 2015.
-
T. Sheng et al., “In-situ measurement and analysis of subway vibration’s transmission and the influence to nearby buildings,” (in Chinese), Journal of Tongji University (Natural Science), Vol. 43, No. 1, pp. 54–59, 2015.
-
D. P. Connolly, G. Kouroussis, P. K. Woodward, P. Alves Costa, O. Verlinden, and M. C. Forde, “Field testing and analysis of high speed rail vibrations,” (in Chinese), Soil Dynamics and Earthquake Engineering, Vol. 67, No. 3, pp. 102–118, Dec. 2014, https://doi.org/10.1016/j.soildyn.2014.08.013
-
J. F. Luo, “Ground vibration test study on viaduct bridge of high-speed railway in soft soil area,” (in Chinese), Railway Investigation and Surveying, No. 2, pp. 115–118, 2018.
-
G. C. Zheng et al., “Field measurement and numerical simulation on environmental and vibration effects induced by metro and ground traffic loads,” (in Chinese), China Environmental Science, Vol. 40, No. 9, pp. 4146–4154, 2020.
-
W. N. Liu et al., “Prediction method of measured deep-hole excitation transfer function for environmental influence of metro train-induced vibration,” (in Chinese), China Civil Engineering Journal, Vol. 50, No. 9, pp. 82–89, 2017.
-
T. Liu, “Analysis and numerical simulation of ground vibration caused by underground rail transit,” (in Chinese), North China University of Water Resources and Electric Power, Zhengzhou, 2019.
-
D. P. Connolly, G. Kouroussis, P. K. Woodward, P. Alves Costa, O. Verlinden, and M. C. Forde, “Field testing and analysis of high speed rail vibrations,” Soil Dynamics and Earthquake Engineering, Vol. 67, No. 12, pp. 102–118, Dec. 2014, https://doi.org/10.1016/j.soildyn.2014.08.013
-
D. P. Connolly, P. Alves Costa, G. Kouroussis, P. Galvin, P. K. Woodward, and O. Laghrouche, “Large scale international testing of railway ground vibrations across Europe,” Soil Dynamics and Earthquake Engineering, Vol. 71, pp. 1–12, Apr. 2015, https://doi.org/10.1016/j.soildyn.2015.01.001
-
T. Marshall, B. A. Fenech, and R. Greer, “Derivation of sound emission source terms for high speed trains running at speeds in excess of 300 km/h,” in Notes on Numerical Fluid Mechanics and Multidisciplinary Design, pp. 497–504, 2015, https://doi.org/10.1007/978-3-662-44832-8_58
-
S. L. Lian, W. Z. Yang, and Y. Liu, “Test of dynamic behavior of the track structures with different types of sleepers,” (in Chinese), Journal of the China Railway Society, Vol. 32, pp. 131–136, 2010.
-
M. Wang, C. Cai, S. Zhu, and W. Zhai, “Experimental study on dynamic performance of typical nonballasted track systems using a full-scale test rig,” Proceedings of the Institution of Mechanical Engineers, Part F: Journal of Rail and Rapid Transit, Vol. 231, No. 4, pp. 470–481, Apr. 2017, https://doi.org/10.1177/0954409716634751
-
C. J. Pei, X. L. Song, and T. H. Lv, “Full-scale model impacting experiments and numerical analysis on CRTSⅢ ballastless track-subgrade system,” (in Chinese), Journal of Railway Science and Engineering, Vol. 14, No. 3, pp. 425–436, 2017.
-
P. R. Zhao, “Research on the design theory and method for ballastless track on passenger dedicated line,” (in Chinese), Southwest Jiaotong University, Chengdu, 2008.
-
W. M. Zhai, “Vehicle-Track Coupling Dynamics,” (in Chinese), Beijing, China: Science Press, 2007.
-
L. X. Bi et al., “Practical calculation formula for vertical wheel/rail impact load of ballastless track,” (in Chinese), China Railway Science, Vol. 41, No. 6, pp. 20–29, 2020.
About this article

The research was supported by the Key R&D Project of Sichuan Province (Grant No. 2019YFG0040) and the Research Fund from Shudao Investment Group Co., Ltd (Grant No. KSWQ203002).
The datasets generated during and/or analyzed during the current study are available from the corresponding author on reasonable request.
The authors declare that they have no conflict of interest.
