Abstract
An adaptive denoising method based on 2D empirical mode decomposition (EMD) is proposed to improve the infrared image quality of inspection UNMANNED aerial vehicles (UAVs) and provide guarantee for improving the inspection level of distribution network. Through rapid adaptive two-dimensional empirical mode decomposition algorithm decomposition of a UAV collected for distribution network inspection original noise of infrared image, get more than the IMF component and the residual amount, a forecast noise dominated the IMF component parameters such as threshold value and the variance of noise, using the estimated parameters in combination with the optimal linear interpolation algorithm of noise threshold function of leading the IMF component implementation of threshold denoising. After the denoised IMF component is obtained, the denoised infrared image is obtained after reconstruction with the signal-dominated IMF component, and the adaptive denoising of the infrared image of the distribution network inspection UAV is realized. The experimental results show that the method in this paper can maintain the details of the image, improve the definition, significantly improve the visual effect, the overall denoising performance is stable and feasible, and ensure the quality inspection UAV to collect infrared images.
Highlights
- The adaptive two-dimensional empirical mode is used to decompose the infrared image of distribution network inspection noise and predict the parameters such as noise IMF component threshold.
- Combine with that optimal linear interpolation algorithm, the IMF component dominated by the noise threshold function is denoise to obtain the denoised IMF component.
- Reconstruct the IMF component to obtain the denoised infrared image, and realize the adaptive denoising of the infrared image of the distribution network inspection UAV.
1. Introduction
In the process of distribution network expansion, distribution network equipment and lines gradually increase. At the same time, the inspection workload of distribution network is also increasing gradually. In addition, due to the remote mountainous terrain and bad weather environment and other factors, leading to manual inspection needs a large number of human support. And the patrol work efficiency low risk is high, if not timely patrol inspection to distribution network equipment and line fault. Will affect the smooth and safe operation of the distribution network, and even bring major safety accidents [1, 2]. In order to solve the above problems, each distribution network will be applied to the UAV distribution network equipment and line inspection work. Through reasonable application of UAV and artificial intelligence, the problems of heavy workload and low efficiency can be solved effectively. And can effectively reduce the risk of manual inspection. At the same time will effectively reduce the incidence of distribution network accidents [3]. In the inspection process of UAV, the noise of the infrared image of the equipment and line is easy to exist, which affects the visual presentation of the image. In order to ensure the tracking quality of UAV, it is necessary to select appropriate methods to remove the noise in the infrared image of UAV and improve the quality of infrared image [4].
Two-dimensional empirical mode decomposition (BEMD) is an adaptive image decomposition algorithm, which can decompose the image into multiple sub-images and one residual term. The sub-images are arranged in order from high frequency to low frequency. Usually, the noise is in the high-frequency sub-images [5, 6]. This algorithm is widely used in image fusion, denoising and analysis for its good decomposition effect. Fast adaptive bidimensional empirical mode decomposition (FABEMD) algorithm is implemented on the basis of BEMD algorithm [7], which can effectively improve the efficiency and complexity of BEMD algorithm. Based on the traditional image fusion algorithm, the color space IHS transform and lifting wavelet transform are combined according to the characteristics of UAV imaging equipment [8]. This algorithm not only keeps the brightness information of infrared target, but also has good robustness. A method of automatic detection of hot spots based on deep learning is proposed, which locates hot spots through data expansion. Models based on deep learning can extract hot features through training processes in data sets [9]. The numerical results of the algorithm prove the accuracy and accuracy of the model.
Based on the above analysis, an adaptive infrared image denoising method for UAV based on 2D empirical mode decomposition is studied in this paper. By combining the FABEMD algorithm with the optimal linear interpolation threshold function algorithm, the adaptive denoising of UAV infrared image is realized. On the premise of preserving the detail features of the original infrared image, the clarity of the infrared image is improved significantly. To ensure the quality of patrol work, safe and stable operation of distribution network to provide scientific support.
2. Adaptive denoising of infrared image of UAV for distribution network inspection
2.1. Fast adaptive two-dimensional empirical mode decomposition algorithm
Fast adaptive 2D empirical mode decomposition (FABEMD) is obtained based on 2D empirical mode decomposition. It improves the computational complexity and efficiency of 2D empirical mode decomposition, and realizes accurate and fast decomposition of infrared images with different resolutions and sizes. The noisy infrared image is decomposed into several IMF components by FABEMD algorithm. The components are arranged from high frequency to low frequency, and the components are nearly orthogonal. At the same time, the trend of infrared image is presented by residual quantity [10]. Assume that the source infrared image acquired by the UAV in the distribution network is represented by , in which , . A represents the number of rows of the infrared image, and B represents the number of columns of the infrared image. The FABEMD algorithm process is:
The residue after FABEMD is set to . The input data is expressed as . Order:
In Eq. (1), the number of decomposition layers of an infrared image is expressed as . The number of times to enter data is expressed in . The trend infrared image decomposed by layer is represented by . If the number of times you enter data is 1, , perform the filter.
The morphological method is used to perform operations on the local extreme points of the source infrared image , and the local minimum and maximum point sets are obtained.
After the plane interpolation of the two point sets is implemented sequentially, the upper envelope surface of the infrared image is represented by , the lower envelope surface is represented by , and the envelope mean of the infrared image is calculated based on the two envelope surfaces, which is expressed as:
By subtracting the infrared image envelope mean from the input data , the remaining amount of data is obtained, namely:
In Eq. (3), the remaining amount of data is represented by . The discriminating on whether the remaining data quantity belongs to the IMF is based on the criterion that if the infrared image envelope mean is less than the set threshold , then the th two-dimensional IMF is the remaining data quantity, that is, , and vice versa, make and jump to step (1).
The above screening steps can reach the termination condition 0.2 to perform the verdict, if this condition cannot be reached, you can jump to step (1), otherwise terminate the filter. The formula for the termination condition is:
The remainder is solved, and if the number of IMFs obtained by decomposition I does not meet the requirements, it jumps to step (2) so that .
If has completed the decomposition of the number of layers or monotonic, then the FABEMD algorithm can be terminated. The obtained two-dimensional decomposition formula is:
In Eq. (5), the number of two-dimensional decomposition layers is expressed in .
2.2. Noise parameter estimation
2.2.1. Bayesian-based noise figure prediction
After the FABEMD algorithm decomposes the infrared image of the UAV source of the distribution network inspection, the coefficient of the noise-dominant sub-band can be estimated by using Bayesian maximum posterior to achieve the purpose of denoising [11]. Let the infrared image after adding Gaussian noise be represented by , and its expression is:
In Eq. (6), Gaussian noise is denoted by ; Source infrared images without Gaussian noise are represented by . After decomposition by FABEMD algorithm, the obtained decomposition coefficients can be expressed as:
After the decomposition of the low frequency sub-band in the image information more, and the high frequency band in the noise is more, through Bayesian estimation to achieve the purpose of denoising, that is, based on the known coefficient d, the implementation of g estimate, so that the maximum posterior probability value to reach the highest, that is:
In Eq. (8), the probability distribution of noise is expressed as ; The noise-free prior distribution is represented by . Because noise follows a Gaussian distribution with a variance of and a mean of 0, therefore:
Drawing into Eq. (9) within Eq. (8), taking the logarithm of the independent variable, then Eq. (8) can be expressed as:
In Eq. (10), . Calculating the first derivative of the equation yields:
Because is singular and not persistent around the zero point, the estimated results at this point are not accurate enough. To this end, the new estimation method designed on this basis is:
The O in Eq. (12) may be expressed as:
In Eq. (13), the scale parameters are represented by ; The second type of modified Bezier function is represented by ; The eigenfactors that control the rate of decay of the distribution are expressed in , and the lower this value indicates that the decay rate is slower, and the smearing phenomenon is more severe.
2.2.2. Noise threshold and variance estimation
One common type of treatment method in image denoising problems is threshold technology, including hard threshold and soft threshold. The processing effect of the hard threshold is not as good as the soft threshold, and the effect of the soft threshold for the large factor is not ideal. To this end, the optimal linear interpolation threshold function is selected to implement the processing of coefficients [12], that is, the optimal linear interpolation between the coefficients and their relative subband averages is used to achieve the adjustment of the coefficients, that is:
In Eq. (14), the size of the threshold is expressed in , and can be derived according to Eq. (12) and Eq. (13); The mean value of the sub-band decomposition coefficient is expressed as ; The formula for is:
In Eq. (15), the variance of the pure noise figure is expressed as A. The pure noise variance of each IMF can be estimated using the Monte Carlo method [13, 14] as follows:
(1) Quadrature wavelet transforms the noisy infrared image, and estimates the standard deviation of the noise by the robust median estimation method, that is:
In Eq. (16), the first diagonal wavelet band after the wavelet transform is represented by ; The standard deviation of the noise is expressed as .
(2) A pure noise infrared image is generated, the variance of the infrared image is , the mean is 0, and the size of the homologous infrared image coincides
(3) After decomposing the pure noise infrared image by FABEMD, the pure noise figure variance dominated by each noise is obtained, which is represented by .
(4) After performing the two steps (2) and (3) several times, the mean of the results of several executions is calculated, which is the pure noise figure variance obtained.
In the process of infrared image denoising, if the variance of the noisy infrared image is unknown, the variance of the infrared image can be estimated first, and on this basis, the variance of the coefficient after pure noise decomposition is calculated; Conversely, step (1) can be omitted and the operation is directly performed on the variance of each IMF after pure noise decomposition.
2.3. Infrared image denoising based on FABEMD
The denoising process of FABEMD-based infrared images is:
1) Decompose the noisy infrared image by FABEMD algorithm to obtain several IMF components and residual amounts;
2) The parameters , , , and threshold with noise as the dominant component in each IMF component obtained by operation;
3) The application of Eq. (14) implements threshold denoising, reconstructs the various components dominated by signal and noise after denoising, acquires the denoising infrared image, and realizes the adaptive denoising of the infrared image of the UAV in the distribution network.
3. Applied results analysis
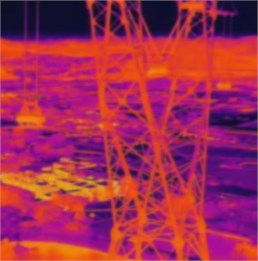
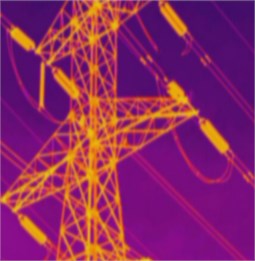
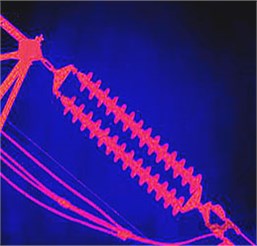
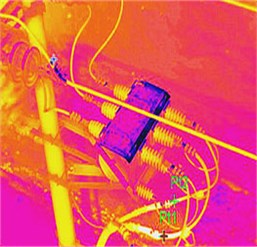
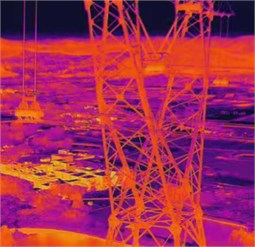
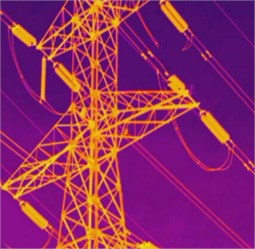
Four infrared images (A~D) were selected as experimental images from the infrared images collected by a distribution network company's inspection UAV, of which the noise of infrared images A and B is more serious, and the noise of the two infrared images of C and D is relatively small, and the outline is relatively clear. Four original experimental infrared images are shown in Fig. 1.
Fig. 1Original experimental infrared image
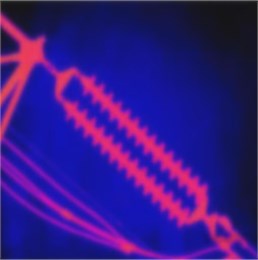
a) Infrared image A
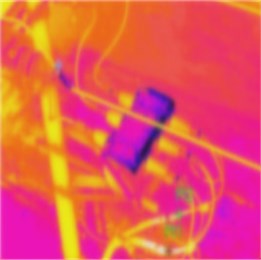
b) Infrared image B
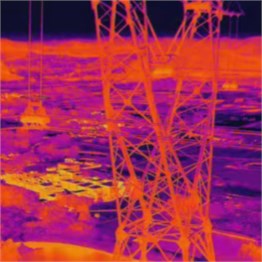
c) Infrared image C

d) Infrared image D
Fig. 2Infrared image C and D effects with Gaussian noise added
a) Infrared image C
b) Infrared image D
Fig. 3Four infrared images are presented after denoising by methods of this document
a) Infrared image A
b) Infrared image B
c) Infrared image C
d) Infrared image D
In order to test the practical application effect of the proposed method, the standard deviation of 23 and the mean of the Gaussian noise of the infrared image C and D with relatively high clarity are added sequentially, and the original infrared images A and B and the infrared images C and D after the addition of Gaussian noise are denoised, respectively. The infrared image C and D renderings after adding Gaussian noise are shown in Fig. 2.
The methods of literature [6] and literature [7] are used to compare with the methods of this paper, and the effect of the four infrared images after denoising by different methods is shown in Fig. 3-5.
Fig. 4Four infrared images are presented after denoising by Literature [6] method
![Four infrared images are presented after denoising by Literature [6] method](https://static-01.extrica.com/articles/23010/23010-img11.jpg)
a) Infrared image A
![Four infrared images are presented after denoising by Literature [6] method](https://static-01.extrica.com/articles/23010/23010-img12.jpg)
b) Infrared image B
![Four infrared images are presented after denoising by Literature [6] method](https://static-01.extrica.com/articles/23010/23010-img13.jpg)
c) Infrared image C
![Four infrared images are presented after denoising by Literature [6] method](https://static-01.extrica.com/articles/23010/23010-img14.jpg)
d) Infrared image D
It can be seen from Figs. 3-5 that the details of the four images processed by this method are clear, while the details of the four images processed by literature [6] and literature [7] are relatively vague. It can be seen from the comparison that the method proposed in this paper can effectively remove the original noise of the infrared image and the Gaussian noise added later, improve the definition of the image, improve the visual presentation effect of the original infrared image, completely retain the details of the image, and improve the overall quality of the infrared image. It shows that the image detail processed by this method is the best and the denoising effect is the best.
In order to further test the feasibility of this method, three objective evaluation indicators of peak signal-to-noise ratio, structural similarity index and mean squared deviation of the image are selected to objectively evaluate the denoising effect of this method. Among them, the peak signal-to-noise ratio is expressed as PS, the structural similarity index is expressed as SS, the mean squared difference is expressed in MS, and the operation formula of the peak signal-to-noise ratio PS and the mean squared MS is:
In Eq. (17), the denoising infrared image is represented by .
Fig. 5Four infrared images are presented after denoising by literature [7] method
![Four infrared images are presented after denoising by literature [7] method](https://static-01.extrica.com/articles/23010/23010-img15.jpg)
a) Infrared image A
![Four infrared images are presented after denoising by literature [7] method](https://static-01.extrica.com/articles/23010/23010-img16.jpg)
b) Infrared image B
![Four infrared images are presented after denoising by literature [7] method](https://static-01.extrica.com/articles/23010/23010-img17.jpg)
c) Infrared image C
![Four infrared images are presented after denoising by literature [7] method](https://static-01.extrica.com/articles/23010/23010-img18.jpg)
d) Infrared image D
The method of this paper is used to repeat the denoising experiment 5 times for the two original infrared images A and B, and the three index values of PS, SS and MS of the two infrared images after multiple denoising experiments are counted, and the stability of the proposed method is tested by analyzing the changes of the index values. The results obtained are shown in Fig. 6.
Fig. 6The change of the indicator values of the two images A and B after multiple denoising
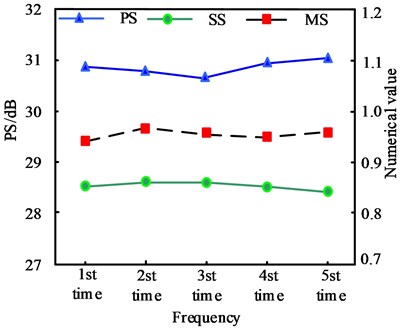
a) Infrared image A indicator value change
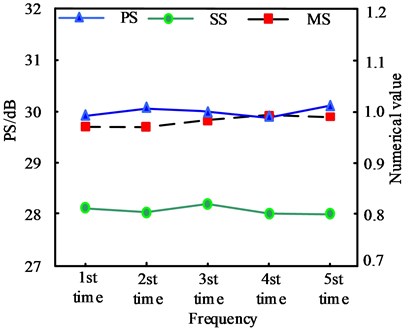
b) Infrared image B indicator value change
It can be seen from Fig. 6 that after 5 times of denoising of the method in this paper, the three indicator values of PS, SS and MS of the two infrared images A and B have not fluctuated too much, of which the highest fluctuation values of the three indicators of image A are 0.38 dB, 0.011, 0.018, etc., of which the highest fluctuation values of the three indicators of image B are 0.15 dB, 0.018, 0.016 in turn, which shows that the denoising performance of the method in this paper is stable and the denoising result has a high degree of credibility.
The Gaussian noise of different sizes with a mean of 0 and a standard deviation of 8, 13, 18, 23, 28, 33 and 48 is added to the two infrared images of C and D, and the denoising is implemented sequentially by using the method of this paper, and the PS, SS and MS of each image after the denoising method of this paper are counted, and the statistical results obtained are shown in Table 1.
Table 1Statistics of index values after denoising of Gaussian noise infrared images of different sizes
Infrared image numbering | Add Gaussian noise standard deviation | Noisy image PS/dB | Denoisseurized image metric values | ||
PS/dB | SS | MS | |||
C | 8 | 29.25 | 34.98 | 0.884 | 0.784 |
13 | 25.72 | 32.32 | 0.821 | 0.806 | |
18 | 23.22 | 31.22 | 0.794 | 0.851 | |
23 | 21.29 | 30.36 | 0.767 | 0.882 | |
28 | 19.72 | 29.54 | 0.729 | 1.103 | |
33 | 17.53 | 28.13 | 0.711 | 1.308 | |
48 | 15.27 | 27.82 | 0.677 | 1.891 | |
D | 8 | 29.45 | 36.47 | 0.917 | 0.658 |
13 | 25.97 | 34.56 | 0.902 | 0.792 | |
18 | 23.51 | 33.03 | 0.871 | 0.787 | |
23 | 21.46 | 31.96 | 0.844 | 0.842 | |
28 | 19.89 | 31.13 | 0.823 | 0.866 | |
33 | 17.68 | 29.85 | 0.811 | 1.056 | |
48 | 15.55 | 28.92 | 0.782 | 1.295 | |
Analysis Table 1 shows that with the increase of the standard deviation of Gaussian noise, the peak signal-to-noise ratio of two infrared images shows a downward trend. After the denoising process in this paper, the peak signal-to-noise ratio of two infrared images with different sizes of Gaussian noise increases significantly. The higher the PSNR, the better the denoising effect. Among them, the average PSNR of image C is 30.624, and the average PSNR of image D is 32.274. After denoising, the structure similarity index of the two images is high, and the mean square deviation is small. The average values of the two indicators of image C are 0.769 and 1.089 respectively, and the average values of the two indicators of image D are 0.850 and 0.899 respectively. It can be seen that after denoising by this method, the structure similarity of the two denoised images is high, and the mean square error is small, which shows that the two infrared images after denoising by this method still retain the details of the original image, and the comprehensive denoising effect is ideal and feasible.
4. Conclusions
In order to improve the work efficiency of the daily inspection of the distribution network, the UAV is gradually applied to the daily inspection work by the distribution network companies, and the quality of the infrared image collected in the inspection UAV work directly affects the quality of the inspection work, therefore, in order to improve the quality of the infrared image collected by the inspection UAV, research on an adaptive denoising method for the infrared image of the UAV based on two-dimensional experience modal decomposition. The rapid adaptive two-dimensional empirical modal decomposition algorithm is used to decompose the original noise-containing infrared image collected by the distribution network inspection UAV, obtain multiple IMF components and a residual quantity, estimate the parameters such as the threshold and variance of the noise-based high-frequency IMF component noise, use the estimated parameters combined with the optimal linear interpolation threshold function algorithm to implement threshold denoising, and reconstruct the IMF component after each denoising and the signal-based IMF component to obtain the denoising infrared image. Complete the distribution network inspection UAV infrared image adaptive denoiseration. The practical results show that this method can effectively remove the noise of infrared image, and the details of the image after denoising are clear. After the infrared images with different sizes of Gaussian noise are denoised, the image details remain good after denoising, and the peak signal to noise ratio of the image is significantly improved. The overall denoising effect is significant, and the denoising performance is stable and reliable, which can improve the overall quality of the infrared images collected by the distribution network UAV, and provide help for the quality of the distribution network patrol work.
References
-
M. Yang, J. Li, J. Li, X. Yuan, and J. Xu, “Reconfiguration strategy for DC distribution network fault recovery based on hybrid particle swarm optimization,” Energies, Vol. 14, No. 21, p. 7145, Nov. 2021, https://doi.org/10.3390/en14217145
-
X. Jiang, B. Stephen, and S. Mcarthur, “Automated distribution network fault cause identification with advanced similarity metrics,” IEEE Transactions on Power Delivery, Vol. 36, No. 2, pp. 785–793, Apr. 2021, https://doi.org/10.1109/tpwrd.2020.2993144
-
A. Ghaemi, A. Safari, H. Afsharirad, and H. Shayeghi, “Accuracy enhance of fault classification and location in a smart distribution network based on stacked ensemble learning,” Electric Power Systems Research, Vol. 205, p. 107766, Apr. 2022, https://doi.org/10.1016/j.epsr.2021.107766
-
X. Mao and Y. H. Li, “Infrared image stitching of UAV in fault detection of photovoltaic array,” Acta Energiae Solaris Sinica, Vol. 41, No. 3, pp. 262–269, 2020, https://doi.org/10.19912/j.0254-0096.2020.03.035
-
B. Xu et al., “Turbulence-degraded image restoration algorithm based on twice bi-dimensional empirical mode decomposition denoising,” Application Research of Computers, Vol. 37, No. 5, pp. 1582–1586, 2020, https://doi.org/10.19734/j.issn.1001-3695.2018.11.0910
-
X. W. Liu, J. C. Lei, and Y. P. Wu, “Synthetic aperture radar target-recognition method based on bidimensional empirical mode decomposition,” Laser and Optoelectronics Progress, Vol. 57, No. 4, p. 041004, 2020, https://doi.org/10.3788/lop57.041004
-
P. Liu et al., “Image denoising algorithm based on fast and adaptive bidimensional empirical mode decomposition,” Image Denoising Algorithm Based on Fast and Adaptive Bidimensional Empirical Mode Decomposition, Vol. 46, No. 11, pp. 260–266, 2019, https://doi.org/10.11896/jsjkx.190400159
-
Y. Shi, X. Jiang, and S. Li, “Fusion algorithm of UAV infrared image and visible image registration,” Soft Computing, Vol. 27, No. 2, pp. 1061–1073, Jan. 2023, https://doi.org/10.1007/s00500-021-05918-8
-
J. Nie, T. Luo, and H. Li, “Automatic hotspots detection based on UAV infrared images for large‐scale PV plant,” Electronics Letters, Vol. 56, No. 19, pp. 993–995, Sep. 2020, https://doi.org/10.1049/el.2020.1542
-
L. Hao, Q. Li, W. Pan, and B. Li, “Icing detection and evaluation of the electro-impulse de-icing system based on infrared images processing,” Infrared Physics and Technology, Vol. 109, p. 103424, Sep. 2020, https://doi.org/10.1016/j.infrared.2020.103424
-
K. Xu, X. Jiang, S. Lin, C. Dai, and W. Chen, “Stochastic modeling based nonlinear Bayesian filtering for photoplethysmography denoising in wearable devices,” IEEE Transactions on Industrial Informatics, Vol. 16, No. 11, pp. 7219–7230, Nov. 2020, https://doi.org/10.1109/tii.2020.2988097
-
E. Oztop and M. Asada, “Combined weight and density bounds on the polynomial threshold function representation of Boolean functions,” Discrete Mathematics, Vol. 345, No. 8, p. 112912, Aug. 2022, https://doi.org/10.1016/j.disc.2022.112912
-
Z. Jiang, J. Wang, M. V. Tirrell, J. J. de Pablo, and W. Chen, “Parameter estimation for X-ray scattering analysis with Hamiltonian Markov Chain Monte Carlo,” Journal of Synchrotron Radiation, Vol. 29, No. 3, pp. 721–731, May 2022, https://doi.org/10.1107/s1600577522003034
-
S. Hernández, D. Vergara, M. Valdenegro-Toro, and F. Jorquera, “Improving predictive uncertainty estimation using Dropout–Hamiltonian Monte Carlo,” Soft Computing, Vol. 24, No. 6, pp. 4307–4322, Mar. 2020, https://doi.org/10.1007/s00500-019-04195-w
About this article

The study was supported by “Research and pilot application of distribution network patrol inspection system based on UAV infrared image technology” (Grant No. 2021-KJ-05).
All datasets generated for this study are included within the article.
The authors declare that they have no conflict of interest.
