Abstract
The phase analysis of Cu-0.41%Cr-0.20%Zr alloy treated by vacuum melting + solid solution + aging was carried out by means of SEM, TEM, EDXS and XRD. The results show that there are three phases in the alloy, namely the copper matrix phase, the chrome-rich phase and the zirconium-rich phase. The distribution of phase size is bimodal. The coarse phase size is microns scale, and the main components are elemental chromium and Cu5Zr, which are formed during the casting process and are not easy to dissolve in the subsequent aging process. The fine phase size is nanometer scale, and the composition is ordered bcc pure chromium and Cu5Zr. There is no chromium and zirconium intermediate phase. Under this condition, the volume fraction of precipitated phase is about 30 %. The heat treatment process can be further optimized by increasing the aging temperature, lengthening the aging time or adopting the second aging method.
1. Introduction
Cu-Cr-Zr alloy is widely used in high-speed railway, large-scale integrated circuit, continuous casting mold, lead frame, and resistance welding due to its advantages of high strength, high conductivity and high wear-resistance [1]. In recent years, many institutions have made great breakthroughs in the preparation, processing and properties of copper alloys, such as Beijing General Research Institute of Non-ferrous Metals, Tsinghua University, Henan University of Science and Technology, Luoyang Copper Processing Plant and Jiangsu Metallurgical Research Institute [2-7]. Through the study of Cu-Cr alloys, Batawi et al. [8] believed that the addition of Zr, Mg, Ti and Si to Cu-Cr alloys can ensure the strength of Cu-Cr alloys and the electrical conductivity of the alloys are maximized. Tanaka et al. [9] studied the phase diagram of phase equilibrium in the ternary Cu-Cr-Zr system composition range of 3.5Cr and 3.5Zr (weight %) at the temperatures 873K and 1313k. Cr2Zr phase was not found in the sample. According to the results at 1213K, the copper phase was in equilibrium with Cr, Cr2Zr, Cu3Zr and liquid (L). Purcek et al. [10] have identified the aging precipitates in Cu-Cr-Zr-Mg alloys as Cu4Zr and CrCu2(Zr, Mg). The researchers reported that the components of the phases were Cu9Zr2, Cu4Zr, Cu9Zr and Cu5Zr, and there was no consensus. The phase of Cu-0.41%Cr-0.20%Zr (wt%) alloy prepared under the process of “vacuum melting + solution treatment + aging treatment” is analyzed, aiming to provide some references for the research in this respect.
2. Experimental materials and methods
Electrolytic copper, Cu-Cr intermediate alloy, high purity zirconium and appropriate amount of Mg were selected as raw materials for the test. Vacuum melting was protected by argon. When the melting temperature was 1300-1350 ℃, the holding time was 20 min, and the argon was filled 0.08 MPa before pouring. The pouring temperature was about 1250℃-980 ℃×2 h solid solution after water quenching, and the aging was 450 ℃×20 h after air cooling. The heat-treated material was cut into samples with the size of 8 mm×8 mm×5 mm. After cleaning, fixing, dewatering, drying and gluing, the samples were ground, polished and etched with 10 % ammonium persulfate aqueous solution for SEM observation. The morphology and structure of TEM samples after ion thinning were observed under ordinary H-800 transmission electron microscope and JEM-2010 high resolution electron microscope. Then selected electron diffraction analysis was performed.
3. Experimental results
3.1. SEM
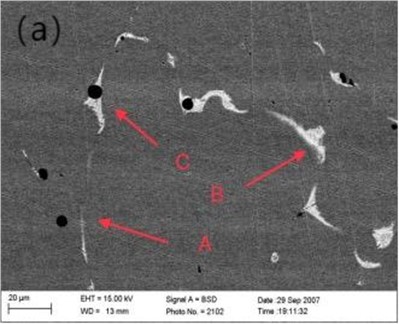
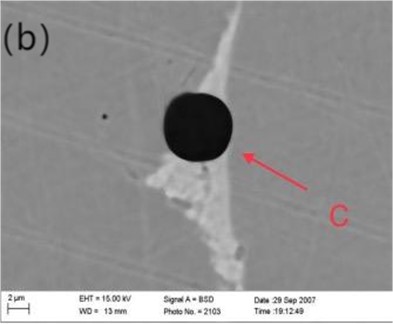
Fig. 1(a) shows the microstructure morphology of Cu-0.41%Cr-0.20%Zr alloy observed by scanning electron microscopy. The phase size in the alloy microstructure is micrometer scale, and there are mainly three phases: A phase (black spheroid), B phase (white strip) and C phase (black and white mixed phase). The C phase is further enlarged, as shown in Fig. 1(b).
Fig. 1Microstructure of Cu-0.41%Cr-0.20%Zr alloy (SEM)
3.2. EDXS
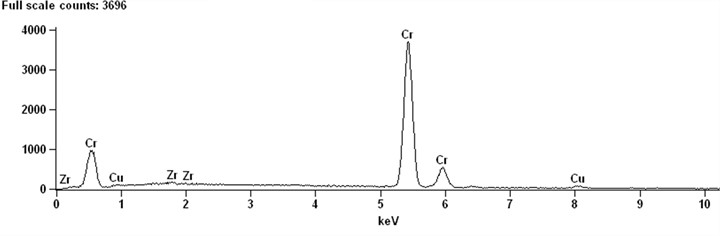
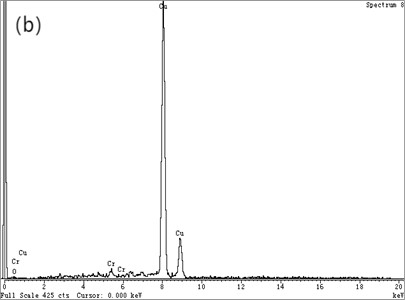
X-ray and EDXS qualitative and quantitative analysis methods were used to analyze the composition of phases in the microstructure of Cu-0.41%Cr-0.20%Zr alloy. Typical EDXS qualitative analysis spectra of these phases are shown in Fig. 2. It can be determined that there are mainly three phases in the microstructure of the alloy copper matrix phase, chrome-rich phase and zirconium-rich phase. Fig. 2(a) shows that the phase is Cr rich, and there are copper and zirconium peaks in addition to chromium peaks. The corresponding quantitative analysis results are shown in Table 1. The results show that the chromium content in the particles of A-phase is as high as 97.14. It can be determined that the A-phase is pure chromium phase. Since the solid solution treatment temperature of the alloy is 980°C, according to the Cu-Cr solid solubility curve, the solid solubility of Cr in pure Cu is low at this temperature. It can be judged that the phase is formed during the solidification process of the alloy and is not dissolved in the solution treatment.
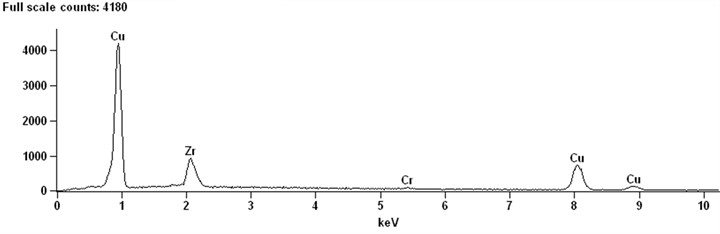
The qualitative results in Fig. 2(b) show that there are only copper peaks and zirconium peaks. It can be judged that this phase is Zr-rich phase. It is possible that the rapid diffusion of Zr in Cu may lead to the reaction of the two elements to form Cu2Zr. On the other hand, it may spread out to form Cu5Zr. Combined with Fig. 1 and Fig. 2, it is assumed that the white precipitates and pits are two aspects of the same characteristics. If the pits of pure chromium are detected and surrounded by Zr-rich phase, their compositions most correspond to Cu5Zr. Because it is assumed that chromium precipitates around the Cu5Zr core in a pure copper matrix, most of the Zr-rich phase and Cr phase are distributed separately in the SEM observation experiment. However, these two phases can exist simultaneously, as shown in Fig. 1(b). The Zr-rich phase and Cr phase exist simultaneously, and the Cr-rich phase is embedded in the Cu5Zr matrix (particle C). There is a clear interface between the two stages, and there is no intermetallic phase. According to the foregoing analysis, Cr phase should be formed in the solidification process of alloy. It can be assumed that the Cr-rich phase is solidified by the melt, and then the Zr-rich phase solidifies at the interface between the chrome-rich phase and the melt, with the Cr-rich phase acting as the core of the Zr phase solidification.
Chromium and zirconium can be enriched at the same time. The intermetallic phases of chromium and zirconium are not easily combined. Table 1 shows that the zirconium content of particles is as high as 14.45 %, and the Cu/Zr atomic ratio is 5.7. Considering the existence of matrix and the detection of actual data, it can be sure that the B phase of Cu-0.41%Cr-0.20%Zr alloy is Cu5Zr. This result is consistent with the experimental results of Cu-Cr-Zr ternary system [11].
Table 1EDXS analysis of Cu-0.41%Cr-0.20%Zr alloy phase
% | Cu | Cr | Zr | Cu/Zr | |
A | wt% | 3.16 | 96.42 | 0.26 | |
at% | 266 | 97.14 | 0.15 | ||
B | wt% | 79.57 | 0.78 | 19.45 | 5.7 |
at% | 84.51 | 1.03 | 14.45 |
Fig. 2EDXS qualitative analysis of microstructure of Cu-0.41%Cr-0.20%Zr alloy
3.3. CTEM
Fig. 3 is the TEM microscopic image of the alloy, which is an analysis of the microstructure at the nanoscale. Fig. 3(a) is the bright field image; Fig. 3(b) is leaf contrast; Fig. 3(c) is the SAED of particle B in Fig. 3(a). Usually, SAED and XRD analysis can be used to analyze the crystal system of the material and the optimal growth orientation.
Fig. 3Microstructure of Cu-0.41%Cr-0.20%Zr alloy (TEM)
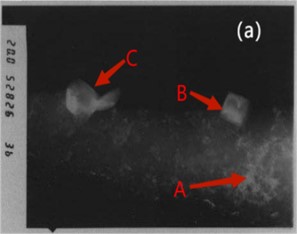
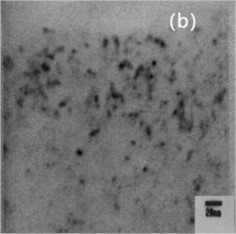
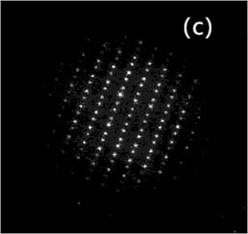
Fig. 3(a) is atypical TEM image of the solution aging sample. Particle A is foliated with coarse B and C particles. The aged precipitated phase is dispersed within the particles in the copper matrix, with the sizes ranging from 5 nm to 20 nm, as shown in Fig. 3(b). Since no additional reflection points were detected by selected electron diffraction and morphology and size except for the matrix, it was presumed that the particle is a coherent chromium particle. The results are similar to those of Cr particles in copper matrix. Fig. 3(c) shows the selected electron diffraction pattern point index of particle B shown in Fig. 3(a), with vertex B being Cu5Zr.
3.4. HRTEM
Fig. 4(a) is the HRTEM micrograph of the alloy, and Fig. 4(b) is a typical EDXS qualitative analysis. In the CTEM observation, it is found that the three are decomposition products in different evolutionary states. Fig. 4(a) depicts HRTEM micrographs of a lattice fringe associated with (220) Cu. The fringe spacing measured under the microscope is about 0.13 nm, which is in good agreement with d220 (0.1278 nm) of Cu [12]. As the HRTEM micrograph shown in Fig. 4, the ordered bcc phases are similar to that in Fig. 3(c). A typical EDXS qualitative analysis spectrum for the chrome-rich phases is shown in Fig. 4(b) with copper peaks and chromium peaks. It can be assumed that the leaf contrast is pure chromium.
Fig. 4Microstructure of Cu-0.41%Cr-0.20%Zr alloy (HRTEM)
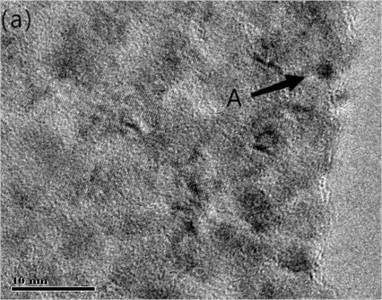
The HRTEM results show that the precipitated phase is pure Cr, and the particle size ranges from 1 nm to 20 nm. The purpose of observing and analyzing the microstructure of Cu-0.41%Cr-0.20%Zr alloy is to understand the strength mechanism and composition of precipitated phase, so as to provide some theories for strengthening the properties. The aging precipitated phase is the strengthened phase formed by the decomposition of supersaturated solid solution during the process of solid solution aging. According to the data, because the precipitated reinforced phase size is between 1-100 nm, coarse particles have little influence on the performance. The improvement of the mechanical properties of the alloy depends on the successful redistribution of the alloy content of the aging precipitated phase during solidification. The zirconium content of the alloy is reduced to 0.1 % or less.
3.5. Discussion
Table 2 shows the mechanical properties and electrical conductivity of Cu-0.41Cr-0.20Zr alloy after 980C×2h solution, water quenching, 450C×20 h aging and air cooling. Fig. 3(a) shows the precipitation enhanced form 1nm and 500 nm. According to the type of precipitated phase and its orientation relationship with the matrix, the strengthened phase of Cu-0.41 cr-0.20 Zr is Cu5Zr and elemental Cr, and the elemental Cr of body-centered cubic and Cu conform to the N-W orientation relationship [13].
Table 2P of Cu-0.41%Cr-0.20%Zr alloy
Composition / wt.% | Y / MPa | T / MPa | H / HRB | E / % | Conductivity / %IACS |
Cu-0.41%Cr-0.20%Zr | 305 | 410 | 76 | 17.12 | 78.5 |
These aging precipitates together with the copper matrix produce peak hardness [14]. Hardness increases with an empirical O’Rowan relationship as shown in Eq. (1):
where is the increase of shear stress; is a constant; is the volume fraction of precipitated strengthened phase, and represents the diameter of the precipitated strengthened phase. According to the TEM analysis in Fig. 3, the volume fraction of precipitated phase is about 30 %. The constant is 2.7 N/m. The more the volume fraction of precipitated phase, the smaller the aging precipitated phase, the more the increase of , and the higher the alloy hardness.
The empirical formula for the electrical conductivity of aging precipitated alloys is shown in Eq. (2) [15]:
where is the electrical conductivity of alloy; is the electrical conductivity of solid solution matrix; is the conductivity of precipitated phase, and is the volume fraction of precipitated phase. The electrical conductivity of the alloy is proportional to the volume fraction of the precipitated phase.
It can be seen that the heat treatment process with a 2-hour aging of 20 hours in a 980 °C solution can improve the strength and conductivity of Cu-0.41%Cr-0.20%Zr alloy. The volume fraction of the precipitated phase can be further improved by improving the process conditions, which further increases the hardness and conductivity.
4. Conclusions
After solid solution at 980 °C for 2 h and aging at 450 °C for 20h, most of the Zr-rich phase and Cr-rich phase in Cu-0.41%Cr-0.20%Zr alloy are distributed in a single form. Only a few two phases can exist at the same time, that is, there are three phases in the alloy, namely, copper matrix phase, chrome-rich phase and zirconium-rich phase.
The distribution of the coarse phase size is bimodal: the coarse phase size is microns scale; the main components are elemental Cr and Cu5Zr formed during casting, and is not easy to dissolve in the subsequent aging process; the fine phase size is nanometers scale, and the composition is bcc pure chromium and Cu5Zr. There is no chromium and zirconium interphase.
The microstructure of Cu-0.41%Cr-0.20%Zr alloy was analyzed by transmission electron microscopy, and the volume fraction of precipitated phase was about 30 % after welding at 980 ℃ for 2 h and aging for 20 h. The smaller the aging precipitated phase, the greater the increase of hardness and the higher the alloy of electrical conductivity. In this way, the heat treatment process can be further optimized by increasing the aging temperature, lengthening the aging time or adopting the methods of secondary aging.
References
-
Z. Y. Pan, “Study on microstructure and property of high-strength and high-conductivity Cu-Cr-Zr alloys,” Shanghai Jiao Tong University, 2015.
-
H. Zhang et al., “Influences of low temperature deformation amount and heat treatment system on microstructure and properties for Cu-Cr-Zr alloy,” Forging and Stamping Technology, Vol. 47, No. 11, pp. 214–221, 2022, https://doi.org/10.13330/j.issn.1000-3940.2022.11.030
-
Y. X., Ma, S. E. Dang, and H. Q. Chen, “Effect of solution treatment on microstructure and properties of Cu-Cr-Zr alloy,” Heat Treatment of Metals, Vol. 47, No. 1, pp. 163–166, 2022, https://doi.org/10.13251/j.issn.0254-6051.2022.01.027
-
M. Y. Niu, J. L. Qu, Y. Zeng, and F. X. Luo, “Microstructure and properties of Cu-Cr-Zr alloy for wire contacting,” Special Casting and Nonferrous Alloys, Vol. 41, No. 9, pp. 1124–1128, 2021, https://doi.org/10.15980/j.tzzz.2021.09.013
-
J. H. He, “The effect of aging treatment and processing amount on properties of Cu-Cr-Zr alloy after continuous extrusion,” World Nonferrous Metals, Vol. 12, No. 2, pp. 18–20, 2022.
-
S. H. Huang, W. B. Xie, W. Huang, H. Wang, and B. Yang, “Mechanical properties and microstructure evolution in Cu-0.8Cr-0.1Zr alloy with thermomechanical treatment,” Chinese Journal of Rare Metals, Vol. 45, No. 11, pp. 1299–1308, 2021, https://doi.org/10.13373/j.cnki.cjrm.xy20040020
-
B. Dong, S. Z. Hong, Y. Pei, D. Lv, and W. Long, “Effect of brazing temperature on microstructure and mechanical properties of Cu-Cr-Zr alloy,” Rare Metal Materials and Engineering, Vol. 49, No. 12, pp. 4081–4087, 2020.
-
E. Batawi, C. Biselli, S. Gunther, M. A. Morris, and D. G. Morris, “Thermomechanical processing of spray-formed Cu-Cr-Zr alloy,” Scripta Metallurgica et Materialia, Vol. 29, No. 6, pp. 765–769, Sep. 1993, https://doi.org/10.1016/0956-716x(93)90223-f
-
S. Tanaka, M. Mizusawa, Y. Miyabe, T. Hagisawa, and K. Kajikawa, “Solidification structure of Cu-Cr and Cu-Cr-Zr alloys,” Journal of the Japan Institute of Metals, Vol. 74, No. 6, pp. 356–364, 2010.
-
G. Purcek, H. Yanar, M. Demirtas, D. V. Shangina, N. R. Bochvar, and S. V. Dobatkin, “Microstructural, mechanical and tribological properties of ultrafine-grained Cu-Cr-Zr alloy processed by high pressure torsion,” Journal of Alloys and Compounds, Vol. 816, p. 152675, Mar. 2020, https://doi.org/10.1016/j.jallcom.2019.152675
-
N. Y. Tang, D. M. R. Taplin, and G. L. Dunlop, “Precipitation and aging in high-conductivity Cu-Cr alloys with additions of zirconium and magnesium,” Materials Science and Technology, Vol. 1, No. 4, pp. 270–275, Apr. 1985, https://doi.org/10.1179/mst.1985.1.4.270
-
L.-M. Bi, P. Liu, X.-H. Chen, X.-K. Liu, W. Li, and F.-C. Ma, “Analysis of phase in Cu-15%Cr-0.24%Zr alloy,” Transactions of Nonferrous Metals Society of China, Vol. 23, No. 5, pp. 1342–1348, May 2013, https://doi.org/10.1016/s1003-6326(13)62602-3
-
H. T. Yang et al., “Effects of aging process on properties and precipitation kinetics of Cu-Cr-Zr alloy strips,” Transactions of Nonferrous Metals Society of China, 2022.
-
H. B. Liu, Y. H. Zheng, P. Q. La, J. Shen, and Y. L. Ding, “Effect of rolling and aging treatment on microstructure and properties for Cu-Cr-Zr alloy,” The Chinese Journal of Nonferrous Metals, Vol. 30, No. 9, pp. 2075–2083, 2020.
-
H. X. Ma and Y. G. Li, “Measurement of size distribution and volume fraction of precipitates in silicon steel,” Journal of Materials Science and Engineering, Vol. 20, No. 3, pp. 328–330, 2002.
About this article

This study was supported by Yingkou Doctor Entrepreneurship and Entrepreneurship Program Project (No. QB-2021-06); Yingkou Institute of Technology introduced talent research start-up project (No. YJRC202008) and Liaoning Natural Science Foundation Program Regional Joint Fund Project (No. 2022-YKLH-08).
The datasets generated during and/or analyzed during the current study are available from the corresponding author on reasonable request.
The authors declare that they have no conflict of interest.
