Abstract
The electrostatic levitation inertial sensor has a very wide range of applications in the fields of navigation, orientation, motion vector control, and basic physics experiments. This paper takes the sensing probe of the electrostatic suspension inertial sensor as the research object, the motion state of the mass block inside the sensing probe and the electrostatic force it is subjected to are analyzed in detail, and deduce the coefficients of signal transmission and conversion between each module, The mechanical model of the sensing probe is established in ADAMS, and the mechanical model is added to the Simulink control module as the controlled object, Then, the co-simulation analysis of the measurement and control system is carried out. The results show that when the system reaches stability, the steady-state error is7.044×10-14 m. The system has good stability and can meet the requirements of measurement accuracy.
Highlights
- The mechanical model of the sensitive structure is established in ADMAS software.
- ADAMS and Simulink are used to analyze the measurement and control system.
- When the system reaches stability, the steady-state error is particularly small and the system stability is good.
1. Introduction
An electrostatic suspension inertial sensor is a kind of high-precision inertial instrument that relies on controlled electrostatic force to suspend the sensitive mass in the electrode cavity and realizes acceleration measurement by reading the feedback voltage. It is characterized by adjustable bandwidth and high measurement resolution and has absolute advantages in the field of measuring slow and weak acceleration. It is widely used in inertial navigation, motion control, verification of basic theories of physics, and other fields [1, 2]. Since the 1970s, ONERA of France has developed various types of accelerometers, including CACTUS, ASTRE and GRADIO [3], and made rapid progress in the field of atmospheric drag experiment, drag-free flight test and space quasi-steady state non-gravity measurement [4]; The MESA accelerometer developed in the United States modified the sensor into a cube structure, which has been used in a variety of spacecraft; The ESA launched the LISA Pathfinder(LPF) satellite in 2015 to verify the electrostatic suspension inertial sensor in orbit, using a laser interferometer to achieve a direct assessment of the noise level of the inertial sensor [5, 6]; Lanzhou Institute of Physics, China Academy of Space Sciences began to study the electrostatic suspension accelerometer around 2000, which is mainly used for drag-free control and gravity gradient satellite of gravity measurement satellites; At the same time, Huazhong University of Science and Technology has carried out the development and ground testing of various satellite-borne inertial sensors, and designed TEPO [7], participated in the gravitational wave detection mission TianQin program [8], and conducted in-orbit tests on XX5 experimental satellite [9, 10] and Tianzhou-1 cargo spacecraft; Professor Liu Yunfeng from Tsinghua University studied the air damping characteristics and electrode absorption of electrostatic suspension system, proposed a new triaxial silicon micro-accelerometer and developed a prototype principle.
Compared with space applications, electrostatic suspension inertial sensors in-ground applications are subject to more kinds of noise interference, which limits the measurement accuracy of the instrument, and therefore requires wider bandwidth and larger range. In order to produce the principle prototype faster and verify the feasibility of the design scheme, this paper establishes a set of simulation models of electrostatic suspension inertial sensor measurement and control systems based on ADAMS and MATLAB/Simulink. The system control module established in Simulink is combined with the physical model in ADAMS for dynamic simulation, simulating the motion parameters under the actual application condition, to make the design more systematic and scientific.
2. Model of electrostatic levitation inertial sensor system
The electrostatic levitation inertial sensor is mainly composed of two parts: the sensor-sensitive probe and the detection control system. The sensing probe is mainly composed of an electrode shell and metal mass block, the surface of the mass block and the electrode surface form a flat capacitance, and the electrostatic force acts to levitate the mass block to the center of the electrode plate. The detection control system is mainly composed of two major parts: the differential capacitance detection circuit and the feedback control circuit, which can realize the measurement of six degrees of freedom in three axes simultaneously. The basic structure of the six-degree-of-freedom sensitive probe is shown in Fig. 1.
The composition principle of the measurement and control part of the six degrees of freedom of the sensor is the same, and the working principle of one of the degrees of freedom is shown in Fig. 2.
Fig. 1Basic structure of the sensor [11]
![Basic structure of the sensor [11]](https://static-01.extrica.com/articles/23194/23194-img1.jpg)
Fig. 2The system composition of electrostatic suspension inertial sensor
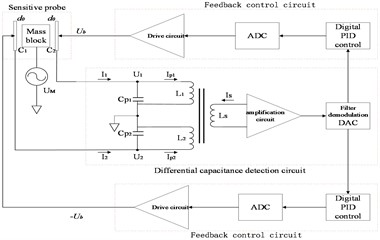
The metal mass block in the middle of the accelerometer sensor and the two electrode plates in the horizontal direction form a pair of differential capacitors and . When the mass block is in the initial position, the size of the differential capacitance is . When the mass block is subjected to inertia force and produces displacement , the variation of differential capacitance can be obtained from the parallel plate capacitance formula:
where, is the relative dielectric constant, which is about 1 in a vacuum environment. is the dielectric constant in a vacuum; is the effective area of the parallel capacitor plate. When , the above equation can be simplified to:
According to the above formula, differential capacitance and mass block displacement can be approximately regarded as a linear relationship, and its coefficient is .
When a voltage is applied to the two electrodes of a pair of parallel plate capacitors, an electrostatic force is generated. The magnitude of the electrostatic force can be calculated by the following formula:
Under the action of inertial force ma, the mass block has a displacement x relative to the central position. The electrostatic force received by the mass block is:
where is the preloaded voltage, is the feedback voltage. When the mass block is controlled back to the center position, that is, 0, the above formula can be simplified as:
At this time, according to the force balance, the equation relationship between the feedback electrostatic force and the input inertia force is established:
The solution is:
is called the translational after force coefficient.
3. Co-simulation and result analysis
To better understand the performance of the inertial sensor under the design scheme, the co-simulation was carried out by ADAMS and MATLAB/Simulink software. The simulation model of the sensing probe established by the ADAMS/View program is directly added to the Control module of Simulink as the controlled object by using the ADAMS/Control module, and the establishment process of the mathematical model of the sensing probe is omitted. Then the measurement and control system is co-simulated and analyzed.
3.1. Design of co-simulation system
Firstly, the prototype model of the mechanical system in ADAMS/View is constructed, including the creation of a simplified geometric model of the sensing probe (shell and other parts are omitted), various constraints, forces, and state variables. The built model is shown in Fig. 3(a). After the model is built, it is determined that the input variable of ADAMS/Control is the electrostatic VARIABLE_F_fankui returned from the Simulink control program, and the output variable to the control program is the displacement VARIABLE_X of the mass block. The information loop between ADAMS and MATLAB control programs can be realized by defining input and output variables. ADAMS/Control module was used to export the simulation model of the sensing probe to generate Adams_sub sub-module in the Simulink environment, as shown in Fig. 3(b).
Fig. 3Simplified model of sensitive probe
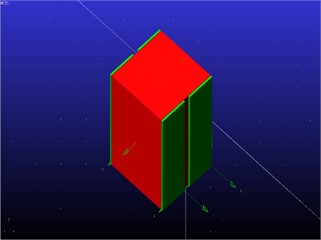
a) Adams model
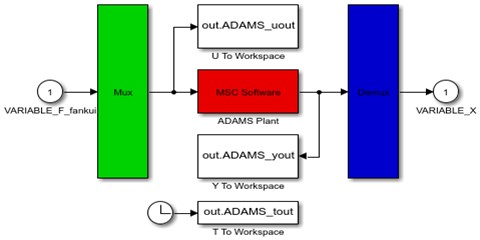
b) Adams_sub module
According to the working principle of the accelerometer, the PID controller is used for control, and the block diagram as shown in Fig. 4 is established.
The input of the system is the measured inertia force, and the output is the controller output control voltage signal. After the block diagram of the control system was constructed, the conversion coefficients between each part were calculated according to the system parameters in Table 1 and brought into the Simulink model.
Fig. 4Simulink block diagram model
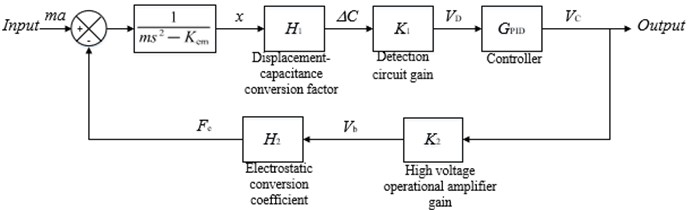
Table 1System parameters
Parameter | Value |
Weight / g | 36.048 |
Plate area / mm2 | 100 |
Gap between plate and mass block / μm | 50 |
Preload voltage / V | 10 |
3.2. Analysis of simulation result
Adams_sub module is put into the designed control system, and the final co-simulation model established in Simulink is shown in Fig. 5.
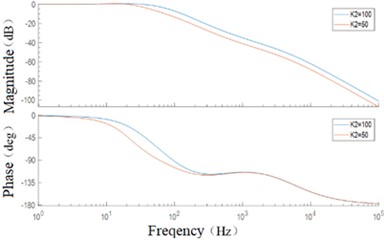
The open-loop Bode diagram of the true obtained system is shown in Fig. 6. The open-loop shear frequency is 40 Hz, the phase margin is 69.1°, and the system stability is poor. The closed-loop Bode diagram of the corrected system is shown in Fig. 7.
The high-voltage operational amplifier module should generate a feedback voltage high enough according to the PID feedback signal so that the electrostatic force provided can overcome the inertia force. When the gain K2 = 50, the –3 dB bandwidth of the system is 34.8 Hz, the resonant peak value is 0.669 dB, and the resonant frequency is 14 Hz. When K2 = 100, the –3 dB bandwidth of the system is 64.1 Hz, the resonant peak is 0.668 dB, and the resonant frequency is 19 Hz. At high gain, the system has a wider bandwidth range but considering that the high-voltage operational amplifier gain of the actual circuit will bring greater circuit noise, which will cause interference to the detection, the high-voltage gain K2 = 50 is selected when the requirements of the operational amplifier are met.
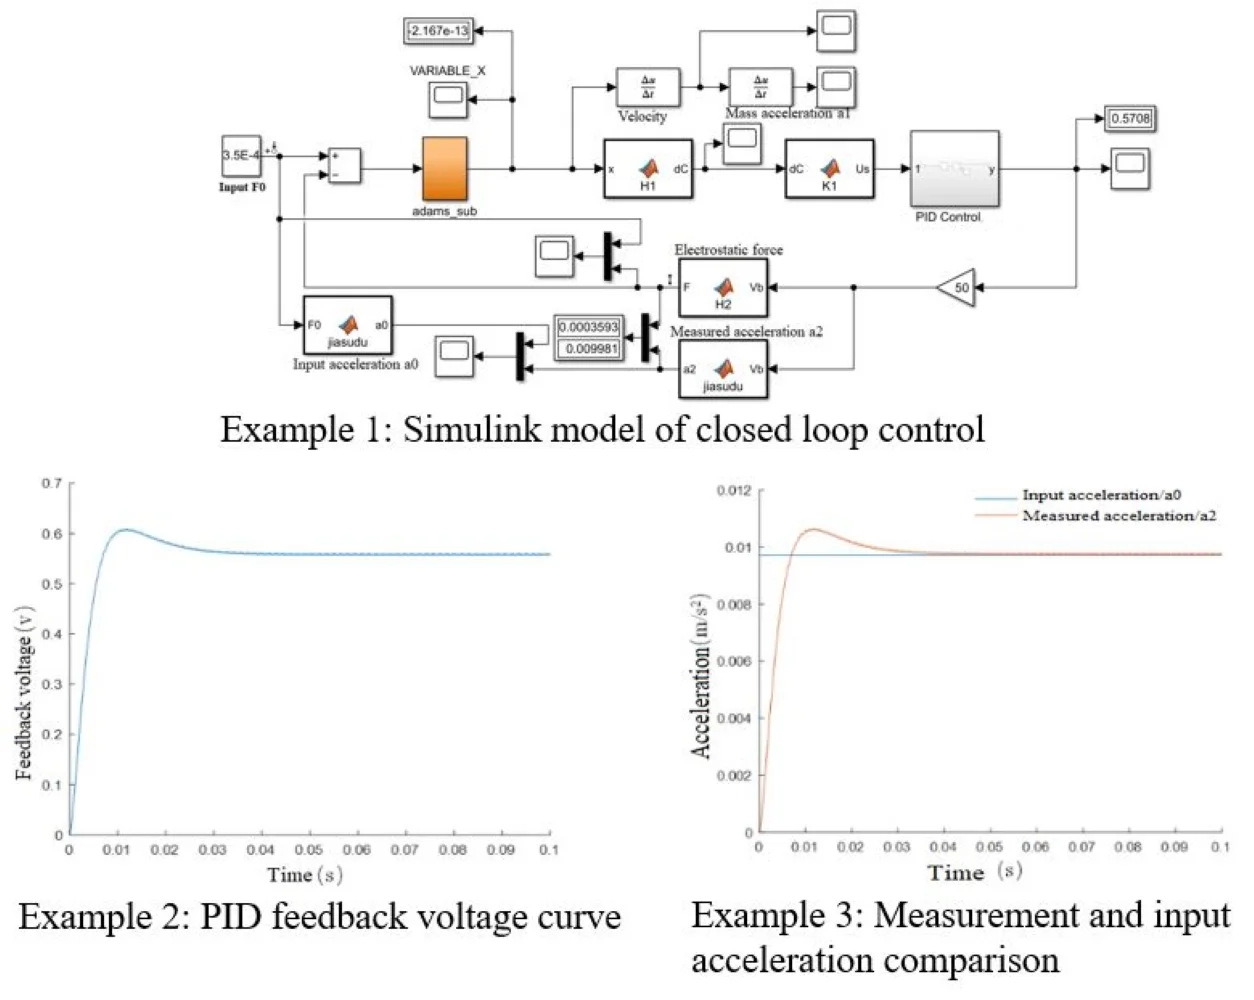
Fig. 5Simulink model of closed loop control
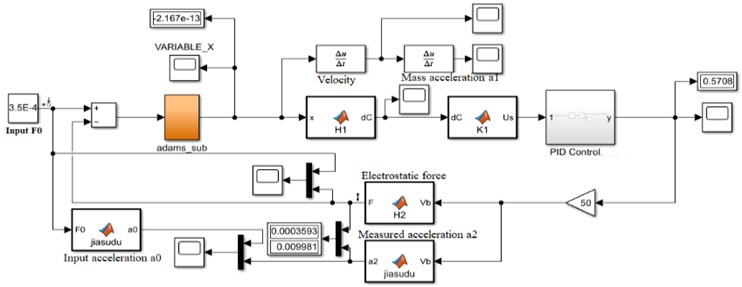
Fig. 6Open-loop Bode diagram of the system
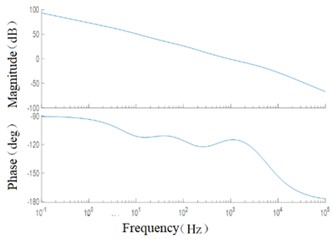
Fig. 7Closed loop Bode diagram of the corrected system
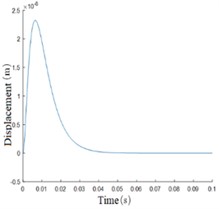
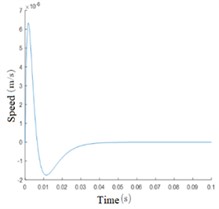
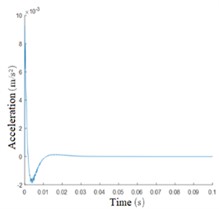
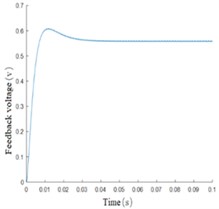
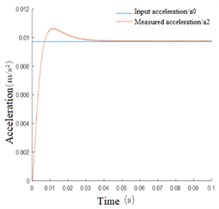
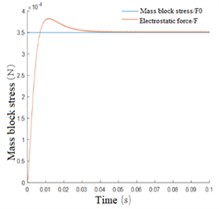
The input acceleration is 1mg, and the simulation time is 0.1s. The results are shown in Fig. 8. As can be seen from the displacement change curve of the mass block in Fig. 8(a), at the beginning of the simulation, the mass block will have a large displacement under the action of inertial force, and the maximum change of the initial displacement under the action of feedback voltage is only 2.324×10⁻⁸ m. At 0.007 s, the callback began. After 0.020 s from the beginning of the simulation, the mass block displacement was limited to 9.858×10⁻⁹ m, A good control effect is achieved. After 0.041 s, the mass block is basically in the equilibrium state and returns to the initial position. The steady-state error is 7.044×10⁻¹⁴ m. Fig. 8(b), (c), and (d) respectively show the velocity curve, acceleration curve, and PID control feedback voltage signal curve of the mass block. It can be seen from the simulation results that the mass block is in an accelerated motion state at the beginning, and the acceleration brought by the inertial force gradually decreases with the increase of the feedback voltage. Under the control of the feedback voltage at 0.002 s, the acceleration direction of the mass block changes, and the peak velocity of the mass block is 6.351×10⁻⁶ m/s, After 0.007 s, the velocity direction changed and the position of the mass block began to adjust back; after 0.041 s, the motion velocity reached 0 and returned to the stable state. PID control feedback voltage signal curve is smooth, there is no sharp part, indicating that the pressure circuit can achieve good control. Fig. 8(e) and Fig. 8(f) respectively show the comparison curves between measured acceleration and input acceleration and between feedback electrostatic force and input inertial force. The measured acceleration and feedback electrostatic force change curves are opposite to the acceleration curve of the mass block, and the trend is consistent with the actual control relationship. When the steady state is reached, the input acceleration and inertia force curves coincide.
Fig. 8Simulation results under ideal conditions
a) Mass block displacement curve
b) Mass block velocity curve
c) Mass block acceleration curve
d) PID feedback voltage curve
e) Measurement and input acceleration comparison
f) Feedback and input inertia force comparison
4. Conclusions
In this paper, based on the analysis of the work process of the electrostatic suspension inertial sensor, the mathematical model of its key link is established according to the design scheme. The mechanical model created in ADAMS is used to replace the mathematical model of general simulation in the sensing probe The simulation experiment of electrostatic suspension inertial sensor measurement and control system is completed in MATLAB/Simulink environment, which verifies the feasibility of the design scheme faster. The simulation results show that good detection accuracy and stability can be obtained by using the model designed in this paper to measure acceleration. Without considering the hardware noise of the system, the acceleration reading is large at the beginning, and the sensor reading becomes accurate and stable after 0.041 s. When the system reaches stability, the steady-state error is 7.044×10⁻¹⁴ m. The simulation results provide a basis for further prototype design.
References
-
F.-T. Han, Q.-P. Wu, Z.-B. Zhou, and Y.-Z. Zhang, “Proposed space test of the new equivalence principle with rotating extended bodies,” Chinese Physics Letters, Vol. 31, No. 11, p. 110401, Nov. 2014, https://doi.org/10.1088/0256-307x/31/11/110401
-
E. Canuto and L. Massotti, “All-propulsion design of the drag-free and attitude control of the European satellite GOCE,” Acta Astronautica, Vol. 64, No. 2-3, pp. 325–344, Jan. 2009, https://doi.org/10.1016/j.actaastro.2008.07.017
-
Y. Wang, K. Qi, S. Wang, W. Li, Z. Li, and Z. Wang, “Capacitive sensing and electrostatic control system design and analysis with a torsion pendulum,” IEEE Access, Vol. 8, pp. 1021–1030, 2020, https://doi.org/10.1109/access.2019.2961761
-
P. Touboul, B. Foulon, B. Christophe, and J. P. Marque, “CHAMP, GRACE, GOCE instruments and beyond,” in Geodesy for Planet Earth, pp. 215–221, 2012, https://doi.org/10.1007/978-3-642-20338-1_26
-
L. Castellie, “LISA pathfinder noise performance results: disturbances in the sub-MHz frequency-band and projection to LISA,” Ph.D. thesis, University of Trento, Italy, 2020.
-
M. Armano et al., “Beyond the required LISA free-fall performance: new LISA pathfinder results down to 20 μHz,” Physical Review Letters, Vol. 120, No. 6, Feb. 2018, https://doi.org/10.1103/physrevlett.120.061101
-
F. Gao, Z.-B. Zhou, and J. Luo, “Feasibility for testing the equivalence principle with optical readout in space,” Chinese Physics Letters, Vol. 28, No. 8, p. 080401, Aug. 2011, https://doi.org/10.1088/0256-307x/28/8/080401
-
J. Luo et al., “The first round result from the TianQin-1 satellite,” Classical and Quantum Gravity, Vol. 37, No. 18, p. 185013, Sep. 2020, https://doi.org/10.1088/1361-6382/aba66a
-
S.-B. Qu, X.-M. Xia, Y.-Z. Bai, S.-C. Wu, and Z.-B. Zhou, “Self-calibration method of the bias of a space electrostatic accelerometer,” Review of Scientific Instruments, Vol. 87, No. 11, p. 114502, Nov. 2016, https://doi.org/10.1063/1.4966248
-
Li Hong-Yin, Qu Shao-Bo, Bai Yan-Zheng, Wu Shu-Chao, and Zhou Ze-Bing, “Least squares estimation of in-orbit mass center position of the electrostatic accelerometer,” Chinese Journal of Geophysics, Vol. 60, No. 3, pp. 897–902, 2017, https://doi.org/10.6038/cjg20170304
-
F. C. Yang, “Investigation of charge management and control for space inertial sensors,” Huazhong University of Science and Technology, 2020.
About this article

The authors would like to thank the Science and technology development plan project of Jilin province No. 20190304132YY.
The datasets generated during and/or analyzed during the current study are available from the corresponding author on reasonable request.
The authors declare that they have no conflict of interest.
