Abstract
Coriolis Vibratory Gyroscope (CVG) is an inertial rotation rate measurement sensor for inertial navigation applications. The rotation sensitive element is a hemispherical vibrating resonator, made of fused silica. It is forced to vibrate at a particular resonant mode with electrostatic forcing. As the resonator is a glass material its vibration amplitude is limited to the submicron level. An ultra-high vacuum environment is necessary for the resonator to sustain the vibration amplitude. Securing the required vacuum level is critical in sensor development. A detailed analysis has been carried out on the damping forces present at various ambiance conditions, the need for threshold vacuum level, threshold forcing voltage for the resonator, and different ways of degradation of the vacuum level in the sensor capsule. This paper presents an experimental study on the damping forces that appear on the resonator by measuring the factor at various vacuum levels, vacuum leak rate through weld joints, securing the vacuum environment, and remedial action to arrest vacuum in the sensor volume. Dedicated test setups have been established to carry out the experimental research work.
1. Introduction
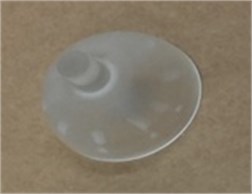
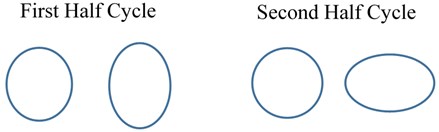
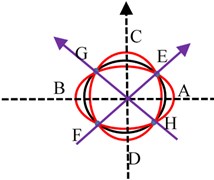
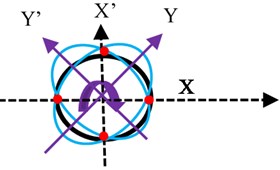
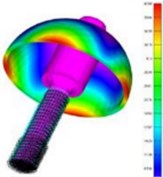
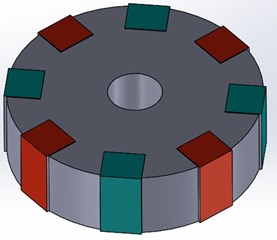
A Gyroscope is an inertial rotation rate measurement sensor used in an inertial navigation system along with accelerometers for autonomous navigation [1], [2] for various platforms. Since the last few decades, a host of physical laws were used to develop gyroscopes [3], which are currently in operation. Coriolis Vibratory Gyroscope (CVG) is a vibration gyroscope [4] that offers good bias stability, has an advantage of size, weight, and power apart from high reliability [5] make it the most suitable sensor for aerospace applications. CVG has a precision machined hemispherical resonator as a rotation sensing element as shown in Fig. 1(a). The material selected for the resonator should have a high factor. It helps to sustain vibration amplitude for a long time because of low material damping. The nature of vibration is an under-damped oscillator. The resonator is forced to vibrate at its mode 2 resonating standing wave [6] at a fixed amplitude by electrostatic excitation scheme. Mode 2 is a fundamental flexural vibration mode as shown in Fig. 1(b). When mode 2 is excited on the resonator by electrostatic forcing, during the first half cycle the resonator deforms to its greatest ellipsoidal geometry and then returns to its spherical shape. In the next half-cycle, a similar deformation takes place but spatially shifts by 90° in azimuth. This mode of vibration forms set of four anti-nodes (A, B, C, D) and four nodes (E, F, G, H) on the resonator. The vibration pattern is a standing wave as shown in Fig. 1(c). Vibration control algorithms [7], [8] are required for maintaining standing waves on the resonator. When the vibrating resonator rotates about a fixed axis with angular velocity (), Coriolis forces act on the resonator generates a secondary standing wave on the resonator as shown in Fig. 1(d), there is an exchange of vibration energy between primary and secondary waves. The rate of exchange of energy is a measure of angular velocity, which can be measured electronically in terms of varying amplitude and phase at fixed locations around the resonator [9]. The Primary requirement for the CVG is to maintain a fixed value of the amplitude and frequency of vibration on the resonator during the measurement of angular rotation [10]. The resonator’s material is very brittle in nature and has a flexible area that lies just at its lip plane, small vibration amplitude of the order of submicron is desirable to avoid nonlinear distortion of the vibration amplitude. Finite element analysis was done on the resonator structure by using NASTRAN software to understand the resonator's vibration mode pattern, frequency, amplitude, and modal mass contribution in the vibration displacement [11]. Simulation results are as shown in Fig. 1(e). Submicrometer level of amplitude has severe effect by the viscous force of the resonator ambiance environment. Hence a suitable vacuum background is essential to sustain the vibration on the resonator. A detailed study is carried out to identify a threshold vacuum level to the resonator for its satisfactory operation and practical vacuum level required for gyroscope life of a minimum of 5 years.
Vacuum packaging of the resonator is very critical to maintaining without degradation of its level during the operational life. Practically it is observed that the vacuum level gets degraded with time due to its leak from sensor package joints and the outgassing from the sensor components within the package. The degraded vacuum environment severely damps the resonator vibration and lowers its factor. Measurement of -factor and vibration damping time are critical parameters to assess the vacuum environment in the sensor package. A Vacuum leak-proof sensor package is critical in deciding the vacuum level for the sensor.
Fig. 1a) Resonator, b) mode 2 vibration pattern on the resonator, c) vibration without rotation, d) vibration with rotation, e) simulation of mode 2 vibration
a)
b)
c)
d)
e)
2. Working principle
CVG has a vibrating resonator fixed rigidly on the sensor base, which is mounted on a rotating platform whose rotation rate is to be measured along its sensitive axis. The required standing vibration mode is established on the resonator by electrostatic force. The amplitude and phase of the standing wave nodes and anti-nodes can be measured electronically by capacitor formation. A set of discrete metallic electrodes on the electrode block with metal coated resonator creates an array of isolated capacitors. The set of capacitors falls on the anti-nodes of the vibration called the - axis, and the remaining sets fall on nodes called the -axis. When the required standing mode is excited on the resonator, the capacitors experience changes in capacitance due to the vibration of the resonator. Precise control algorithms are required to make this primary vibration pattern stabilize on the resonator. When the platform is stationary, the vibration pattern remains fixed on the resonator. If the anti-nodes of the vibration pattern align along the -axis, then the -axis is always fixed at nodes. When the platform rotates along a particular axis, the nodes and anti-nodes of the vibrating resonator also rotate proportionally due to Coriolis forces on the resonator. Due to Coriolis forces, a secondary vibration pattern starts built up at the -axes at the loss of energy at the -axis. By extracting the signals from the -axis and -axis locations, the instantaneous orientation of the platform with respect to the previous orientation can be measured continuously. The amplitudes and phases of two vibration mode components are measured by means of change in capacitance.
When the system continuously rotates about the -axis with angular velocity (), Coriolis and centrifugal forces act on the resonator due to the rotating platform frame. The equations of motion in both and -axis with these forces express as:
where and are Coriolis and Centrifugal terms, and are external force components and frequency of vibration.
When external forces and rotation is absent ( = = = 0) the above equations reduce to simple two-dimensional wave equations:
The general solution for the above wave equation along the fixed and -axis with an angle can represented as:
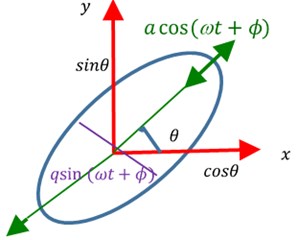
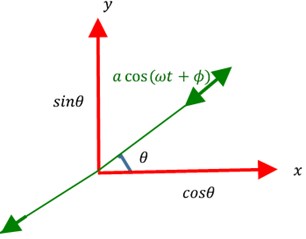
where principal wave amplitude, quadrature wave amplitude, and () phase of the vibration. The traces of the and components sweeps an elliptical orbit as shown in Fig. 2(a). Accurate control loops are required to extract the angular orientation of the vibration pattern on the resonator. The role of control loops is to maintain a constant , nullify (0)) and Phase Lock Loop for controlling phase with change in temperature. Under the influence of control loop algorithms, the and vibration components orbit to become a straight line as shown in Fig. 2(b). The angle is proportional to the inertial rotation of the platform.
The inertial sensitive vibration mode with control loops facilitates the measurement of an incremental angle continuously with respect to the previous angle. The ratio of vibration amplitudes at fixed axis locations of and can yield the angle of rotation as:
3. Resonator forcing procedure and vibration modes
Electrostatic forcing is the most suitable method to establish the required vibration mode on the resonator due to stringent space limitations in sensor volume. One of the capacitors around the resonator can be used to discharge a high voltage pulse through a MOSFET switch to impart mechanical stress on the lip of the resonator. The frequency of the PWM voltage pulse needs to be tuned to vibration mode frequency for resonance to occur. At the resonance tone, the resonator is excited to minimum electrostatic energy. All possible vibration modes get excited on the resonator due to electrostatic excitation, but the required mode of vibration on the resonator sustains its vibration longer than the other modes.
Fig. 2a) 2D vibration pattern inclined at θ and quadrature component qsin(ωt+ϕ), b) 2D vibration pattern inclined at θ without quadrature component (q= 0)
a)
b)
3.1. Principle of electrostatic actuation
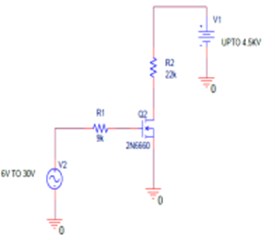
The electrode of the capacitor has a surface charge density of , which generates an electric field of E, the gap of , electrode overlap area of A, and the capacitance of C. 30 V electrical PWM pulse is generated through forcing electronics as shown in Fig. 3(a) is connected to the one of the electrode around the resonator. Fused silica block is coated with electrodes as shown in Fig. 3(b). The coating is done by the thin metal film of Chromium by sputtering deposition process. The metal-coated resonator is fixed by glue on the fused silica block to generate an isolated capacitor at the and axes. When electrostatic energy is discharged between the two plates of the capacitor, the flexible part of the resonator experiences displacement of . Due to this displacement, there will be a change in capacitance () which can be detected by using low noise (3 nv/√Hz) operational amplifiers. Electrostatic force offers certain advantages, including the use of lithographic techniques for electrodes, as well as the ability to use a conducting material coating onto the side of the resonator.
Fig. 3a) Forcing circuit schematic, b) electrode formation
a)
b)
Energy stored in the capacitor:
Electrostatic force:
The capacitance due to parallel plate capacitor and change in capacitance due to displacement of flexible plate is
Table 1 shows the force exerted on the resonator at various applied voltages. From the table, it is clear that at 30 V of electrostatic voltage, the resonator shows 120 nm displacement which causes a change in capacitance of 14×10-15 Farad. 30 V electrostatic voltage is sufficient to detect vibration patterns from the resonator. There are two reasons to fix the 30 V electrostatic voltage. First, the resonator is made of fused silica, which is a glass material. Higher deflection causes fatigue and may show cracks in the resonator. The second is, displacement amplitude of 120 nm will avoid non-linearity factors in the vibration mode.
Table 1Change in capacitance with electrostatic voltage
S. No | Voltage (V) | (µm) | (fF) | Force (µN) |
1 | 20 | 0.002 | 0.5 | 0.13 |
2 | 25 | 0.085 | 6 | 0.89 |
3 | 30 | 0.120 | 14 | 12.83 |
4 | 35 | 0.208 | 25 | 28.94 |
3.2. Vibration amplitude measurement test setup
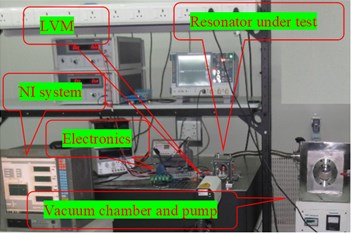
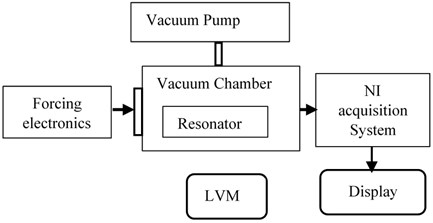
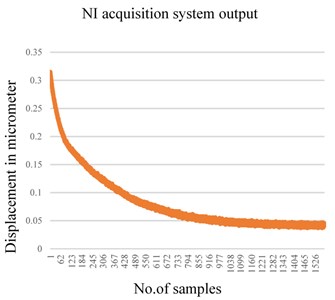
The test setup for the measurement of the vibration displacement is established by two methods. In the first method, Laser Vibrometer (LVM) is used as shown in Fig. 4(a) to measure the real-time frequency and displacement. In the next method, a separate signal acquisition chain is used to read the capacitor signals through a highly sensitive electronics system. PCI-based National Instruments (NI) data acquisition system is used in the test bench, the block diagram is as shown in Fig. 4(b), which has 16-bit ADC and DAC channels. NI system generates the control signals required to the resonator by using DAC and acquires the vibration signal through ADC at 250 msec sample rate. LabView-based software was developed to acquire and analyze the vibration amplitude. NI acquisition setup plots the amplitude of the vibration in both the time domain and in the frequency domain. The setup has a mechanical fixture on which the resonator is fixed in a vacuum chamber with a glass window to flash laser for the vibration measurement through LVM. By applying an electrostatic voltage of 30V, the displacement of the resonator is plotted as shown in Fig. 5(a). These results are in line with the LVM measurements as shown in Fig. 5(b). The setup is used to find the threshold electrostatic force required for the resonator.
Fig. 4a) Experimental setup equipment, b) experimental setup block diagram
a)
b)
From the experimental results, it is identified that a minimum of 10-5mbar vacuum environment is required for the resonator to get actuated by the 30 V electrostatic voltage. As the vacuum level degrades below 10-5mbar, a higher voltage is required to achieve the same vibration amplitude. Higher voltage level leads to more mechanical stress on the resonator which may cause physical damage. Hence, experimentally it is concluded that 10-5 mbar is the threshold vacuum level to establish the required vibration pattern on the resonator.
Fig. 5a) Vibration damping measured by NI System, b) vibration damping measured by LVM
a)
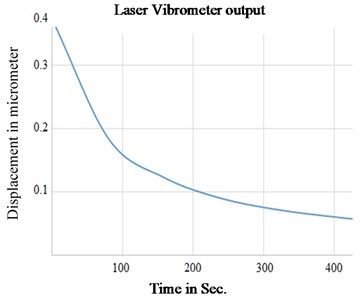
b)
4. Influence of vacuum on the resonator factor
The factor is a parameter that describes the damping behavior of the resonator. Resonator with a high factor has very low intrinsic material damping, the amplitude of vibration decreases gradually to zero. Theoretically, the -factor of a system is calculated based on its resonance frequency () and damping time constant () as:
The hemispherical resonator selected for the experiment, has a frequency of 6500 Hz, with a factor of 2×10⁶. This corresponds to a theoretical damping time constant ( of 97 sec as per Eq. (10). To achieve this time constant, the resonator should have zero damping atmosphere around it. This is possible only with an absolute vacuum environment for the resonator. Practically, there will be a limit to achieve the lowest vacuum level for any physical system. Experimental verification is required to analyze the effect of the factor at various vacuum levels for the resonator. There is a trade-off between the practical vacuum level required and the designed factor of the resonator.
4.1. Experimental study of vacuum effect on factor
An experimental study has been carried out to study the damping forces exerted on the resonator at various vacuum environments. This experiment gives quantitative information about the vacuum level required to sustain the vibration as per the designed Q factor. Table 2 shows the uniform damping forces being experienced at the flexible portion of the resonator at various vacuum levels. As per the simulation results, the flexible portion lies within 1mm height from its rim plane. The density of the fused silica is 2.65 gm/cm3, mass participating in the vibration is 0.76×10⁻³ kg. At 30 V electrostatic voltage, the force exerted on the resonator is 12.83×10⁻⁶ N as calculated in Table 1. The main aim of the vacuum level selection criteria is to offer less damping force than the electrostatic force on the resonator. The pressure exerted on the flexible portion of the resonator at different vacuum levels is calculated and is shown in Table 2. From the table, at the vacuum level of 1.0×10⁻⁵ mbar, the viscous force of 7.03×10⁻⁷N is experienced by the resonator, which is less than the electrostatic force of 12.83×10⁻⁶ N. Theoretically, this is the threshold vacuum level required at a 30 V electrostatic voltage for the resonator for its operation. At least three orders of better vacuum level (10-8mbar) is needed for the sensor to compensate the vacuum degradation issues over its lifetime.
Table 2Force on the resonator rim at various vacuum levels
S. No. | Vacuum (mbar) | Force (N) |
1 | 1.0 | 7.03×10⁻² |
2 | 1.0×10⁻¹ | 7.03×10⁻³ |
3 | 1.0×10⁻² | 7.03×10⁻⁴ |
4 | 1.0×10⁻³ | 7.03×10⁻⁵ |
5 | 1.0×10⁻⁴ | 7.03×10⁻⁶ |
6 | 1.0×10⁻⁵ | 7.03×10⁻⁷ |
7 | 1.0×10⁻⁶ | 7.03×10⁻⁸ |
4.2. Experimental setup for factor measurement
An experimental test setup has been developed to study the impact of the vacuum environment on the resonator factor. Test setup block diagram is as shown in Fig. 6(a). The test setup has an ultra-high vacuum chamber with a powerful turbomolecular vacuum pump with 100 L/sec suction power. This vacuum pump is controlled by a vacuum controller to set and maintain a desired vacuum level in the chamber. The resonator is fixed on a test fixture in the vacuum chamber, a hermetically sealed feed-through connector is used to connect the resonator to the forcing electronics. The forcing and vibration readout modules are mounted outside of the vacuum chamber to vibrate the resonator and read the vibration displacement. The test setup as shown in Fig. 6(b) consists of National Instrument (NI) based acquisition hardware and LabView based software. Acquisition software acquires real-time vibration from the resonator. The software will set the vacuum level for the resonator through the vacuum controller and stabilizes it. Once the vacuum level is reached the desired value, the software instructs the operator to apply the forcing signal through the NI system for vibration signal acquisition. The measured vibration signals are processed at their corresponding vacuum level to calculate the factor. The measurement of the factor is based on the damping time constant at different vacuum levels. This process is repeated to ensure consistency in the measurement of the factor.
Fig. 6a) Test setup block diagram, b) test setup equipment
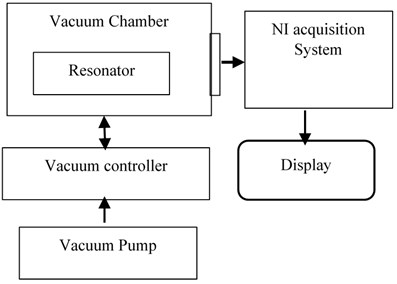
a)
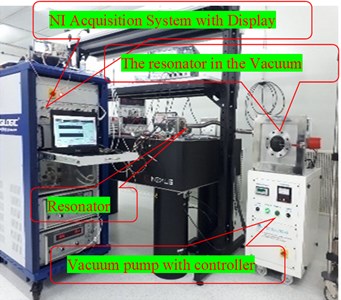
b)
4.3. Results discussion
Table 3 shows the results of the damping time constant and factor of the vibrating resonator at various vacuum levels. The vacuum chamber is set in the range of ultra-high vacuum level of 8.508×10⁻⁹ mbar to the course vacuum level of 1.601×10⁻² mbar. At ultra-high vacuum level, the resonator has a damping time constant of 93 sec, the corresponding factor is 1.91×10⁶, which is close to the designed value of 2.0×10⁶. At the vacuum level of 1.58×10⁻⁴ mbar the degradation in damping time constant is 84 sec, the corresponding factor of 1.72×10⁶. Inferior to this vacuum level, there is a drastic fall in damping time constant and the factor of the resonator. The damping forces acting on the resonator from the ultra-high vacuum environment to the high vacuum environment have a degradation of factor which is less than 10 %. From these results, it is clear that up to 1.58×10⁻⁴mbar vacuum level, the resonator has a reasonable value of factor. This vacuum level is a threshold level to operate the resonator as the rotation sensing element. Inferior to this limit, resonator displacement amplitude does not sustain against the ambient damping forces. Hence, damping forces on the resonator dominates the electrostatic force. The operational vacuum limit is critical in deciding the gyroscope life. There is a trade-off between the vacuum level selection and -factor of the resonator to achieve the required operating life of the sensor. The Sensor is sealed at the vacuum level of 3.77×10⁻⁵ mbar vacuum level with the factor of 1.76×10⁶. Further experiments were carried out on the sensor to study the vacuum level with time. Immediately after sealing the sensor, it is subjected to a further factor test. It is observed during the testing, the damping time constant of the resonator is degraded to 10 sec. This indicates, there is a drop in the vacuum level inside the sensor volume. Senor is subjected to further investigation to assess the possible reasons for this degradation.
Table 3Q factor at various vacuum levels
S. No. | Vacuum level (mbar) | factor | Damping time const. |
1. | 8.58×10⁻⁹ | 1.91×10⁶ | 93 |
2. | 2.12×10⁻⁸ | 1.87×10⁶ | 91 |
3. | 4.19×10⁻⁷ | 1.82×10⁶ | 88 |
4. | 1.14×10⁻⁶ | 1.79×10⁶ | 87 |
5. | 3.77×10⁻⁵ | 1.76×10⁶ | 86 |
6. | 1.58×10⁻⁴ | 1.72×10⁶ | 84 |
7 | 4.90×10⁻³ | 5.26×10⁵ | 26 |
8 | 1.61×10⁻² | 9.67×10⁴ | 5 |
5. Degradation of vacuum in sensor volume with time
During the factor evaluation of the resonator at the sensor level, it is noticed that the damping time constant for the resonator drops to 30 sec. The corresponding factor for this damping time constant is 6.17×10⁵.There is a degradation of 64 % from its original value of 1.76×10⁶. This drop in the factor is attributed to the degradation of the vacuum environment for the resonator.
The gyroscope has different mechanical parts joined together to form a sensor capsule which secures the vacuum for the resonator. Various sensor mechanical parts are joined together by the vacuum welding process. One of the reasons for sensor vacuum level degradation with time may be due to the porous weld joints. To avoid vacuum leaks at joints, high precision joint interfaces are mandatory. The Laser welding technique is adopted for the sensor to join its mechanical parts. In this process, a focused high-energy laser beam forms a vacuum-tight joint. Visual inspection at a higher magnification level shows a proper joint at the interface of sensor parts. Radiographic analysis on the joint shows better than 0.8 mm penetration depth at the joint. In spite of having high precision laser welding joints, it is found that there is a leak of the vacuum level in the sensor volume. The source of the vacuum leak needs to be identified for the sensor. The source could be the leak through the weld joint. To assess the vacuum leak rate quantitatively through the laser welding joint a separate test setup has been established.
5.1. Helium leak rate detection at the weld joint
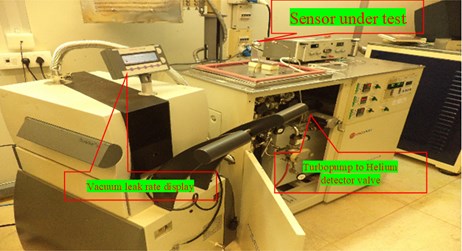
A test setup is developed as shown in the block diagram of Fig. 7(a) to measure the vacuum leak rate. Helium leak detection by spray method is one of the best choices to find the vacuum leak at the welding joints. Helium is lighter gas that can pass easily through the porous welding joint and gives chance to measure the leak rate. Helium leak rate is measured from the detection of trace gas through the joints by the spectroscopy method. As shown in Fig. 7(b) the test setup has two independents channels connected to the sensor. In the first channel, a turbomolecular pump is connected to the sensor to create the vacuum. In the second channel, the Helium leak detector is connected to measure the leak rate from the sensor. At first, the sensor volume is connected to the vacuum pump to create a vacuum of 10-8mbar, after reaching the vacuum level, the turbomolecular pump is switched off to monitor the stable vacuum level. In the second step, the sensor volume is connected to the Helium leak detector chamber. By spraying the Helium gas at the joint area of the sensor, traces of Helium is detected in the He detection chamber. Any porosity in the joint may allow Helium to leak, which can be measured by a Helium detector. The rate of Helium leak into sensor volume indicates the porosity and the vacuum leak rate at the joint.
Fig. 7a) Vacuum leak rate test setup block diagram, b) vacuum leak rate test setup equipment
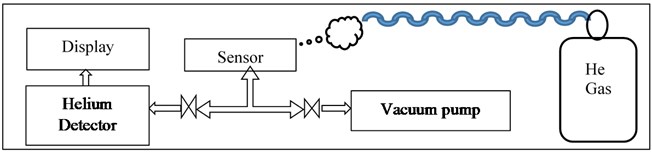
a)
b)
5.2. Vacuum leak rate experiment analysis
The vacuum leak rate () in this experiment is measured as 2×10-12mbar – L /sec. Vacuum leak rate is the time () required to degrade the vacuum level from the initial vacuum level () to the reached vacuum level () in a given sensor volume ():
where .
Sensor capsule has a hemispherical structure with a vacuum leak rate of 2×10-12mbar – L /sec., the radius of 2 cm, and volume of < 20×10-3L, it takes more than 110 Hrs to degrade the vacuum level of 10-8mbar () to 10-5mbar () to its atmosphere ambiance as per the Eqs. (11).
Table 4Leak rate analysis and sensor vacuum life
S. No. | Vacuum level of the sensor capsule (mbar) | Atmosphere ambiance for sensor capsule (bar) | Vacuum leak rate of the sensor (mbar-L/sec.) | Measured/expected vacuum lifetime of the sensor |
1 | 10-8 | 1 | 2××10-12 | 110 Hours |
2 | 10-8 | 0.1 | 2×10-13 | 45 Days |
3 | 10-8 | 0.01 | 2×10-14 | >1.2 years |
4 | 10-8 | 0.001 | 2×10-15 | >10 years |
From Table 4, experimentally it is measured that, instead of atmosphere ambiance if the sensor capsule is surrounded with an additional vacuum enclosure, the vacuum life will be improved. When the sensor ambiance is decreased from 1 bar to 0.1 bar, experimentally it is found that the vacuum life of the sensor is improved from 4 days to 45 days. When the additional vacuum enclosure has a vacuum environment of 10-3mbar, the net leak rate of the sensor can be expected to be improved from 2×10-12mbar–L /sec. to 2×10-15mbar-L/sec. This improved leak rate can sustain the vacuum for more than 10 years.
6. Conclusions
In this paper, we have presented a detailed analysis of the damping forces that appear on the resonator at various vacuum levels by measuring the factor, threshold vacuum level, and the source of the vacuum degradation through the porous weld joints in the sensor capsule. Experimentally, the vacuum degradation in the sensor capsule is analyzed in detail. From the study, it is found that the vacuum leak rate can be improved significantly by reducing the between the sensor capsule and its surroundings. By incorporating this change, the sensor vacuum can be secured for more than 10 years. Apart from the vacuum leak at the weld joints, one more reason for vacuum degradation could be the outgassing from the sensor components in the sensor capsule. It is essential to quantify experimentally, the outgassing contribution for the vacuum degradation, and remedial steps required to improve the overall vacuum life of the sensor. Further investigation is being carried out in the area of degassing from the sensor components and methods to arrest the vacuum.
References
-
Kubbat and Wolfgang J., “Application of strap down navigation to high performance fighter aircraft,” National Technical Information Service, AGARD-LS-95.
-
G. I. Dzhandzhgava, K. A. Bakhonin, G. M. Vinogradov, and A. V. Trebukhov, “Strapdown inertial navigation system based on a hemispherical resonance gyro,” Gyroscopy and Navigation, Vol. 1, No. 2, pp. 91–97, Apr. 2010, https://doi.org/10.1134/s2075108710020021
-
A. Matthews and F. J. Rybak, “Comparison of hemispherical resonator gyro and optical gyros,” IEEE Aerospace and Electronic Systems Magazine, Vol. 7, No. 5, pp. 40–46, May 1992, https://doi.org/10.1109/62.257091
-
Lynch, D. D., A. Matthews, and G. T. Varty, “Transfer of sensor technology from oil drilling to space applications,” in International Conference on Inertial Navigation Systems, 1998.
-
P. Pai, F. K. Chowdhury, C. H. Mastrangelo, and M. Tabib-Azar, “MEMS-based hemispherical resonator gyroscopes,” in 2012 IEEE Sensors, Oct. 2012, https://doi.org/10.1109/icsens.2012.6411346
-
Mittapally Gopala Krishna Murthy, Dantala Dinkar, I. Chhabra, N. Rao, K. Das, and P. Kishore, “Vibration mode analysis for control algorithm implementation in gyroscope development,” International Journal of Scientific and Technology Research, Vol. 9, No. 2, 2020.
-
D. D. Lynch, R. R. Savaya, and J. J. Campanile, “Hemispherical resonator gyro control,” U. S. Patent 2006/0248 953, 2006.
-
B. Qiu, J. Wang, and P. Li, “Full digital control of hemispherical resonator gyro under force-to-rebalance mode,” IEEE Sensors Journal, Vol. 15, No. 1, pp. 71–75, Jan. 2015, https://doi.org/10.1109/jsen.2014.2339229
-
Z. Wei, G. Yi, Y. Huo, Z. Qi, and Z. Xu, “The synthesis model of flat-electrode hemispherical resonator gyro,” Sensors, Vol. 19, No. 7, p. 1690, Apr. 2019, https://doi.org/10.3390/s19071690
-
W. Zhao, H. Yang, F. Liu, Y. Su, and C. Li, “High sensitivity rate-integrating hemispherical resonator gyroscope with dead area compensation for damping asymmetry,” Scientific Reports, Vol. 11, No. 1, pp. 1–12, Dec. 2021, https://doi.org/10.1038/s41598-020-80885-y
-
Z. Su, M. Fu, Q. Li, N. Liu, and H. Liu, “Research on bell-shaped vibratory angular rate gyro’s character of resonator,” Sensors, Vol. 13, No. 4, pp. 4724–4741, Apr. 2013, https://doi.org/10.3390/s130404724
About this article

The authors acknowledge the support and encouragement provided by the Technology Director, Navigation Systems, Group Director, Embedded computers, and Director, RCI, Hyderabad.
