Abstract
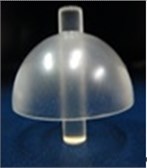
Coriolis Vibratory Gyroscope (CVG) is an inertial angular rate measurement sensor. CVG sensor comprises of metal coated hemispherical quartz vibrating structure as the rotation sensing element. It is forced to vibrate at one of its resonant modes by electrostatic excitation. Because of the limited flexibility of the quartz sensing element, the amplitude is limited to the submicron level. An ultra-high vacuum environment is required for the sensing element to sustain vibration for a long time. The criticality in the sensor development is to maintaining an ultra-high vacuum environment for the sensing element. Sensor suffers a problem of vacuum instability during the operation due to the outgassing from its components. This paper presents a novel approach in the identification of various outgassing sources that exist in the sensor, mitigation plan to minimize outgassing rate by selection of suitable raw material, suitable fabrication process of the components, and the surface characterization etc. The research work also presents the cost-effective experimental methodology to measure the outgassing rate from the sensor components to assess the CVG vacuum life, the requirement of the getter to maintain the ultra-high vacuum level throughout the CVG operation.
1. Introduction
Inertial navigation system [1] uses gyroscope and accelerometer sensors to extract instantaneous angular and position information with respect to an inertial frame, based on the dead reckoning method. Navigation accuracy depends on the bias drift of these sensors [2]. Most of the aerospace system’s primary demand is, to realize inertial sensors with good bias stability, small volume, low power consumption, and less weight. To meet these requirements, since the last few decades, different physical laws [3] have been used to develop inertial sensors, which are currently in operation. Coriolis Vibratory Gyroscope (CVG) is one of the inertial sensors which meets all the aerospace needs with high reliability. CVG has a high Q factor hemispherical [4] vibrating element, in which a two-dimensional standing vibration pattern is produced by electro-static forcing. High Q factor material offers a high damping time constant for the sensitive element. The vibrating hemisphere experiences Coriolis forces due to external rotation, which will lead to precession in the vibration pattern. The hemispherical sensitive element is made of quartz material with limited flexibility. The amplitude of vibration is close to a hundred-nanometre level to avoid fatigue in the structure [5]. CVG sensor assembly has to be encapsulated with an ultra-high vacuum [6] to minimize damping forces due to its ambiance. With time it is observed that various sensor components start outgassing [7], [8] from their surfaces into sensor capsules. This leads to vacuum degradation and its instability [9], which further leads to sensor malfunction. Outgassing is the release of vacuum contaminant gases that were trapped, absorbed, frozen, or dissolved in material surfaces during the development of raw material and component machining process. The processes which lead to outgassing are sublimation, evaporation, desorption, and seepage from cracks inside the sensor housing. Vacuum contaminants like lubricant residues after machining also lead to outgassing if not cleaned by a suitable method. The rate of outgassing increases at high temperatures because of an increase in vapor pressure and accelerated chemical reactions. Before the sensor assembly, these unwanted outgassing elements have to be removed by the process called degassing [10], [11]. The sensor component manufacturing process should ensure that vacuum exposed surfaces [12] are polished so that they can have minimum surface area for vacuum contaminants. The presence of low vapor pressure elements like Cadmium and Zinc sublimate over time into the vacuum-sealed sensor capsule. Sublimation not only lowers the vacuum quality but also gets deposited on other surfaces [13]. It is necessary to quantitatively study the detailed composition of the materials used for ultra-high vacuum packaging. The research work here narrates a specific methodology of achieving a low outgassing rate from sensor components by incorporating a specific process of material composition analysis, component machining, surface characterization, and quantitative measurement of the outgassing rate. The research work is also presents the low-cost barometric-based experimental technique for measuring the outgassing rate. The results from the experiment comprehended to estimate the outgassing rate to improve the vacuum life of the sensor and the advantage of using a getter to achieve vacuum stability.
2. Research methodology
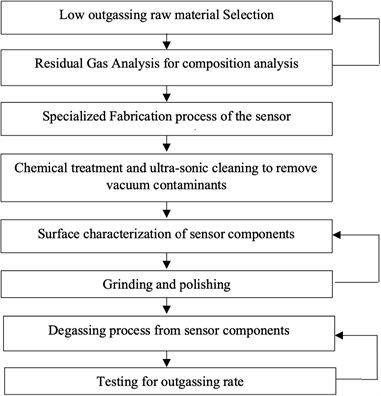
Following chart describes the various processes involved in identifying the outgassing sources, removing the outgassing elements by different methods, and quantitatively measuring the outgassing rate to estimate the vacuum life of the sensor capsule. Fig. 1 shows the methodology followed in measuring the outgassing rate from the sensor component, which affect the sensor vacuum life. Some of the processes are iterative in nature. The first iterative process is the low outgassing material selection, if the Residual Gas Analysis shows higher level of outgassing elements, raw material need to be changed as per specifications, the second iterative process is the surface characterization, if the surface quality is not improved by the grinding and polishing then the process need to be repeated, and the final iterative process is the degassing from the sensor components, if the outgassing rate from the sensor component is beyond allowed range then the degassing process is need to be repeated.
Fig. 1Outgassing methodology
3. Reduction of outgassing sources
CVG sensor has various materials like quartz glass as a sensing element, Kovar alloy (Fe:Ni: Co) for housing, glass to metal (GTM) pins for electrical contacts, and Indium solder for bonding. To minimize the outgassing from these materials, various precautions are essential to be considered in sensor development. This includes a selection of raw material with low outgassing elements, suitable components fabrication techniques, proper cleaning to get rid of the induced vacuum contaminants during the fabrication, polishing of component surfaces to minimize trapping of moisture, and other contaminants, and identification of additional outgassing sources. All these precautions are needed to be carried out in a cleanroom environment. Each of these precautionary processes adopted in the sensor development is discussed in detail.
3.1. Criteria of selecting raw material for CVG sensor
The basic material selection criteria for CVG components are to have a very low percentage of outgassing elements in the composition and the material should have the tolerance to bake-out and degassing temperatures. Hydroxyl (OH), Cadmium (Cd), and Zinc (Zn) are the main outgassing elements in the raw material and should be avoided. In the case of Hydroxyl, a Hydrogen bond occurs between two nearby OH molecules and form H2O, at a favourable temperature it converts to moisture which is a vacuum contaminant. Similarly, Cd and Zn elements will sublimate and releases in the vacuum environment. Raw material manufacturers take at most care to avoid these elements for ultra-high vacuum applications. But still, there is a possibility that these elements are present in the process of raw material development. It is necessary to quantify the presence of these elements, to assess the outgassing rate and vacuum life of the sensor capsule.
Various methods are available to test the composition of raw material quantitatively. The residual Gas Analysis (RGA) method is being used to study the composition of raw material. RGA is a spectroscopic method used for the analysis of various elements present in the material of the order of parts per million (PPM). Table 1 shows the various outgassing elements present in the raw material used to manufacture the sensor components.
Table 1Outgassing elements in the raw material
S.no. | Sensor Material | Outgassing element | Quantity in PPM | |
Manufacturer specification | Measured | |||
1 | Quartz | OH | < 300 | 282 |
2 | Kovar | Cd | < 100 | 92 |
Zn | < 150 | 145 | ||
As per Table 1, the presence of Hydroxyl in the quartz material is 282 parts per million. Similarly, the presence of Cd and Zn in Kovar material is 92 PPM and 145 PPM respectively. The mobility of these elements in the bulk of raw material is very low, chances of surfacing out are quite less from buried layers of the raw material. In case of the presence of these outgassing elements on the surface of the component can be removed by the bake-out and degassing process. Based on this measurement data, the raw material selected for the CVG sensor is within the acceptable limit as per ASTM E1559 standards for ultra-high vacuum applications.
3.2. The fabrication process-induced vacuum contaminants
The sensor component fabrication process will subject the material to an extremely high vacuum contaminating environment with organic lubricants, which get deposited on the surface. After fabrication of the raw material, its surface exposes to various vacuum contaminant layers of deposits as shown in Fig. 2. The basic raw material invasively interacts with the machine tool which suffers damage of up to 100 µm on its surface skin. This damaged surface becomes the source of vacuum contaminants. Oxide and hydroxide layers are formed above the damaged skin due to the high temperature generated during machining. Moisture and other elements are adsorbed on the surface above the oxide layer as a sorption layer. The topmost layer of the surface accumulates physical gross contaminants like oil, dust, grit, etc.
Fig. 2Contaminants layers on the surface
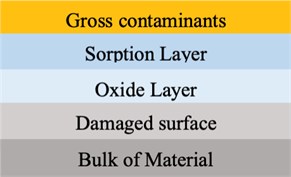
Fig. 3Machined components
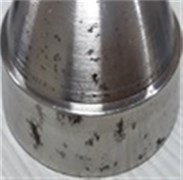
a) Kovar
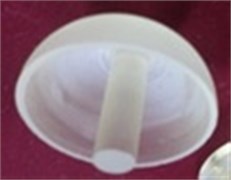
b) Quartz
Fig. 3(a) shows the sensor Kovar housing component just after machining. Fig. 3(b) shows the quartz component with the tool marking on its surface. These components cannot be used for ultra-high vacuum applications without the removal of contaminants and tool marking with a suitable process. Normal detergent-based cleaning methods may give a good surface cleanliness perception visually. But there will be lot more chances for the presence of residues of organic particles on the surface of the component. Ultrasonic cleaning is a specific cleaning method being used for the removal of physical contaminants on the metal components. In this method, sensor components are immersed in the electronic grade isopropyl alcohol in the ultra-sonic cleaning chamber. By generating ultrasonic waves in the chamber, the entrapped greasy particle from the component surface is removed. About thirty minutes will be sufficient to clean the surface of any metal component. A special chemical cleaning process is being adopted for quartz components. After cleaning, these components are to be handled with proper care in a cleanroom environment with hand gloves and in a sealed container to avoid fingerprints, dirt, moisture, and other contaminants. Sorption and oxide layers are removed with the degassing process which is discussed in further sections. After the cleaning process, the irregular surface texture is required to be corrected to make it compatible with an ultra-high vacuum.
3.3. Surface characterization of sensor components
Irregular component surface texture offers more surface area for the sorption process. To make the component compatible with ultra-high vacuum environments, their surface micro-irregularities are to be analyzed quantitatively and are to be minimized. To study the surface irregularities of CVG components, Taylor-Hobson made an optical non-contact profiler has been used as shown in Fig. 4. It has the capability to image the surface in three dimensions with an accuracy of 50 nm over the sample area of 100 cm2. The surface measurement parameters from the optical profiler are generated as per ISO 4287 standards which is a surface texture parameter measurement. As per this standard, the sample surface parameters like mean to peak (), mean to the valley (), peak to peak (), and average roughness () are measured and tabulated.
Fig. 4Optical profiler
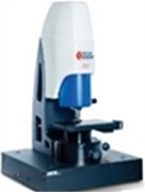
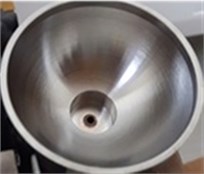
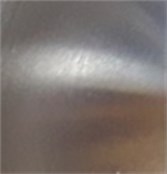
Fig. 5Sensor Kovar Housing
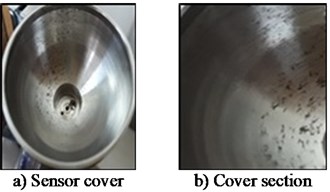
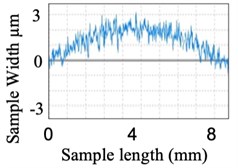
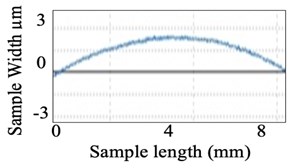
Fig. 5(a) shows, vacuum exposed side of the sensor housing cover. The surface has a clear visual irregular texture due to tool marking. Fig. 5(b) shows a small section of the component with a surface area of 10 mm×10 mm. The graphical representation of surface roughness measured by the optical profiler is as shown in Fig. 6. This graph shows surface irregularities are within ±3 µm over the sample length of 8 mm. Table 2 shows the measured surface parameters of the sample surface of Kovar.
Fig. 6Surface irregularities of component
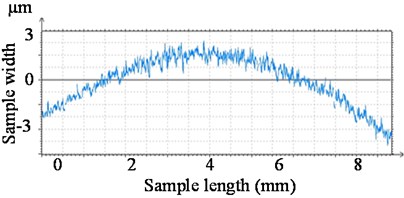
Table 2Surface parameters of Kovar component
S. No. | Description | Parameter | Measurement (µm) |
1 | Mean to Peak | 3.17 | |
2 | Mean to valley | 2.08 | |
3 | Peak to Peak | 5.25 | |
4 | Average roughness | 0.92 |
Fig. 7Representation of sample irregularities
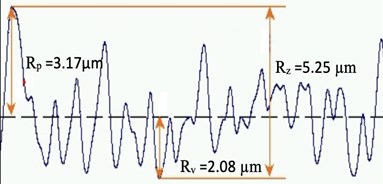
It is observed from the measurement that, in a given sample area, the height of the surface peak from the mean line is 3.17 µm. The depth of the surface valley from the mean line is 2.08 µm. The overall peak-to-peak surface variation is 5.25 µm. Fig. 7 shows the representation of sample surface texture details with measured parameters. These surface irregularities are good traps for moisture, fine dust, OH, and Hydrogen, which start outgassing under their favourable ambient conditions. Component surface roughness is essential to be improved for an ultra-high vacuum applications. Surface polishing is a process used to improve surface irregularities based on material.
3.4. Surface polishing
To improve the surface roughness, various polishing techniques are available. For the metal polishing, Silicon Carbide-based powder abrasive material is used. The size of the abrasive grain varies from coarser to finer as per surface parameters. Special fixtures have been designed as per the component shape for polishing. Visible surface roughness improvement was observed on the component surface as shown in Fig. 8(a). After polishing, again the component surface is analyzed by using the optical profiler.
Fig. 8Polished Kovar component surfaces
a) Inner view
b) Small section
Fig. 9Irregularities of Polished surface
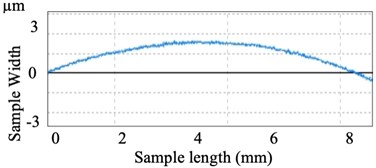
Fig. 8(b) shows the small section of 10 mm×10 mm polished surface. Fig. 9 shows the graphical view of the surface roughness measured by the optical profiler after polishing. These measurements of surface roughness parameters are as shown in Table 3.
Table 3Surface profile parameters of the component after polishing
S. No. | Parameter | Measurement (µm) |
1 | 1.01 | |
2 | 0.97 | |
3 | 1.98 | |
4 | 0.42 |
Similarly, surface roughness studies have been carried out for quartz components. Fig. 10(a) shows the quartz component before polishing and Fig. 10(b) graphical view of its surface over a small section. Fig. 11(a) shows the visual improvement of the surface of the quartz component after polishing and Fig. 11(b) shows the graphical view of the polished surface.
Fig. 10Before polishing of the component

a) Quartz
b) Graphical view
Fig. 11After polishing of the component
a) Quartz
b) Graphical view
Table 4Surface profile of quartz component before and after polish
S. No. | Parameter | Before polish (µm) | After polish (µm) |
1 | 2.72 | 1.21 | |
2 | 1.87 | 0.87 | |
3 | 4.60 | 2.08 | |
4 | 0.98 | 0.32 |
3.5. Results of surface profile improvement
From the surface roughness parameter analysis, it is realized that there is a significant improvement in surface irregularities of sensor components.
Table 5 shows the percentage improvement of the surface roughness parameters for the Kovar and the quartz components. It is clear from the measurement data that, polishing considerably improved the surface roughness. Kovar component shows an overall 62 % improvement in surface peak to peak irregularities with polishing. Whereas in the case of quartz the improvement of the same parameters is 55 %. This improved surface offers less surface area to the vacuum environment. A polished surface lowers the traps for accumulated outgassing elements.
With the above processes, all the components surfaces are free from external vacuum contaminants. But there exist some outgassing sources inside the material, which degrades the vacuum level of the sensor capsule. These sources are to be identified and removed to make them ultra-high vacuum compatible.
Table 5Surface profile improvement of sensor components
S. No. | Parameter | Improvement of surface roughness parameters (%) | |
Kovar | Quartz | ||
1 | 51 | 55 | |
2 | 69 | 53 | |
3 | 62 | 55 | |
4 | 63 | 67 | |
4. Degassing from sensor component
Degassing is a process in which, vacuum contaminants are removed by forceful outgassing from the component surface. Most of the outgassing elements have temperature and vacuum-dependent outgassing rates from the surface. This dependency can be exploited to get rid of the vacuum contaminants. In the vacuum bake-out process, components are exposed at the temperature of 150 °C and vacuum of 3×10⁻³ mbar for 12 hours, to drive off volatiles such as moisture and traces of organic deposits from the surface. After the bake-out process, the Hydrogen outgassing rate becomes the dominant source, but its residues can get depleted from the surface at 10-5 mbar vacuum at 150 °C. As the mobility of the Hydrogen is very low, five days are required to remove Hydrogen from the surface in the thermo-vacuum chamber. It can be measured by using a mass spectrometer-based gas analyzer probe.
4.1. Degassing of low vapor pressure elements
Low vapor pressure elements like Cd and Zn will sublimate with time into the encapsulated sensor volume and degrades its vacuum level. A quantitative study of the presence of these elements in the raw material has been carried out by using RGA. By creating a suitable ambiance for Cd and Zn, these elements can be removed from the component surface. The ambiance required to remove these elements is based on vapor pressure estimates of Cd and Zn as per the following equations.
Zn vapour pressure:
Cd vapour pressure:
where – vapour pressure of the element, – atmospheric pressure, – temperature in Kelvin.
The rate at which molecule leaves from the surface into the vacuum in g/cm2/sec can be expressed by the Langmuir equation as the vaporization rate:
where – molecular weight of the material in the gas phase, – temperature in Kelvin.
From Eq. (1), (2), and (3) vapor pressure and vaporization rate of Cd and Zn which can be calculated at various temperatures. At the temperature 125 °C and 150 °C, the vapor pressure and vaporization rate are tabulated in Table 6.
Table 6Vapour pressure and vaporization rate of Cd and Zn
S. No. | Temp. °C | Cd | Zn | ||
Vapour pressure (mbar) | Vaporization rate (g/cm2/sec) | Vapour pressure ( (mbar) | Vaporization rate (g/cm2/sec) | ||
1 | 125 | 2.3×10⁻⁶ | 5.1×10⁻¹² | 1.2×10⁻⁸ | 3.12×10⁻¹² |
2 | 150 | 1.7×10⁻⁵ | 3.5×10⁻¹¹ | 1.2×10⁻⁷ | 8.05×10⁻¹⁰ |
From the above theoretical data, it is obvious that by subjecting the sensor components at different temperature and vacuum conditions, Cd and Zn can be removed from the component surface. At a vacuum level of 1.7×10⁻⁵ mbar and temperature of 150 °C for 72 hours, Cd can be removed from the component surface with a vaporization rate of 3.5×10⁻¹¹ g/cm2/sec. Similarly, to remove Zn, the vacuum level of 1.2×10⁻⁷ mbar vacuum at a temperature of 150 °C for less than 72 hours, with the vaporization rate of 8.05×10⁻¹⁰ g/cm2/sec. At a normal operating temperature less than 40 °C and a vacuum level of 10-9 mbar for the sensor, the mobility of the buried Cd and Zn elements in the bulk of the material is negligible, hence they will not contribute to outgassing.
5. Experimental verification of outgassing rate
The outgassing rate of a sample can be measured as the quantity of gas (pressure × volume) released per unit surface area per unit time. The common measurement unit of the outgassing rate is mbar-L/cm2-sec. The outgassing rate from all the sensor components is to be measured experimentally to assess the vacuum life of the sensor before vacuum encapsulation. The most common test method to measure the outgassing from sensor components is by measuring the Total Mass Loss (TMS) as per ASTM test standards by NASA. In this method, the sample is subjected to a thermo-vacuum environment for 25 hours and measure the mass loss from the sample by collecting volatile condensable matter. By measuring the weight of the sample by high precision micro-balance before and after the test, the outgassing rate can be calculated. The result of this experiment is depended on the micro-balance accuracy. An alternate method also exists to measure the outgassing rate from the component surface. In this method, the sample is subjected to the thermo-vacuum chamber at a temperature of 150 °C with a vacuum of 10-9 mbar for at least 12 hours duration. During the experiment, if the sample starts outgassing, there will be degradation in the chamber vacuum level. With proper calibration of the vacuum gauge, the outgassing rate from the component surface can be measured directly from the degraded vacuum level of the chamber. The outgassing rate can be calculated from Eq. (4):
where – initial chamber vacuum level at time , – chamber vacuum level after the experiment at time , – the volume of the chamber, – area of the chamber surface.
The criticality in this experiment is that the chamber outgassing rate is to be ensured lower than the sensor components outgassing rate.
6. Measurement of outgassing rate of the chamber
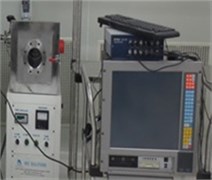
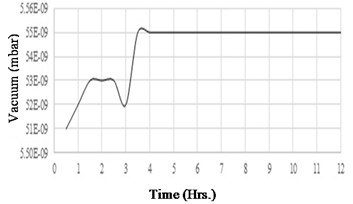
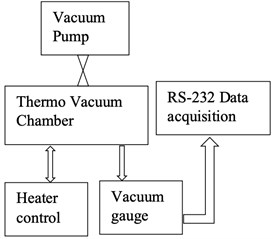
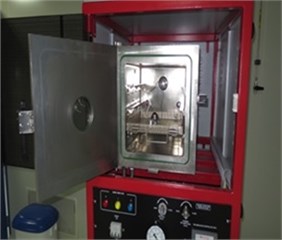
Before testing the degassing rate of the components, it is necessary to confirm that the vacuum chamber has a low and stable outgassing rate. The vacuum chamber selected in this experiment has very low outgassing metal surfaces. To measure the outgassing rate of the chamber, a test setup has been established. The vacuum chamber is used in this experiment has 1L volume and has an in-built heater controller to set and control the temperature. This experiment's aim is to measure the rise in the vacuum level over 12 hours. Fig. 12(a) shows a schematic of the experimental setup, external turbo molecular pump connected to the vacuum chamber with an ON/OFF valve. At the beginning of the experiment, the chamber is set to a vacuum of 1×10⁻⁹ mbar and temperature of 150 °C for about 2 hours. After the valve is switched OFF, the chamber vacuum level is continuously acquired by an external data acquisition system by using the RS232 data interface. Fig. 12(b) shows the experiment instrumentation of the test setup. As the chamber has a metal gasket, there is a negligible leak of vacuum from the joints, hence the rise in vacuum level is negligible through the chamber joints. If any rise in the vacuum level over the period of 12 hours, it is only due to the outgassing from the walls of the chamber. The vacuum gauge reading was acquired for a sample rate of 5 minutes over the period of 12 hours and the data is plotted as shown in Fig. 13. Analysis of the experiment is discussed in section 7.
Fig. 12Experimental test setup for chamber degassing measurement
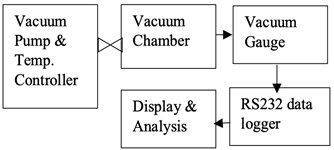
a) Experimental schematic
b) Instrumentation
From the above experiment, it is observed that the chamber has an outgassing rate of 1.53×10⁻¹⁵mbar-L/cm2-sec which is very low for any ultra-high vacuum applications.
Table 7Outgassing parameters of the chamber
S. No. | Parameter | Values |
1 | Chamber volume | 1000 cm3 |
2 | Chamber surface area | 600 cm2 |
3 | Maximum vacuum | 5.51×10⁻⁹ mbar |
4 | Minimum vacuum | 5.55×10⁻⁹ mbar |
5 | The rise in vacuum (P2-P1) | 0.04×10⁻⁹mbar |
6 | Volume to area ratio (V/A) | 1.66 Cm |
7 | Outgassing rate | 1.53×10⁻¹⁵ mbar-L/ cm2-sec |
Fig. 13Vacuum variation of the chamber
7. Outgassing rate of the sensor components
The outgassing rate of CVG sensor components needs to be measured experimentally before vacuum sealing. Fig. 14 shows the schematic view of the sensor assembly. Table 8 shows the surface area of each component exposed to the vacuum environment in the sensor volume. These component surfaces are prepared for an ultra-high vacuum with proper cleaning and surface polishing.
Table 8Sensor components surface area
S. No. | Component | Surface area (cm2) |
1 | Quartz | |
Inner surface | 15.52 | |
Outer surface | 11.81 | |
2 | Pickoff block | 7.82 |
3 | Housing inner surface | 28.85 |
Fig. 14CVG sensor schematic view: 1 – sensor cover, 2 – quartz component, 3 – pickoff block, 4 – GTM pins
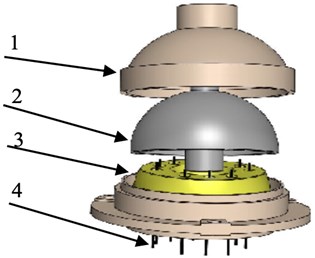
Fig. 15(a) shows the schematic of the experimental setup. In this test setup, sensor components are placed in the thermo-vacuum chamber whose outgassing rate is 1.53×10⁻¹⁵ mbar-L/cm2-sec. The chamber is connected to the turbo molecular pump through an ON/OFF valve. The data acquisition channel is connected to the vacuum gauge for vacuum data logging. Fig. 15(b) shows the instrumentation of the thermo-vacuum chamber with sensor components. Initially, the chamber is heated through the heater controller to 150 °C and evacuated to 1×10⁻⁹mbar to remove traces of moisture and other atmospheric gases from the walls. After 2 hours of the active evacuation of the chamber, the external vacuum pump is switched off through the ON/OFF valve. The vacuum level of the chamber is recorded for 15 hours through the RS232 data acquisition channel for every 5 min sample rate.
Fig. 15Experimental test setup for sensor component degassing
a) Chamber schematic
b) Sensor components in the chamber
In this experiment, if the sensor components outgassing rate is higher than the chamber outgassing rate, then there will be a rise in vacuum level which is more than the chamber outgassing rate. Otherwise, the vacuum rise will be similar to that of the chamber. Vacuum gauge data plotted over the experimental duration of 15 hours is as shown in Fig. 16. From the recorded data it is observed that there is a steady vacuum level of the chamber and has no sign of further vacuum degradation. Table 9 shows the measurements of the chamber with the sensor components. The analysis of the outgassing rate from these two experiments is as per the following results discussion Section 7.
Fig. 16Vacuum stability of the chamber
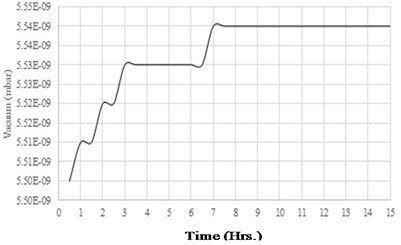
Table 9Outgassing parameters of the chamber with sensor components
S. No. | Parameter | Values |
1 | Chamber volume with sensor components | 1050 cm3 |
2 | Chamber with sensor components | 664 cm2 |
3 | Higher vacuum (P1) | 5.50×10⁻⁹ mbar |
4 | Lower vacuum (P2) | 5.54×10⁻⁹ mbar |
5 | Degradation in vacuum (P2-P1) | 0.04×10⁻⁹mbar |
6 | Volume to area ratio (V/A) | 1.58 cm |
7 | Outgassing rate | 1.17×10⁻¹⁵mbar-L/cm2-sec. |
8. Results discussion
In the first experiment, it is measured that there is a rise in vacuum level of 0.04×10⁻⁹ mbar over 12 hours duration. From Fig. 13, it is observed that for the initial four hours there is a variation in vacuum level and get stabilized for the next 8 hours. Stabilized vacuum level of the chamber indicates that there is no further outgassing from the walls of the chamber. As per the chamber outgassing parameters from Table 7, the outgassing rate of the chamber can be calculated as per Eq. (4) is 1.53×10⁻¹⁵ mbar-L/cm2-sec. This outgassing rate is constant over the period of the next 8 hours. With the reference to this chamber outgassing rate, CVG sensor components outgassing rate is again measured by repeating the experiment. In the second experiment, sensor components are placed inside the chamber. The results of this experiment are plotted and shown in Fig. 16. It is observed from this data that, there is a gradual rise in vacuum level for the first seven hours, and for the next 8 hours the vacuum level got stabilized. Experiment duration is extended for 3 more hours than the actual time of 12 hours, to confirm the stability of the vacuum level of the chamber with the sensor components. Table 9 shows the outgassing parameters of the chamber with the sensor components. Since the sensor components are added in the chamber, there is an addition of sensor volume of 50 cm3 and surface area of 64 cm2 to the chamber. In this experiment, the degradation of vacuum is recorded as 0.04×10⁻⁹ mbar. By using equation (4), the outgassing rate of the chamber with components has been calculated as 1.17×10⁻¹⁵ mbar-L/cm2-sec. The slight difference in the outgassing rate is due to the extra addition of sensor components to the chamber. Hence there is no extra outgassing source added to the chamber with the sensor components. The vacuum life of the CVG sensor due to outgassing is as shown in Table 10. From the table, it is clear that the sensor components outgassing will not impact the vacuum degradation in the sensor capsule. The outcome of this work ensures the sensor vacuum life of 10 years with proposed counter outgassing sources.
Table 10Impact of outgassing and sensor vacuum life
S. No | Parameter | Measured data |
1 | Outgassing rate by sensor components | 1.17×10⁻¹⁵ mbar-L/cm2-sec. |
2 | Sensor components vacuum exposed surface area | 32 cm2 |
3 | Sensor volume | 50×10-3 Litre |
4 | Minimum operation life of the sensor | 1×10⁻⁵ mbar |
5 | Vacuum life of sensor due to outgassing from its components | >10 years |
9. Conclusions
The outgassing from the sensor component is the prime concern of any ultra-high vacuum encapsulated sensor. In this paper, we have discussed various sources of outgassing, vacuum contaminants, and the requirement of surface treatment of the components to make them compatible with ultra-high vacuum environments. Experimentally measured outgassing rate of sensor components helped to assess the vacuum life of the sensor capsule. From the experimental results, it is concluded that the measured outgassing rate of 1.17×10⁻¹⁵ mbar-L/cm2-sec from the sensor component is not responsible for the degradation of the vacuum life of the sealed sensor. This outgassing rate will ensure the sensor capsule volume of 50 CC with a vacuum level of up to 1×10⁻⁵ mbar for more than 10 years. This outgassing rate has been achieved by following a specific methodology as discussed to minimize the outgassing rate at various stages of sensor development. However, high vacuum-sealed sensor packages sometimes show degradation of vacuum levels in their lifetime. To overcome this condition, an ultra-high grade vacuum package generally incorporates a getter to adsorb the leftover residual gases. A getter is a chemically reactive material that is in the form of a coating on the vacuum exposed surface or in the form of flat beads which can be fixed inside the sensor. After vacuum sealing of the sensor package with getter inside, there will be no possibility for degradation of vacuum level throughout its lifetime.
References
-
Kubbat and Wolfgang J., “Application of strap down navigation to high performance fighter aircraft,” AGARD-LS-95, National Technical Information Service (USA).
-
G. I. Dzhandzhgava, K. A. Bakhonin, G. M. Vinogradov, and A. V. Trebukhov, “Strapdown inertial navigation system based on a hemispherical resonance gyro,” Gyroscopy and Navigation, Vol. 1, No. 2, pp. 91–97, Apr. 2010, https://doi.org/10.1134/s2075108710020021
-
A. Matthews and F. J. Rybak, “Comparison of hemispherical resonator gyro and optical gyros,” IEEE Aerospace and Electronic Systems Magazine, Vol. 7, No. 5, pp. 40–46, May 1992, https://doi.org/10.1109/62.257091
-
P. Pai, F. K. Chowdhury, C. H. Mastrangelo, and M. Tabib-Azar, “MEMS-based hemispherical resonator gyroscopes,” 2012 IEEE Sensors, Oct. 2012, https://doi.org/10.1109/icsens.2012.6411346
-
A. Shishegaran, M. R. Khalili, B. Karami, T. Rabczuk, and A. Shishegaran, “Computational predictions for estimating the maximum deflection of reinforced concrete panels subjected to the blast load,” International Journal of Impact Engineering, Vol. 139, No. 9, p. 103527, May 2020, https://doi.org/10.1016/j.ijimpeng.2020.103527
-
N. Marenco et al., “Vacuum encapsulation of resonant MEMS sensors by direct chip-to-wafer stacking on ASIC,” in 2008 10th Electronics Packaging Technology Conference (EPTC), Dec. 2008, https://doi.org/10.1109/eptc.2008.4763526
-
R. N. Candler et al., “Long-term and accelerated life testing of a novel single-wafer vacuum encapsulation for MEMS resonators,” Journal of Microelectromechanical Systems, Vol. 15, No. 6, pp. 1446–1456, Dec. 2006, https://doi.org/10.1109/jmems.2006.883586
-
B. Schläppi et al., “Influence of spacecraft outgassing on the exploration of tenuous atmospheres with in situ mass spectrometry,” Journal of Geophysical Research: Space Physics, Vol. 115, No. A12, pp. n/a–n/a, Dec. 2010, https://doi.org/10.1029/2010ja015734
-
C. G. Yang, Y. J. Li, X. Gao, and L. Xu, “A review of vacuum degradation research and the experimental outgassing research of the core material – pu foam on vacuum insulation panels,” Physics Procedia, Vol. 32, pp. 239–244, 2012, https://doi.org/10.1016/j.phpro.2012.03.549
-
R. Grinham and A. Chew, “A review of outgassing and methods for its reduction,” Applied Science and Convergence Technology, Vol. 26, No. 5, pp. 95–109, Sep. 2017, https://doi.org/10.5757/asct.2017.26.5.95
-
T. Triyono, N. Muhayat, A. Supriyanto, and L. Lutiyatmi, “Effect of degassing treatment on the interfacial reaction of molten aluminum and solid steel,” Archives of Foundry Engineering, Vol. 17, No. 2, pp. 227–239, Jun. 2017, https://doi.org/10.1515/afe-2017-0080
-
Z. Jiao, L. Jiang, J. Sun, J. Huang, and Y. Zhu, “Outgassing environment of spacecraft: an overview,” IOP Conference Series: Materials Science and Engineering, Vol. 611, No. 1, p. 012071, Oct. 2019, https://doi.org/10.1088/1757-899x/611/1/012071
-
K. Battes, C. Day, and V. Hauer, “Systematic study of the outgassing behavior of different ceramic materials,” Journal of Vacuum Science and Technology B, Vol. 39, No. 3, p. 034202, May 2021, https://doi.org/10.1116/6.0000954
About this article

The authors acknowledge the support and encouragement provided by the Technology Director, Navigation Systems, Group Director, Navigation and Embedded Computer Systems, and Director, RCI, Hyderabad.
