Abstract
The research mainly focuses on the fatigue strength characteristics of 6061-T6 aluminum alloy fillet welds under different vibration frequencies. Firstly, by introducing Stress Life Curve (S-N Curve) and Probability Stress Life Curve (P-S-N Curve), the external vibration stress effects of the main load-bearing points in the stress environment of welded joints are analyzed. Subsequently, a vibration test control system is designed to analyze the relationship between vibration frequency and fatigue strength through nominal stress analysis and hot spot stress analysis. The research findings revealed that under the nominal stress analysis method, the P-S-N fitting curve showed a declining trend with an increase in fatigue life for stress variation curves with survival rates of 50 %, 95 %, and 97.7 % at vibration frequencies of 57.5 Hz, 67.5 Hz, and 77.5 Hz. At the same survival rate stress conditions, the fatigue life variation formed by resonance frequency was smaller, and the fatigue life in the resonance state was relatively lower. There is a certain correlation between vibration frequency and fatigue strength, with resonance frequency corresponding to relatively low fatigue life. This research result helps to reveal the fatigue behavior of 6061-T6 aluminum alloy fillet welds under different vibration stresses, providing a reference for the structural safety design of aluminum alloy components.
1. Introduction
With the increasing demand for lightweight alloy components, aluminum alloy corner welding, as a lightweight alloy welding technology, has gradually been widely used [1]. In fields such as rail trains and aerospace, fillet weld welding technology can improve connection efficiency while preventing fatigue failure accidents under external loads [2]. In practical applications, alloy components often need to withstand vibration fatigue [3]. Vibration fatigue is different from ordinary metal fatigue and is a resonant fatigue that occurs under alternating loads [4]. The inherent frequency response can lead to changes in the fatigue life of the firmware, once the external vibration frequency is consistent with the natural frequency of the component [5]. The change results in an excessive dynamic stress response, which greatly reduces the service life of the component [6]. Welded joints are often the most prone to fatigue and damage [7]. In the case of a large number of welds in the component, fillet welds, as one of the main load-bearing areas of the weld, are more prone to fatigue damage under external vibration, which makes it difficult for the component to continue using [8-9]. Therefore, this study mainly focuses on aluminum alloy fillet welds and explores the changes in fatigue strength of aluminum alloy components under the influence of different vibration frequencies. On the basis of exploring the relationship between vibration frequency and fatigue strength of aluminum alloy fillet welds, this study reveals the fatigue characteristics of 6061-T6 aluminum alloy fillet welds under different vibration stresses, starting from the fatigue strength characteristics under different vibration frequencies. This provides a targeted reference for the structural safety design of aluminum alloy components. Compared to other studies, this study focuses more specifically on the external vibration stress at the load-bearing points of welded joints, in order to improve the fatigue life and structural safety of aluminum alloy components. The contribution of the study is to systematically analyze the fatigue strength characteristics of 6061-T6 aluminum alloy fillet welds under different vibration frequencies, explore the relationship between vibration frequency and fatigue strength, and provide a reference for the structural safety design of aluminum alloy components. Research on aluminum alloy fillet weld components suitable for rail trains, aerospace, and other fields, which need to maintain high strength and long lifespan in vibration environments. The analysis of the relationship between vibration frequency and fatigue strength in the study helps to reveal the fatigue law of aluminum alloy fillet welds under a vibration environment, providing guidance for the design and application of aluminum alloy components.
This study investigates the effect of excitation frequency on the fatigue strength of 6061-T6 aluminum alloy during fillet welding, using a combination of experimental and theoretical methods. In terms of material fatigue performance, researchers have proposed various methods that can quickly test or theoretically derive S-N curves and P-S-N curves, and have focused on the dispersion and reliability of materials. In terms of fatigue strength assessment of welded structures, research has focused on the effects of various factors, such as stress concentration, welding defects, welding residual stress, plate thickness, and load form, and attempted to seek reasonable solutions suitable for different load conditions. The innovation of this study lies in using excitation frequency as an important parameter to describe vibration fatigue and achieving high-precision and high-efficiency fatigue strength assessment of welded joints in practical engineering applications.
2. Referencing
The research in fillet welding is diversifying in recent years, Yang L. et al. performed finite element analysis for noncorrosive steel fillet welded joints to investigate the metamorphosis and fracture conditions of the fillet weld in stainless steel materials. The results showed that lateral fillet welded joints were stronger than vertical fillet weld, reaching 1.5 times the strength [10]. Mikulski Z’s team analyzed the tired level of fillet weld joints and measured the depth of cracks formed during the test. The results demonstrated that in the low-stress range, the fatigue process occurred mainly in the initial stage [11]. The team of Schubnell J analyzed the tired level of fillet welded joints during the welding procedure and the endurance life under stress requirements, and the tests were completed mainly on steel alloy materials with transverse stress simulations. The results showed that the residual stresses were in a state of complete relaxation under high-pressure loading and in a state of slight relaxation under strong tensile loading [12]. Xu G’s team raised a 3-D transient pattern to explore the laser of a horizontal weld on an aluminum alloy, which analyzed the formation of liquid metal in the joint geometry during the formation of the weld. The data indicated that in the low-capacity output environment of the laser, the fluid flow in the weld showed a downward flow and an aggregation at the horizontal plate [13]. Tian L. applied the intrinsic deformation way to the weld deformation of complex structures and developed an SVM way to forecast the fillet weld metamorphosis. The data emanate the model exhibited superior performance in longitudinal evaluation [14].
Also, studies on the fatigue strength of metals are increasing. Zhu S. P. et al. explored the degree of fatigue exhibited by different scale builds. The study emphasized fatigue failure analysis in fracture mechanics by probing the process size effect [15]. The team of Meneghetti G explored the influence of the thermal processing of steel alloys on the static and axial fatigue behavior of metals. The analysis displayed that the effect of defects acting in the fatigue behavior was due to the initial stress intensity of fatal defects on the fracture surface spawned by [16]. Shahzad A. team compared the fatigue resistance of metal and synthetic fibers and the results showed that the initial damage of complex materials fatigue behavior was generated earlier, but the spread of initial damage was prevented by the inside construction of the material [17]. Nakatani M. explored the effect of external roughness on the fatigue limit of alloys and the study evaluated the fatigue limit by rotational bending test. The results showed that external harshness had a critical effect on the fatigue strength of alloy components [18]. Baumgartner J.’s team used available fatigue data for local fatigue strength assessment, and the study showed that stress gradients in weld profile geometry can be effectively assessed using finite element ways [19]. The research in the field of fillet welds and metal fatigue has focused on the stress variation under alloy stress conditions. The research also investigates the association between the vibration frequency and fatigue strength of aluminum alloys during fillet welds from this perspective.
3. Vibration fatigue theory and fatigue assessment for welded frameworks
3.1. Vibration fatigue theory of welded structures
The endurance life of a material is the quantity of loop or time that a material's structure undergoes before fatigue damage occurs under alternating loads, and fatigue damage is the most important cause of structural failure in engineering. The fatigue failure process usually contains three stages: crack sprouting, crack expansion, and fatigue fracture, with crack sprouting dominating the endurance life. Welded frameworks are broadly used in practical engineering because of their ease of connection, and fatigue damage often occurs due to their frequent exposure to random vibration loads. To research the vibration frequency-fatigue value action of 6061-T6 aluminum alloy in the process of fillet welding, the study first investigates the vibration fatigue theory and fatigue value evaluation way of welded frameworks.
The association between fatigue resistance and endurance life of a material structure under a given fatigue load is represented by the S-N curve. The S-N curves of materials are usually determined by smooth or notched round bar specimens or plate specimens, and fatigue tests based on tensile, bending, and torsion are the main ways of determination. p-S-N curves are S-N curves with different survival rates P specified in the presence of dispersion in fatigue life, and fatigue test data are obtained by processing using mathematical and statistical ways, usually with the probability of failure as a parameter. A family of S-N curves, which have high requirements in the reliability design of structures. Both curves can be used to represent the fatigue performance of a material or framework under recursive loading. In order to meet the prerequisite of analytical accuracy and reduce the test workload, researchers have proposed various ways that can quickly test or theoretically derive S-N curves and P-S-N curves. The key to getting the P-S-N curve of the material is the reasonable fitting of the vibration fatigue data, and the power function, finger function, and three-parameter power function models are often used for fitting in fatigue design and fatigue performance tests. The power function model is displayed in Eq. (1):
The exponential function model is shown in Eq. (2):
The three-parameter power function model is shown in Eq. (3):
In Eq. (1) to Eq. (3), indicates the stress amplitude under cyclic loading, indicates the fatigue life corresponding to the stress amplitude , , and are the relevant constants, and indicates the theoretical fatigue limit. There are many standards or codes for fatigue assessment of welded structures at home and abroad, among which the International Institute of Welding (IIW) standard has a reliable theoretical basis, a great deal of experimental information, and a high degree of application, so the study uses the IIW standard for the assay and assessment of vibration fatigue. IIW standard for the classification of the nominal stress S-N curve of aluminum alloy structures is shown in Fig. 1.
Fig. 1Classification of nominal stress S-N curves of aluminum alloy structures in IIW standard
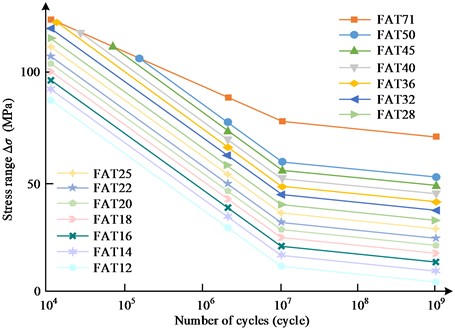
The standardized S-N curve is a class of S-N curves with the same slope and inflection point, and the different curves only need to be distinguished by the fatigue grade FAT value. Using 107 times as the turning point to divide the S-N curve into two sections, the curves in the figure, in addition to the parent material life curve FAT71, the remaining 13 curves parallel to each other, that is, the same slope = 3. After the inflection point curve slope = 22, due to the role of small loads into account, the stress range of each 10 % reduction, fatigue life will increase by one grade, IIW standard IIW curve survival rate of more than 95 %. The standardized curve equation is shown in Eq. (4):
where, represents the quantity of loop, represents the quantity of loop corresponding to the inflection point, represents the fatigue level, and and represent the slope of the superior and caudal sections of the curve, separately. According to the quantity of fatigue loops of the framework, the fatigue problem is generally classified as low loop fatigue, high and ultra-high loop fatigue. The number of fatigue cycles is usually greater than 104-105, and the level of action stress is lower, usually less than the yield limit, so there is no obvious plastic deformation at the macroscopic level. However, the possibility of higher plastic strain in the local area at the microscopic level is higher, thus it can be seen that high perimeter fatigue failure has a highly localized feature. IIW standard is used for high perimeter fatigue issues, but not fit for The IIW standard is fit for high loop fatigue issues, but not for low loop fatigue with less than 104 cycles. The fatigue breakdown of the framework is the process of continuous accumulation of breakdown, damage is generated by a certain amplitude of stress, when the structure under each cycle load stress amplitude is greater than the S-N curve endurance strength, the structure forms a certain degree of damage. When the accumulated damage is greater than the specified threshold value, the structure will be fatigue damage. Scholars have obtained a variety of fatigue damage accumulation models through a large number of experiments and theories, including Miner linear fatigue damage accumulation theory proposed in the fatigue process of each stress loop will produce a definite amount of breakdown, these damages can be linearly superimposed, as in Eq. (5):
where, represents the actual quantity of the loop at a definite stress amplitude , represents the total quantity of loop, and represents the total amount of damage to the structure during fatigue. Although this theory has shortcomings in the consideration of the effects of the sequence of stress cycles, it is widely used because it is ordinary and handy in engineering employments and can meet the needs of engineering analysis.
3.2. Vibration fatigue assessment way for welded structures based on the stress-life relationship
Welded joints have a unique geometric configuration, resulting in a more complex toe stress state, and the stress distribution is generally highly nonlinear, so most of the welded frameworks in the actual engineering in the toe out of the cracks resulting in fatigue fracture. Engineering research based on the stress-life relationship in the fatigue evaluation of welded joints is nominal stress way, hot spot stress way, and linear elastic notch stress way. The basic idea of these ways is to determine the stress factors at the weld toe, and then use the corresponding P-S-N curve and fatigue breakdown accumulation criteria to assess endurance life. A typical welded joint stress distribution is generally divided into three regions, as shown in Fig. 2, where indicates the plate thickness.
Fig. 2Typical welding joint stress distribution
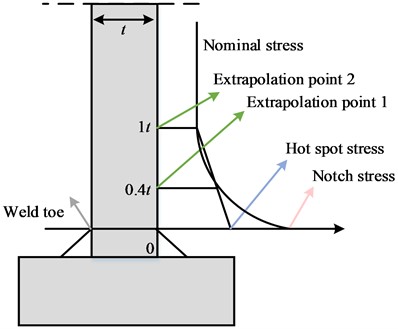
The nominal analysis way is the most conventional of the ways for analyzing structural fatigue and is often applied in actual engineering construction. It is the average stress of the cross-section without regarding the local details of the welded joint. For a simple welded structure under basic load, the nominal stress of the hazardous section can be obtained by the analytical way of material mechanics as in Eq. (6):
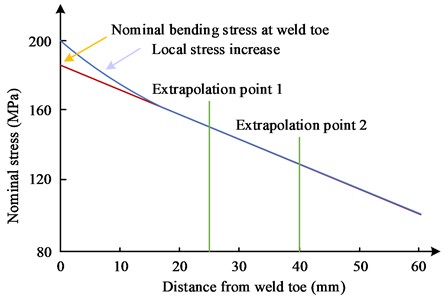
where, denotes the nominal stress, and denote the axial force and area of the section, respectively, and denote the bending moment and inertia moment of the section, separately, and denotes the distance between the calculated point and the neutral axis. Nominal stresses are extracted mainly by the form of their loading, and the location of the nominal stresses in the weld toe area is obtained differently for welded structures under different loads. When the load mode is tensile, the stress is usually extracted at 70 mm from the toe as the nominal stress; when the load mode is bending, the peak non-linear stress caused by the local details of the welded joint disappears at 25 mm from the toe, and as the toe gets farther and farther away, the stress is gradually reduced in a diagonal distribution. is calculated at the weld toe as in Eq. (7):
where, the two stress extrapolation points are 25 mm and 40 mm from the weld toe, and and represent the nominal stresses at the two extrapolation points, respectively. The extraction of of the weld toe is shown in Fig. 3.
Fig. 3Schematic diagram of nominal stress extraction at weld toe
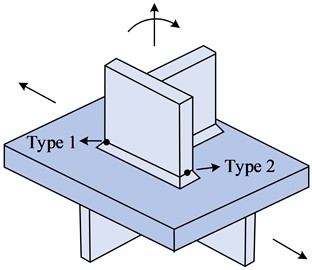
The hot spot stress way, i.e., geometric stress, refers to the stress regard effect originating from the shape and size of the welded joint without considering the specific construction of the weld, welding defects and component notches, and other factors. The current engineering research on the welded structure hot spot stress to determine the main three ways of experimental testing, finite element simulation, and stress regarding element way. According to the IIW measure of hot spot stress way, there are usually two types of hot spots at the weld toe, which are hot spots situated in the two dimensions of the plate surface and hot spots located in the plane of the plate gauge. The first stress is distributed perpendicular to the weld and the stress distribution is related to the plate thickness, while the second is distributed perpendicular to the weld but the stress distribution is not related to the plate gauge, and the problem in the fillet weld of 6061-T6 aluminum alloy for experimental analysis belongs to the first type. The hot spot type is schematically displayed in Fig. 4.
Fig. 4Schematic diagram of hotspot types
There are different surface extrapolation ways according to different fatigue design codes [20]. The two-point linear extrapolation way for fine networks is shown in Eq. (8):
The two-point linear extrapolation of the rough grid is shown in Eq. (9):
The three-point quadratic extrapolation method is a method of determining hot spot stress through quadratic polynomial fitting based on local stress information of welded structures. The three-point quadratic extrapolation way is shown in Eq. (10):
Eq. (8) to Eq. (10), indicates the hot spot stress, and all other variables are stresses at each extrapolation point. At present, there are three main methods for determining the hot spot stress of welded structures in engineering research: experimental testing, finite element simulation, and the stress concentration coefficient method. According to different fatigue design specifications, there are three extrapolation methods: the two-point linear extrapolation method for fine networks (Eq. (8)), the two-point linear extrapolation method for rough grids (Eq. (9)), and the three-point quadratic extrapolation method (Eq. (10)). The basic idea of these methods is to obtain the hot spot stress of welded structures through fitting methods based on the determination of local stress information. The notch effect is the phenomenon of stress concentration formed in the welded joint part due to the special geometric configuration, notch stress is the crest value local nonlinear stress in the stress centralized zone of the weld toe and root, so the notch stress way assesses the fatigue resistance of the welded structure repose the notch partial stress and strain as parameters. When the plate thickness of structural steel and aluminum alloy welded structures is greater than 5 mm, the fictitious root radius at both the weld root and toe is set as 1 mm, and when the plate gauge is under 5 mm, the fictitious root radius is reduced by 0.05 mm in order to reduce the impact on the structure itself. each of these three ways has its own superiority and deficiency in terms of the scope of use, modeling efficiency, and computational accuracy in analyzing and assessing the fatigue life of welded structures. The nominal stress way modeling process is simple and easy to apply, does not require consideration of specific weld details, but it is only applicable to simple structures, does not take into account the impact of welding defects such as mixture and crazings, and cannot calculate the stress state at the root of the weld. The hot spot stress way considers the influence of the specific shape and size of the weld on the stress response, and the calculation results are more accurate, but it is very sensitive to the grid and can only evaluate the fatigue failure at the weld toe. The notch stress way includes the influence of all stress concentration factors including the local notch and has the highest calculation accuracy, but its modeling and analysis process is relatively complex and cannot directly test the notch stress by experiment. The main difference between the hot spot stress method and the nominal stress method lies in the stress calculation method considered and the corresponding welding details. The nominal stress method only considers the average stress of the cross-section and does not pay attention to the local details of the welded joint, so it is suitable for the fatigue assessment of simple structures. In contrast, the hot spot stress law considers the stress concentration effect caused by the shape and size of welded joints, resulting in more accurate calculation results. However, it is greatly affected by the sensitivity of the grid and can only evaluate the fatigue failure at the weld toe. In short, the nominal stress method is applicable to the evaluation of simple structures, neglecting the influence of local details of welded joints on fatigue evaluation, while the hot spot stress law more comprehensively and accurately evaluates the fatigue performance of structural welded joints.
Fatigue resistance is the size of the corresponding alternating stress under a definite quantity of loop, due to the complex structure of welded joints, fatigue resistance is influenced by a variety of factors, including stress concentration, welding defects, welding residual stress, plate thickness and load form [21-22]. Among them, stress concentration affects the fatigue resistance of the most important factors, fatigue resistance with a rise in the degree of stress concentration and a decline [15, 23]. As the welded joint contains welding defects and abrupt changes in the shape of the structural cross-section, resulting in these locations are prone to stress concentrations, which sprout fatigue cracks leading to the generation of fatigue damage. The existence of welding defects in welded joints is ineluctable seeing the restrictions of the welding technology. Common welding defects include initial cracking, porosity, galling, slagging, lack of weld penetration, and non-fusion. Fatigue strength is usually affected by welding defects, mainly because welding defects can lead to a variety in the lateral section of the joint, therefore declining the significant bearing area of the welded joint, and welding residual height and misalignment will also greatly reduce the fatigue resistance. Welding internal stresses is essentially the stress distribution inside the structure due to thermal expansion and contraction of the material vicinity of the weld, and the internal stresses will gradually decrease as the stress is redistributed or plastically deformed inside the member under continuous alternating load. The rise in the gauge of the welded structure plate usually causes a decrease in the fatigue life of the welded joint, due to the thickness of the welded part has a greater impact on the stress localization at the weld toe, the number of initial cracks contained in the thick plate is necessarily greater than the thin plate, the crack stress state is also more complex. Most of the fatigue resistance evaluation of welded structures specification provides the plate thickness correction way, the formula for plate thickness correction commonly used in engineering is mainly BS7608 standard and IIW standard, both standards are only applicable in two ways. BS standard plate thickness correction formula is shown in Eq. (11):
where, indicates the fatigue strength after plate thickness correction, indicates the fatigue strength at the base thickness, indicates the actual plate thickness, and indicates the base thickness. The formula for plate thickness correction in the IIW standard is shown in Eq. (12):
where, = 25 mm for the base thickness, for the actual plate thickness, and for the plate thickness correction factor. In addition to the fatigue resistance, the form of the load also has a significant impact on it. It has been pointed out that the fatigue strength of welded joints with the form of the load trend as shown in Eq. (13):
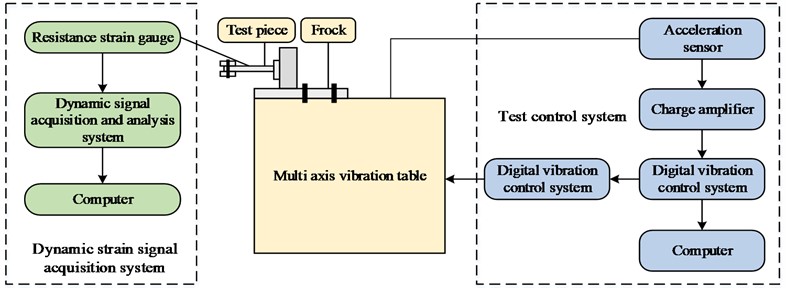
where, means the load form is bending, means the load form is tensile, means the load form is torsion. As one of the main load-bearing welds, the fatigue life of the fillet weld has a great effect on the safety of the vehicle. The excitation frequency is a significant parameter to describe vibration fatigue, and the degree of influence of resonance and non-resonance frequencies on the fatigue resistance of the framework needs to be studied. The vibration test control system is designed based on the acceleration feedback channel with closed-loop control, which collects the vibration acceleration signal of the shaker in real-time and feeds the signal back to the control system, and makes the acceleration of the shaker stable around the target acceleration by comparing the excitation acceleration with the target acceleration and outputting the control signal in real-time. The working tenet of the test system is demonstrated in Fig. 5.
The test raw strain signal usually cannot be used directly for analysis and calculation, and it is necessary to obtain a more reliable strain time course signal through zero-drift processing, deburring, and filtering, and then obtain the stress time course of the measurement point through the stress-strain relationship, as shown in Eq. (14):
where, represents the time course of the stress obtained by conversion, represents the microstrain time domain signal at the measurement point, and represents the modulus of elasticity of 6061-T6 aluminum alloy, = 70,000 mPa.
Fig. 5Working principle of the test system
4. Aluminum alloy fillet weld vibration frequency-fatigue strength simulation experimental analysis
The study was carried out in the vibration frequency-fatigue strength simulation analysis of welds by first deriving fatigue life data from vibration fatigue tests, followed by fitting the P-S-N curve considering the survival rate using the power function S-N model, and finally analyzing the endurance life of the simulated assembly using the nominal stress way. The study first conducted vibration fatigue tests using a multi-axis vibration test bench and a dynamic signal analyzer to obtain fatigue life data of welds under different vibration frequencies. Then the Power function S-N model was used to fit the P-S-N curve considering the survival rate to reveal the change rule of fatigue strength under different vibration frequencies. Finally, the nominal stress method was used to analyze the fatigue life of simulated components to explore the effects of resonance frequency and non-resonance frequency on fatigue strength. The simulation diagram is shown in Fig. 6.
Fig. 6The simulation diagram
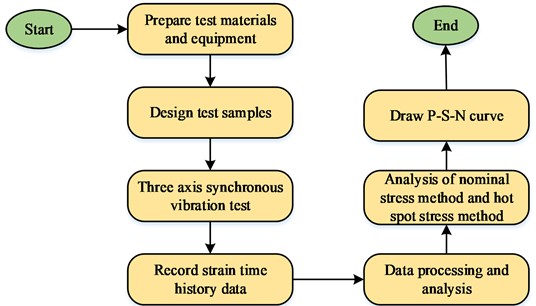
The multi-axis vibration test rig was used to record the strain time history data output by the Strain gauge, and further obtain the stress and fatigue life information through data processing and analysis. Then, the nominal stress method and hot spot stress method were used for analysis to draw the nominal stress P-S-N curves at different frequencies. The study utilizes a multi-axial vibration test rig, and design specimens to test and analyze the effect of vibration frequency on the fatigue resistance of 6061-T6 fillet welds. The instruments used in the study to conduct the tests were mainly the multi-axis synchronous vibration test rig, dynamic signal acquisition analyzer and vibration test control system, and the main data of the test instruments is displayed in Table 1.
Table 1Test instrument data
Serial No. | Name | Model |
1 | Multi axis synchronous vibration test bench | 3es-40-370-vt0505 |
2 | Dynamic signal analyzer | DH5983 |
3 | Signal acquisition and analysis system | DHDAS |
4 | Strain gauge | BE120-3AA |
5 | Acceleration sensor | 1A315E |
6 | Computer | HP |
Fig. 7Vibration frequency acceleration extrapolation stress time domain signal
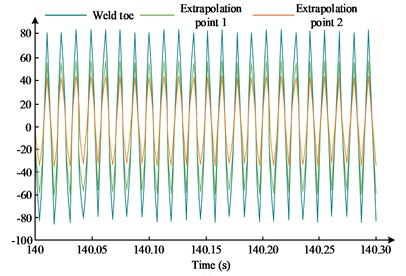
a) Nominal stress method when 77.5 Hz, 10 g
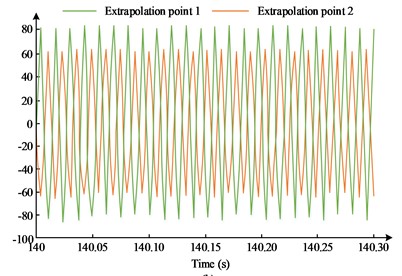
b) Hot spot stress method when 77.5 Hz, 10 g
The triaxial synchronous vibration test stand can meet the needs of multi-axis and single-axis vibration tests. The study uses triaxial synchronous vibration in the sweep test, taking into account the modal response due to excitation in each direction, and the vibration fatigue test uses the vertical single-axis vibration mode. The dynamic signal acquisition and analysis system records the strain-time history of the strain gauge test, and the recorded data will be used for later analysis of strain, stress, and life data. The study reposed the nominal stress and the hot spot stress way, and the vibration frequency-acceleration extrapolated stress time domain signal is obtained by the vibration fatigue test, as shown in Fig. 7.
From Fig. 7, under the nominal stress way, extrapolation point 1, extrapolation point 2, and weld toe all show relatively consistent time-domain fluctuation conditions as time progresses, but the stress extrapolation point has a relatively larger range of stress variation compared to the weld toe, showing a trend of triple homodyne wave-like variation at the resonant frequency. In contrast, the stress response at the extrapolation point under the hot spot stress way was so great that it exceeded the range of the foil gauges, resulting in the failure of the foil gauge, and therefore the hot spot stress could not be acquired, so this study was mainly reposed the nominal stress way. The research took a double logarithmic coordinate system to fit the nominal stress-life linear data when performing the fatigue data P-S-N curve fitting. The nominal stress P-S-N curves at different frequencies are shown in Fig. 8.
Fig. 8P-S-N curve of nominal stress at different frequencies
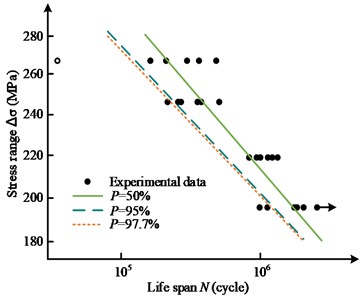
a) Vibration frequencies 57.5 Hz
b) Vibration frequencies 67.5 Hz
c) Vibration frequencies 77.5 Hz
The member specimen symbols with arrows in Fig. 8 represent the unbroken member specimens, while the hollow member specimen symbols represent the member specimens with fractures at the weld toe. At the vibration frequencies of 57.5 Hz, 67.5 Hz, and 77.5 Hz, the stress change curves of 50 %, 95 % and 97.7 % of the survival rate showed a decreasing trend with the rise of the endurance life, in which the curve of 50 % survival rate was generally closer to the back end of the fatigue life interval, while the curves of 95 % and 97.7 % of the survival rate were decreasing in magnitude and location. The curves for 95 % and 97.7 % of the survival rate were closer to the end of the fatigue life interval. There was one specimen with a fracture at the toe of the component at 57.5 Hz, no specimen with a fracture at the toe of the component at 67.5 Hz, and one specimen with a fracture at the toe of the component at 77.5 Hz, and there was one specimen with fracture at the toe of the component at 57.5 Hz, 67.5 Hz, and 77.5 Hz. There was one specimen that was not fractured at 57.5 Hz, 67.5 Hz, and 77.5 Hz. From the curve fitting condition, the fatigue resistance of the curve was relatively large, reflecting the trend that the more the vibration rate, the greater the extent of fatigue life variation. The study also simulated the S-N curves for various stress states, as shown in Fig. 9.
Fig. 9 shows the comparison of S-N curves under different stress amplitude ranges. It can be seen that the position of the bending stress diagram is higher than the position of the tensile and compressive stress. Under different earnings ranges, the fitting status of the overall dispersed sample shows the same trend. This indicates that the bending fatigue strength is relatively high. From Fig. 9 that the curve position of the symmetric bending fatigue curve is higher than that of the symmetric bending fatigue curve, and the fit condition of the overall scattered sample shows the same trend under different profitability ranges. It can be seen that under the two different stress loading of bending and tensile compression, the magnitude of material stress change under stress bending loading is greater, but the magnitude of bending fatigue change is relatively smaller. The frequency effect of the P-S-N curve for aluminum fillet welds is shown in Fig. 10. The sample table is shown in Table 2.
Fig. 9S-N curve under different stress states
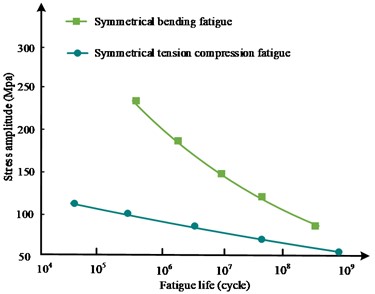
a) S-N curves under slight stress loads
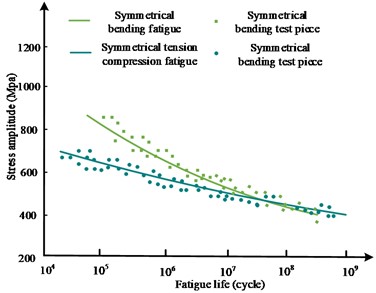
b) S-N curves under severe stress loads
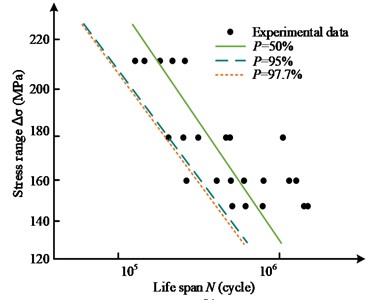
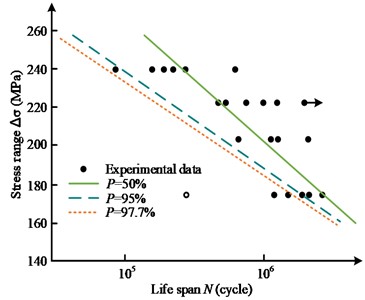
Fig. 10Frequency effect of P-S-N curve of aluminum alloy fillet weld
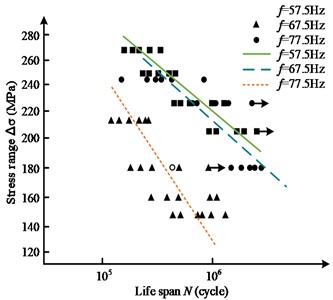
a) Survival rate 50 %
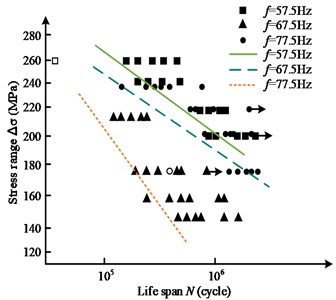
b) Survival rate 95 %
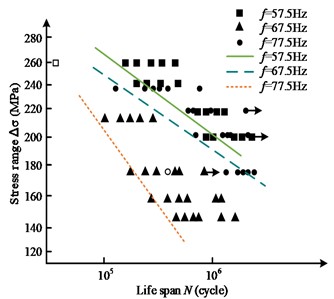
c) Survival rate 97.7 %
Flutter frequency refers to the variation of modal response in various directions caused by excitation. The study used a three-axis synchronous excitation sweep test in this study to test the flutter frequencies of 57.5 Hz, 67.5 Hz, and 77.5 Hz, respectively. Based on experimental results and combined with the nominal stress method, hot spot stress method, and P-S-N curve analysis, the effect of different types of flutter frequencies on the fatigue strength of aluminum alloy fillet welds was studied. From Fig. 10 that the flutter frequency 57.5 Hz, 67.5 Hz, and 77.5 Hz curves showed a decreasing trend with the decrease of fatigue life under the survival rate of 50 %, 95 %, and 97.7 %, among which the fatigue life curves of vibration frequency and 67.5 Hz curves were relatively forward, while the vibration frequency 57.5 Hz and 77.5 Hz curves were closer. Among the specimens with a 50 % survival rate, there were two specimens with fractures at the weld toe, which are 57.5 Hz and 77.5 Hz separately; among the specimens with a 95 % survival rate, there were two specimens with fractures at the weld toe, which were 57.5 Hz and 77.5 Hz separately; among the specimens with 95% survival rate, there were also two specimens with fracture at the weld toe, which were 57.5 Hz and 77.5 Hz separately; among the specimens with 95 % survival rate, there were two specimens with fracture at the weld toe. The specimens with fractures at two weld toes also existed in the specimens with 95% survival rate, respectively at 57.5 Hz and 77.5 Hz. At the same time, there were three specimens with no fracture at 50 %, 95 %, and 97.7 % survival rate, one specimen each at 57.5 Hz, 67.5 Hz and 77.5 Hz vibration frequency. It can be seen that the effect of resonant and non-resonant frequencies on the nominal stress P-S-N curves at the same survival rate was greater, and the absolute value of the slope of the curve at the resonant frequency was significantly greater than that of the non-resonant frequency curve, which represented a smaller change in fatigue life formed at the resonant frequency for the same stress change. It can also be seen that the resonant PSN curve generally lies below the non-resonant P-S-N curve, which represented a relatively lower fatigue life for the resonant state at the same stress level. It can be seen that under the same survival rate, there is a significant difference between the resonance frequency curve and the non-resonance frequency curve. This may be due to the complex stress waveform in the resonant state, which led to more uneven stress distribution and damage accumulation inside the material, thereby reducing fatigue life. In addition, the peak and valley values of stress waves in the resonance state were higher, which may cause more internal defects and lead to weld fatigue. Based on the results of this study, the design and use of 6061-T6 aluminum alloy welding components in vibration environments can be predicted for various vibration frequencies and safety assessments can be carried out accordingly. Especially near the resonance frequency, special attention should be paid to the fatigue strength and life changes of components. In practical engineering applications, certain measures can be taken to reduce stress concentration at resonance frequencies and prevent premature weld fracture and structural failure.
Table 2The sample table
Sample | State | Frequency |
Sample 1 | Not broken | 57.5 Hz |
Sample 2 | Component toe fracture | 57.5 Hz |
Sample 3 | Not broken | 67.5 Hz |
Sample 4 | No fracture at the toe of the component | 67.5 Hz |
Sample 5 | Not broken | 77.5 Hz |
Sample 6 | Component toe fracture | 77.5 Hz |
5. Conclusions
To explore the correlation between the vibration frequency and fatigue strength of fillet welds in the process of aluminum alloy fillet welding, the nominal stress analysis method and hot spot stress analysis method are used to analyze the relationship between the vibration frequency and fatigue resistance of fillet welds and a vibration test control system is designed for simulation experiments. Under the nominal stress analysis method, an equation for the P-S-N fitting curve is obtained, which has been verified through simulation experiments and can better describe the relationship between vibration frequency and fatigue strength. The data indicates that the stress repercussion at the extrapolation point of the hot spot stress analysis method is so significant that it exceeds the range of the strain gauge, making it impossible to obtain accurate measurements. On the other hand, the fatigue resistance of the P-S-N fitted curve is relatively high under the nominal stress analysis method, indicating that the extent of fatigue life variation increases with higher vibration frequencies. Additionally, the magnitude of material stress variation is greater under bending stress loading than under tensile stress loading, and the magnitude of bending fatigue variation is smaller. Furthermore, three specimens remained unbroken under survival rates of 50 %, 95 %, and 97.7 %, while two fractured specimens were found at the toe of the weld. The endurance life of the resonance frequency under the same survival rate stress condition is smaller, and the fatigue life of the resonance condition is relatively lower. By analyzing the relationship between the vibration frequency and fatigue strength of fillet welds, a theoretical foundation can be laid for the safety development of aluminum alloy components. This research can also provide guidance for the structural design of aluminum alloy components in practical applications. The research provides significant contributions and innovations in the study of 6061-T6 aluminum alloy fillet welds. For the first time, it systematically analyzes the fatigue strength characteristics and their interrelationships under different vibration frequencies, revealing the fatigue laws of fillet welds under various vibration stresses. In addition, it introduces the nominal stress analysis method and hot spot stress analysis method and designs a vibration test control system to verify and analyze the relationship between vibration frequency and fatigue strength through simulation experiments. The experimental results show that the fatigue life at resonance frequency is relatively low, providing important guidance for the structural design and safety assessment of aluminum alloy components in practical applications. Overall, this research offers valuable insights into the fatigue behavior of aluminum alloy fillet welds and provides a foundation for the development of safer and more reliable structures.
References
-
J. Gao, Y. Hong, B. Hong, X. Li, A. Jia, and Y. Qu, “A method of feature extraction of position detection and weld gap for GMAW seam tracking system of fillet weld with variable gaps,” IEEE Sensors Journal, Vol. 21, No. 20, pp. 23537–23550, Oct. 2021, https://doi.org/10.1109/jsen.2021.3106696
-
T. Wang, Z. Wang, Y. Cao, Y. Wang, and S. Hu, “A multi-BRIEF-descriptor stereo matching algorithm for binocular visual sensing of fillet welds with indistinct features,” Journal of Manufacturing Processes, Vol. 66, No. 66, pp. 636–650, Jun. 2021, https://doi.org/10.1016/j.jmapro.2021.04.031
-
S. P. Parida, P. C. Jena, and R. R. Dash, “Dynamics of rectangular laminated composite plates with selective layer-wise fillering rested on elastic foundation using higher-order layer-wise theory,” Journal of Vibration and Control, p. 107754632211383, Nov. 2022, https://doi.org/10.1177/10775463221138353
-
S. Mahapatra, A. Das, P. C. Jena, and S. R. Das, “Turning of hardened AISI H13 steel with recently developed S3P-AlTiSiN coated carbide tool using MWCNT mixed nanofluid under minimum quantity lubrication,” Proceedings of the Institution of Mechanical Engineers, Part C: Journal of Mechanical Engineering Science, Vol. 237, No. 4, pp. 843–864, Feb. 2023, https://doi.org/10.1177/09544062221126357
-
S. P. Parida and P. C. Jena, “Free and forced vibration analysis of flyash/graphene filled laminated composite plates using higher order shear deformation theory,” Proceedings of the Institution of Mechanical Engineers, Part C: Journal of Mechanical Engineering Science, Vol. 236, No. 9, pp. 4648–4659, May 2022, https://doi.org/10.1177/09544062211053181
-
U. Zerbst, M. Madia, C. Klinger, D. Bettge, and Y. Murakami, “Defects as a root cause of fatigue failure of metallic components. ii: Non-metallic inclusions,” Engineering Failure Analysis, Vol. 98, No. 98, pp. 228–239, Apr. 2019, https://doi.org/10.1016/j.engfailanal.2019.01.054
-
S. Pradhan, S. R. Das, P. C. Jena, and D. Dhupal, “Investigations on surface integrity in hard turning of functionally graded specimen under Nano fluid assisted minimum quantity lubrication,” Advances in Materials and Processing Technologies, Vol. 8, No. sup3, pp. 1714–1729, Oct. 2022, https://doi.org/10.1080/2374068x.2021.1948706
-
M. Braun, R. Scheffer, W. Fricke, and S. Ehlers, “Fatigue strength of fillet‐welded joints at subzero temperatures,” Fatigue and Fracture of Engineering Materials and Structures, Vol. 43, No. 2, pp. 403–416, Feb. 2020, https://doi.org/10.1111/ffe.13163
-
I. Bunaziv, C. Dørum, X. Ren, M. Eriksson, and O. M. Akselsen, “Application of LBW and LAHW for fillet welds of 12 and 15 mm structural steel,” Procedia Manufacturing, Vol. 36, No. 36, pp. 121–130, 2019, https://doi.org/10.1016/j.promfg.2019.08.017
-
L. Yang, Y. Cui, X. Wei, M. Li, and Y. Zhang, “Strength of duplex stainless steel fillet welded connections,” Journal of Constructional Steel Research, Vol. 152, pp. 246–260, Jan. 2019, https://doi.org/10.1016/j.jcsr.2018.08.031
-
Z. Mikulski and T. Lassen, “Fatigue crack initiation and subsequent crack growth in fillet welded steel joints,” International Journal of Fatigue, Vol. 120, pp. 303–318, Mar. 2019, https://doi.org/10.1016/j.ijfatigue.2018.11.014
-
J. Schubnell et al., “Residual stress relaxation in HFMI-treated fillet welds after single overload peaks,” Welding in the World, Vol. 64, No. 6, pp. 1107–1117, Jun. 2020, https://doi.org/10.1007/s40194-020-00902-6
-
G. Xu et al., “Numerical and experimental investigation on weld formation during laser+MIG hybrid fillet welding of aluminum alloy in horizontal position,” The International Journal of Advanced Manufacturing Technology, Vol. 102, No. 5-8, pp. 2683–2694, Jun. 2019, https://doi.org/10.1007/s00170-019-03372-3
-
L. Tian and Y. Luo, “A study on the prediction of inherent deformation in fillet-welded joint using support vector machine and genetic optimization algorithm,” Journal of Intelligent Manufacturing, Vol. 31, No. 3, pp. 575–596, Mar. 2020, https://doi.org/10.1007/s10845-019-01469-w
-
S.-P. Zhu, Y. Ai, D. Liao, J. A. F. O. Correia, A. M. P. De Jesus, and Q. Wang, “Recent advances on size effect in metal fatigue under defects: a review,” International Journal of Fracture, Vol. 234, No. 1-2, pp. 21–43, Apr. 2022, https://doi.org/10.1007/s10704-021-00526-x
-
G. Meneghetti, D. Rigon, and C. Gennari, “An analysis of defects influence on axial fatigue strength of maraging steel specimens produced by additive manufacturing,” International Journal of Fatigue, Vol. 118, pp. 54–64, Jan. 2019, https://doi.org/10.1016/j.ijfatigue.2018.08.034
-
A. Shahzad, “Investigation into fatigue strength of natural/synthetic fiber-based composite materials,” Mechanical and Physical Testing of Biocomposites, Fibre-Reinforced Composites and Hybrid Composites, pp. 215–239, 2019, https://doi.org/10.1016/b978-0-08-102292-4.00012-6
-
M. Nakatani, H. Masuo, Y. Tanaka, and Y. Murakami, “Effect of surface roughness on fatigue strength of Ti-6Al-4V alloy manufactured by additive manufacturing,” Procedia Structural Integrity, Vol. 19, No. 19, pp. 294–301, 2019, https://doi.org/10.1016/j.prostr.2019.12.032
-
J. Baumgartner, H. C. Yıldırım, and Z. Barsoum, “Fatigue strength assessment of TIG-dressed welded steel joints by local approaches,” International Journal of Fatigue, Vol. 126, pp. 72–78, Sep. 2019, https://doi.org/10.1016/j.ijfatigue.2019.04.038
-
S. Imran, X. Liu, and D. Morris, “Depth completion with twin surface extrapolation at occlusion boundaries,” in IEEE/CVF Conference on Computer Vision and Pattern Recognition, pp. 2583–2592, 2021, https://doi.org/10.48550/arxiv.2104.02253
-
Z. Zhao et al., “A data‐driven analysis for fatigue failure mode identification in load‐carrying fillet welded joint with mechanical data augmentation,” Fatigue and Fracture of Engineering Materials and Structures, Vol. 45, No. 11, pp. 3418–3435, Nov. 2022, https://doi.org/10.1111/ffe.13811
-
D. Liao, S.P. Zhu, J. A. F. O. Correia, A. M. P. de Jesus, and F. Berto, “Recent advances on notch effects in metal fatigue: a review,” Fatigue and Fracture of Engineering Materials and Structures, Vol. 43, No. 4, pp. 637–659, Apr. 2020, https://doi.org/10.1111/ffe.13195
-
R. Ghafoori-Ahangar and Y. Verreman, “Fatigue behavior of load-carrying cruciform joints with partial penetration fillet welds under three-point bending,” Engineering Fracture Mechanics, Vol. 215, pp. 211–223, Jun. 2019, https://doi.org/10.1016/j.engfracmech.2019.05.015
Cited by
About this article

This study was supported by the Special research fund for academicians of China Communications Group (YSZX-03-2020-01-B, YSZX-03-2021-02-B).
The datasets generated during and/or analyzed during the current study are available from the corresponding author on reasonable request.
Jingyu Lu: conceptualization, funding acquisition. Tingqi Qiu: methodology, project administration, supervision, writing–review and editing. Zhanli Chen: project administration, supervision, writing–review and editing. Wanze Zhang: data curation, investigation, validation, writing-original draft preparation. Chuanzhi Du: formal analysis, investigation, resources, visualization, writing – original draft preparation. Minglong Wu: data curation, investigation, methodology, resources, validation, visualization, writing – original draft preparation.
The authors declare that they have no conflict of interest.
