Abstract
The major structure for transmitting forces in a cable-stayed bridge is the stay cable. If the stay cable system fails, the whole bridge will collapse. At present, there is no very mature technical means for the detection of bridge cables. The most common method is for workers to perform regular manual inspection and replacement of cables. Although the defect condition of the cable can be detected to a certain extent, the real-time monitoring of its health cannot be realized. Therefore, the research used the median filter, mean standardization method and Retinex algorithm to preprocess the image data. And after extracting the stay cable picture’s macroscopic characteristics using the Gabor wavelet transform, it implemented image segmentation using the OTSU approach. The obtained feature images were applied to the Faster Regional Convolution Neural Network (RCNN) recognition model to detect microscopic defects. During the research, the training efficiency of traditional Convolution Neural Network (CNN) was not high. Therefore, Faster RCNN built a cable defect recognition model. Based on this, the research built an intelligent detection model for apparent defects of stay cables based on Gabor wavelet transform and improved RCNN. Through the experimental analysis, the model built for the study has a recognition accuracy rate of 94.14 %, which can achieve dynamic bridge health monitoring and instantly identify the condition of the stay cables, and maintain the safety of the bridge.
1. Introduction
Today, a variety of engineering constructions, including suspension bridges, tower-mast structures, and cable-stayed bridges, often use stayed cables. One popular kind of extra-large river and sea crossing bridges among them is the cable-stayed bridge. The stayed cables as the main load-bearing structure provide elastic support for the main girder, and send the main girder’s active and dead load to the cable tower, so that the main girder has great spanning capacity and are the “lifeline” of cable-stayed bridges [1]. The stay cables are in a state of high stress for a long time, coupled with environmental erosion, so it is easy to cause fatigue damage. To keep the bridge in good condition, the identification of bridge cables now mostly depends on human examination and replacement on a regular basis [2]. Since the 1950s, people began to realize the importance of bridge health detection, but due to technical limitations, it has not been promoted. With the development of science and technology, the detection technology has gradually developed and matured, but the real-time monitoring applied to cable-stayed bridges is not good enough [3]. At present, the methods used in real-time monitoring of cables of cable-stayed bridges mainly include the cable force monitoring method based on pressure and electromagnetic sensors, vibration frequency, optical sensors and acoustic emission [4]. Gabor wavelet transform is a method for feature extraction of image texture, which can well take into account the resolution requirements of signal analysis in both time and frequency domain [5]. The study classifies surface defects of stayed cables from both macro and micro perspectives, utilizes Gabor wavelet transform to extract features from cable-stayed images, and applies the extracted feature images to the RCNN recognition model. During the research, the traditional RCNN generated many weight parameters, which led to low training efficiency. Therefore, an intelligent detection model for apparent defects in stayed cables based on Gabor wavelet transform and improved RCNN was studied and constructed, achieving real-time detection of stayed cable damage from multiple angles.
2. Related works
The real-time monitoring of the safety status of the stayed cable structure of the bridge is an essential work to ensure the normal operation of the bridge. At present, scholars have also conducted many related studies on the health status detection of stayed cables. To compute the cable damage data for the Greek Bridge, Son et al. separated anomalies as erroneous data from anomalies linked to the status of structures or sensor devices using a long-short-term memory network (LSTM)-based architecture. Adding up the resulting anomaly score is utilized to determine and pinpoint the stay cable’s anomalous state [6]. The research proposed a state-driven acoustic emission and CNN’s stay cable defect detection method combined with wavelet analysis and transfer deep learning, by training CNN to recognize on-site monitoring signals and evaluate the current status of cables during bridge operation to realize the adequate maintenance of long-span bridges [7]. Li et al. built a large-span visual inspection system for cable surface damage detection of cable-stayed bridge using a climbing robot, an image processing platform, and four fixed cameras to gather images of stay cables. They then used the Scale Invariant Feature Transform (SIFT) algorithm to identify defects [8]. Chu et al. suggested a non-contact vision-based cable tension detection system after detecting using feature-based video image processing [9]. Daneshvar et al. aiming at problems such as low computational efficiency caused by the application of large amounts of data in structural health monitoring, a new damage detection method for stay cables was constructed by using the combined model of AR and ARX [10].
Gabor wavelet transform is an important tool for signal analysis and processing in the time-frequency domain, which can extract image texture features independent of color and brightness. There are also many studies on its application fields. Muthukrishnan et al proposed a method combining discrete wavelet transform (DWT) and Gabor technology to solve the problem When processing pictures. The DWT difference approach is vulnerable to unwanted vibration and edge data loss [11]. Zhang et al. suggested a facial expression identification approach employing local binary pattern (LBP) description and applying 2D-Gabor wavelet transform to categorize human face javelins to address the issue that the facial image pattern is altered by illumination, motions, light, etc. [12]. The input picture was transformed into the transform domain by Kumar et al. using the enhanced Gabor wavelet transform, followed by the relative fruit fly algorithm to extract pertinent features and the support vector machine to categorize and identify the image. The model for processing medical images [13]. Zhang et al. suggested a time-frequency analysis approach based on continuous wavelet transform and multi-Q factor Gabor wavelet transform to correctly extract the defect diagnostic information of rolling bearings in rotating equipment [14]. Wicaksono et al. used Gabor wavelet transform and K - Nearest Neighbor to identify human body height and weight based on footprint images, and proposed a new forensic method for inferring human body parameters [15].
RCNN can achieve high-precision target detection in image and is widely used in image processing and other fields. Bharati et al. investigated the application and recent improvements of RCNN, and compared the performance and challenges of these technologies in speed accuracy or simplicity. Yolo’s speed performance was about 21~155fps [16]. Albahli et al. obtained regions of interest by developing annotations, then adopted the improved Faster RCNN and introduced DenseNet-41 to calculate depth features. Finally, regression and classification layers were used to locate and classify numbers into ten categories, and an efficient handwritten digit recognition system was proposed [17]. Based on the improved Faster RCNN algorithm, Jiang et al. carried out joint target detection of multi-task semantic segmentation model in a complex indoor environment using RGB-D image information, while achieving semantic segmentation of indoor scenes, target classification and multi-vision task detection [18]. Using a multi-optimization training system, Vania et al. proposed a new method of deep learning segmentation network for medical image diagnosis by using random gradient descent and adaptive data estimation (Adam) with T1 and T2 in the multi-level optimization mask RCNN [19]. Hu et al. built a new network based on Fast RCNN, using ResNet50 with feature pyramid network as the backbone of feature extraction to better detect small defects on printed circuit boards [20].
The information above demonstrates that in studies on the identification of damage to bridge stay cables, there are many related technical methods, all of which are not the same. However, comparing the surface defect detection of cables at different scales did not achieve a more accurate and ideal detection and recognition. To this end, research has been conducted on multi-scale detection of cable-stayed images from both macro and micro perspectives. Firstly, Gabor wavelet transform was used to perform feature detection on cable-stayed images and extract defect feature images. Then, it was applied to the Faster RCNN recognition model. Therefore, the intelligent detection of the apparent defect of the stay cable based on the Gabor wavelet transform and Faster RCNN was researched and constructed. The model realized the dynamic monitoring of bridge health, maintained the cable components in time, and ensured the safety of the bridge.
3. Construction of stay cable detection model based on Gabor and R-CNN
3.1. Image acquisition and preprocessing
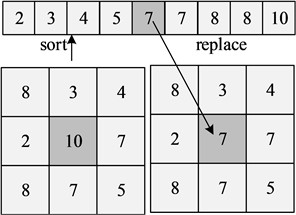
Cable-stayed bridges mainly exist in special high-altitude environments, and the defect detection of its component requires real-time detection by cameras. To this end, the study uses a four-view CCD camera to collect the apparent image data of the outer polyethylene layer of the stay cable. However, since the strong light during the day will form strong reflections and shadows on the image, which will affect the detection effect, a hood is installed next to the camera. The study encodes the time information of acquired images into timing information and expresses it in binary form, and evaluates the timing information of cameras with Hamming distance to ensure camera synchronization. After getting the picture information and timing information, it was sent to the server and feedback high-resolution optical images. It needs to ensure the real-time collection and transmission of optical images, so that employees may quickly identify any problems with cable-stayed bridges and promptly fix them. There might be a lot of noise spots during the picture capture procedure. The study denoises the faulty picture using median filtering to guarantee the precision of future detection and identification. The following expression displays the calculation Eq. (1):
where, it is the neighborhood of the image, which is the center of the image. The replacing of the middle pixel value with the median pixel value involves numerically ordering all of the pixel values in the surrounding sphere. Fig. 1 illustrates the median filtering concept.
Fig. 1Schematic diagram of median filtering
The study uses the method of mean normalization to normalize the image pixel values. The following Eq. (2) shows how to remove the mean value for each pixel:
where, represents the mean of the image. represents the standard deviation of the image. and represent the width and height of the image, respectively, and represents the pixel values corresponding to positions. . The data enhancement operation on the defect image dataset is investigated to avoid the overfitting phenomena brought on by too few samples or inadequate sample variety and increase the generalization capacity of the model. Firstly, the bicubic interpolation method is used to randomly set an angle value to rotate the image, and the Eq. (3) is as follows:
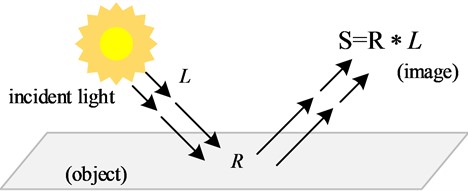
Eq. (3), the neighborhood is taken as 3×3. It rotates the image by Eq. (3) to obtain a new image. Similarly, data augmentation is realized by using stagger transformation and mirror flip. Although a hood is used in the apparent image acquisition of the stay cable, the collected image information is still inevitably affected by it, and the reflective part may be misidentified as a defect. Therefore, to reduce the impact of light on the picture, the study uses the Retinex algorithm. In Fig. 2, the Retinex theory’s schematic design is shown.
Fig. 2Schematic diagram of retinex theory
Single-scale Retinex (SSR), multi-scale Retinex (MSR), and multi-scale Retinex with color restoration (MSRCR) are examples of frequently used Retinex algorithms. The MSRCR technique is mostly used to maintain the original color characteristics and identify the grayscale picture since SSR is significantly impacted by a single scale and is not amenable to correction. The lighting and fogged picture issues are therefore resolved using the MSR technique. The kernel function adopts Gaussian function, and the function is as follows Eq. (4):
where, represents the scale value. The single-scale function is shown in Eq. (5):
where, represents the first spectral band’s picture distribution. The following Eq. (6) represents MSR, or the weighted sum of many single scales:
where, represents the number of Gaussian kernels jointly with represents the weight. Based on the above operations, the research realizes the expansion and noise reduction processing of the image data, and uses the Retinex algorithm to remove the light from the image.
3.2. Gabor wavelet transform macro defect detection of stay cables
Finding the cable-stayed protective sleeve is crucial for ensuring the stability, dependability, and proper force transfer of the cable-stayed bridge. The macroscopic characteristics of the stay cables are extracted in the study using the Gabor wavelet technique. Two-dimensional Gabor wavelet transform is an important tool for signal analysis and processing in the time-frequency domain, which can extract image texture features independent of color and brightness. A sinusoidal surface with a certain frequency and direction, modulated by a Gaussian envelope, may be thought of as 2D-Gabor. The following displays the sinusoidal Eq. (7):
where, is the middle bandwidth of the Gabor filter, and is the frequency of the filter. The window function is shown in the following Eq. (8):
Combining Eq. (7) and Eq. (8) can get the Gabor function as Eq. (9):
Fig. 3 depicts the Gabor function’s real and imaginary components.
Fig. 3Schematic diagram of real part and imaginary part of Gabor function
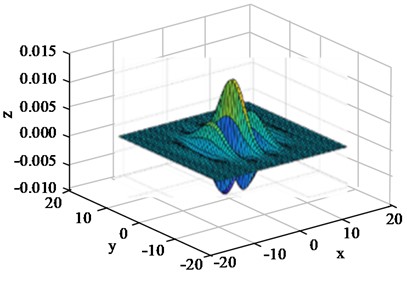
a) Gabor real part
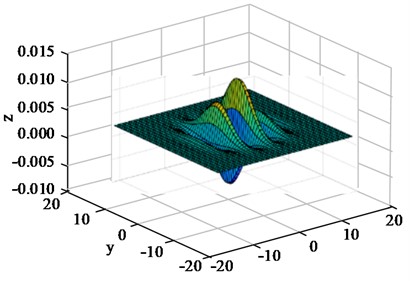
b) Gabor imaginary part
Its frequency response function is shown in the following Eq. (10):
The Eq. (10), the value of the sum is calculated as the following Eq. (11):
The study uses the base wavelet as the wavelet transform of the Gabor function to extract texture features, and uses filters of different scales to detect local features of images at different scales. Using Eq. (9) as the mother wave function, the Gabor wavelet is obtained through moderate scale expansion and rotation transformation, as shown in Eq. (12):
where, is the scale factor and is the number of directions. By changing the values of and , filter banks of different directions and scales are obtained. To acquire the textural properties of the cable-stayed surface, the research chooses Gabor wavelets with 5 scales and 8 orientations. The selected filter is convolved with the surface image of the cable, and the expression is shown in the following Eq. (13):
Filtered image is obtained by Eq. (13). The obtained feature data are high-dimensional features, which need to be dimensionally reduced. The following Eq. (14) displays the function that converts data from high-dimensional space to low-dimensional space:
where, is a random matrix in the dimension following mapping, which is high-dimensional space. The following Eq. (15) displays the mapping function’s accuracy measure:
After realizing the dimension reduction of the extracted features through mapping, the research uses OTSU to segment the image to separate the defect from the image. The traditional maximum inter-class variance method is affected by factors such as small target area, small mean value, large variance and noise between foreground and background pixels, and its performance in threshold segmentation of images is not ideal. Therefore, the study calculates the average gray value of the neighborhood on each pixel, divides the gray level and the average gray level of a given picture into the same score, and obtains a pair of parameter combinations composed of the pixel gray value and the neighborhood average value. All feasible thresholds are iterated, and the propagation rate of the thresholds is calculated. The trace capacity of the matrix is obtained as shown in the following Eq. (16):
where, is the joint probability mass function of the two-dimensional histogram. is the matrix between discrete classes. is the probability of the class. and are the gray mean vector of the two classes. Threshold segmentation is achieved by finding the optimal threshold that maximizes the in Eq. (16).
3.3. Improved RCNN stay cable micro-defect detection
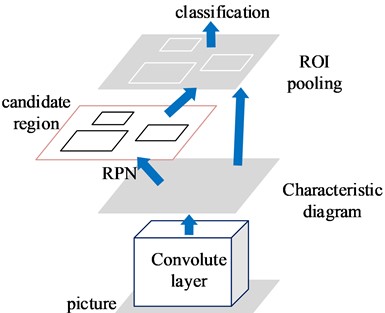
Referring to the classification of stayed cable defects in the inspection industry, the research categorizes defects into three categories: scratches, damage, and damage to the spoiler tube. CNN, also known as feedforward neural network, refers to that the input and output channels transmit signals in one direction without allowing the signals to flow back into the network. In traditional CNN, due to the different lengths, widths, and spatial positions of objects in the image, segmentation is required, resulting in a significant amount of computational power. And region based CNN can effectively reduce region segmentation and select regions. However, due to the need to extract features from all regions, the computational efficiency of RCNN is still not ideal. Therefore, Faster RCNN is selected for the study of identifying micro defects in stayed cables. It introduces an ROI Pooling network layer on the basis of RCNN, extracts a fixed dimensional feature representation for each region, and introduces an RPN candidate box extraction module to improve processing speed while ensuring accuracy. Faster RCNN is mainly composed of five main components: feature extraction foundation network, RPN network, ROI pooling and fully connected network, bounding box regression, and classification. The schematic diagram is shown in Fig. 4.
Fig. 4Structural diagram of faster RCNN
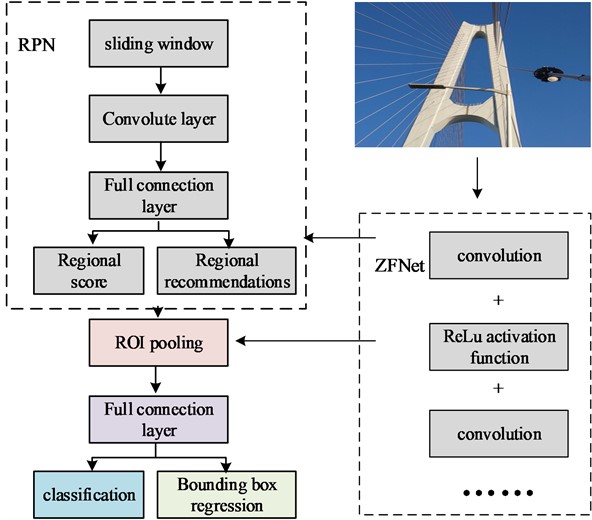
The study chooses ZFNet to extract deep features, and understands and adjusts the convolution network through deconvolution technology to modify the network structure. The convolution layer is used to perform convolution operation on the input data, and the output feature map is shown in Eq. (17):
where, represents the convolution operation. is the feature item. is the network layer’s unique serial number. is the number of feature maps of . is the deviation value of the first layer. is the convolution kernel, and represents the activation function of the convolution layer. The research selects the improved ReLu function as the activation function, and it is shown in the following Eq. (18):
The most pooling possible is adopted, and the maximum value in the area is used as the pooling output to reduce the data dimension and the amount of calculation. The max pooling function is shown in Eq. (19):
where, is the input data’s dimension. is step size, and is the pooling window size. The convolution layer’s output, ReLu, and the maximum pooling are used as the input of deconvolution, and the depooling and deconvolution operations are performed in sequence. The transpose of the same convolution kernel is used as the kernel to perform convolution operations with the input. After feature extraction through ZFNet, the extracted feature map is entered into the RPN network. A sliding window of size 3×3 is taken on the feature map, and 9 anchors of different scales and aspect ratios are generated for each sliding window. Each center point has a suggestion box composed of corresponding anchors, and the generated suggestion box enters the two branches of the classification and the regression network. The classification network judges how much the suggestion box overlaps with the calibration bounding box, and the following Eq. (20) illustrates how to calculate the overlap degree:
According to the degree of overlap, the maximum suppression method is used to remove some anchor regions. Then it adjusts the anchor point through the regression network to better adapt to the predicted object. The Eq. (21) displays the classification loss function:
where, is the th suggestion box; indicates the probability that the suggestion box is a positive sample; the value is 1 when it is a positive sample, and the value is 0 when it is a negative sample. The following Eq. (22) displays the regression loss function:
where, is the four coordinate parameters of the suggestion box, which represent the coordinate parameters of the corresponding calibration bounding box. According to a predetermined ratio, classification and regression loss make up the loss function of training RPN. The following displays the total loss Eq. (23):
where, is the number of suggestion boxes participating in the training. is the number of feature image pixels, and is the balance parameter. After iterations, the size, stride and feature map size of the convolution kernel are constantly changed. Fig. 5 depicts the network architecture of the Faster RCNN based on ZFNet.
Fig. 5The network structure of faster RCNN based on ZFNet
Based on the above content, the Gabor wavelet transform is used to extract and detect the apparent image of the cable-stayed cable. The stayed cable’s flaws are categorized and identified using the enhanced RCNN. The detection model of apparent defect of the stayed cable based on Gabor wavelet transform and RCNN is constructed. It can acquire efficient and accurate detection of cable defects in cable-stayed bridges.
4. Performance analysis of apparent defect detection model for stay cables
Timely detection and maintenance of damage to bridge stay cables is of great significance for scientific management and maintenance of bridges. To this end, a stayed cable surface defect detection model based on Gabor wavelet transform and RCNN was studied and constructed to ensure the health of the bridge. To verify the effectiveness of Gabor wavelet transform in feature extraction and defect detection of stayed cable images, the defects on the dataset images were first defined as 5 categories, namely: stains, dents, cracks, bulges, and normal. The total number of samples was 6789, of which 2160 were normal photos and the remaining were defective photos. The study selected the Scale Invariant Feature Transform (SIFT) algorithm, Accelerated Robust Feature Transform (SURF) algorithm, Template Matching algorithm, and Gabor Wavelet Transform algorithm for feature extraction of stayed cable images. It detected the surface defects of the stayed cable with image integrity of 80 %, 85 %, 90 %, and 95 %, and the detection accuracy is expressed as the ratio of the actual and the detected defect area. The detection results are shown in Table 1.
Table 1Comparison of feature extraction effects
Algorithms | 80 % | 85 % | 90 % | 95 % | ||||
Accuracy (%) | Time (s) | Accuracy (%) | Time (s) | Accuracy (%) | Time (s) | Accuracy (%) | Time (s) | |
SIFT | 79.63 | 1.021 | 81.22 | 0.986 | 83.59 | 0.826 | 86.49 | 0.726 |
SURF | 80.12 | 1.036 | 80.69 | 0.973 | 82.99 | 0.900 | 87.92 | 0.703 |
Template matching | 86.52 | 0.870 | 85.75 | 0.759 | 86.23 | 0.689 | 85.92 | 0.628 |
Gabor-Wavelet transform | 86.59 | 0.598 | 90.53 | 0.553 | 92.59 | 0.478 | 97.82 | 0.379 |
From Table 1 that the greatest benefit is achieved when the defect size discovered by the research’s usage of the Gabor wavelet transform technique is the closest to the real size. Except for the template matching technique, the accuracy and detection speed of the three algorithms have greatly increased with the continual rise in image integrity. The detection accuracy of the template matching method has been maintained at around 86 % when the image integrity reached 80 %. The template matching approach and the Gabor wavelet transform methodology had somewhat greater detection accuracy, at around 86 %; the detection accuracy of the four feature extraction methods was essentially around 80 %. When the picture integrity was 85 %, the Gabor wavelet detection method’s detection accuracy was 90.53 %, and the detection time was 0.553 s, 9.84 % higher than SURF detection accuracy, 43.1 % higher efficiency. Compared with the SIFT algorithm, the detection accuracy was 9.31 % higher, and the efficiency was 43.3 % faster. Compared with the template matching method, the detection accuracy was increased by 4.78 %, and the efficiency was 27.1 % faster; when the image integrity reached 95 %, the detection accuracy of the Gabor wavelet detection method was 97.82 %, and the detection time was 0.379 s, which was 9.90 % higher than the SURF detection accuracy, and the efficiency was 46.1 % higher. Compared with the SIFT algorithm, the detection accuracy was 11.33 % higher, and the efficiency was 47.8 % faster. Compared with the template matching method, the detection accuracy was increased by 11.90 %, and the efficiency was 39.6 % faster. The fault characteristics in the stay cable picture may be correctly and effectively extracted using the Gabor wavelet transform, as can be observed from the examination of the above table.
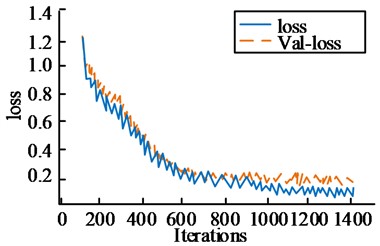
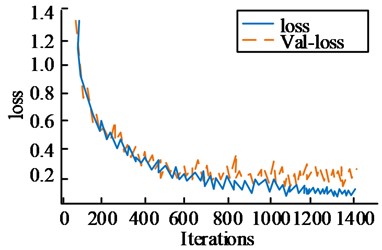
On the same preprocessed image data set, the ZFNet-based Faster RCNN network structure, the AlextNet-based Faster RCNN algorithm, the BP neural network, and the classic RCNN neural network were each used in turn to test the validity of the feature network established in the research. Fig. 6 illustrates how the loss function converged throughout the iterative training procedure.
As illustrated in Fig. 6, the Faster RCNN technique, which used the ZFNet deep feature extraction network in the training phase, significantly improved the pace at which the loss function converges. When the number of iterations was 400, the loss function value was equivalent to that of the AlexNet -based Faster RCNN algorithm when it iterated to 600 times, and the other two algorithms converged to 800 and 820 times respectively to reach a training loss value of 0.2. The function is reduced faster, which can effectively solve the problem of too slow convergence speed during the training, and is more conducive to the recognition performance of the subsequent model.
The receiver operating characteristic (ROC) curve and the area AUC value under the curve were introduced as evaluation criteria in the study, and the classification performance of each algorithm was visually compared, as shown in Fig. 7.
Fig. 6Change curve of loss function
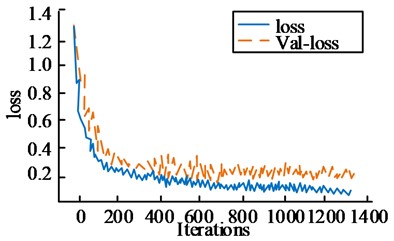
a) ZFNet+Faster RCNN
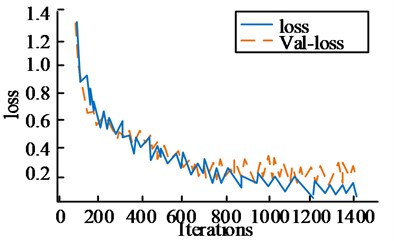
b) AlextNet+Faster RCNN
c) BP
d) RCNN
Fig. 7ROC curve and AUC
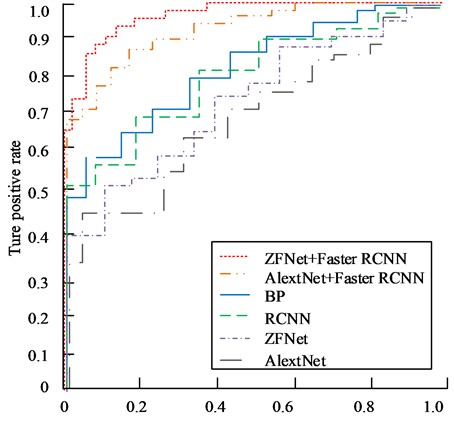
Fig. 7 shows that the Faster RCNN method, which was based on ZFNet, had a ROC curve that was more inclined to the top left corner than the other five curves, and its AUC value was 0.961; the AUC value of the AlextNet -based Faster RCNN algorithm was 0.942, and the area area was larger than the research. The design algorithm was 0.019 less; the AUC value of the BP neural network algorithm was 0.856, which was 0.105 less than the research design algorithm; the AUC value of the traditional RCNN algorithm was 0.843, which was 0.118 less than the research design algorithm. The upgraded RCNN algorithm created by including the feature network ZFNet had a superior classification impact, as can be observed from the content of the above image.
The study will build the cable apparent detection to further confirm the model’s influence on identification and recognition model based on Gabor wavelet transform and RCNN (model 1) and the SSD algorithm to construct the detection and recognition model (model 2), and the YOLOv3 recognition model (model 3), RCNN (Model 4). It selects defect images such as cable-stayed spoiler tube damage, and detects as the number of identification samples increases. The change in model recognition rate is shown in Fig. 8.
Fig. 8Curve of recognition rate changing with sample number
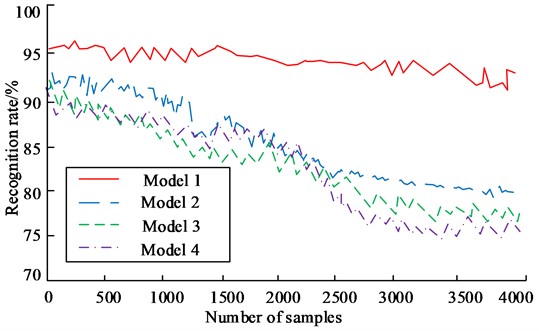
Fig. 8 shows that when the number of samples rose, the identification rates for models 1, 2, 3, and 4 for stay cable flaws all fell. When there were 500 samples, model 1 had a 96.76 % accuracy rate; model 2 had a 93.68 % accuracy rate for recognition, which was 3.04 % lower than model 1; model 3’s recognition accuracy rate was 89.21 %, which was 7.55 percent less than model 1’s. The recognition accuracy of model 4 was 90.62 %, which was 6.14 % lower than that of model 1; when the number of samples increased to 4000, the accuracy of the four models all declined. The decline of model 1 was the smallest, and the recognition accuracy was 94.52 %. Model 2 had a recognition accuracy of 84.39 %, which was 11.03 % lower than Model 1. Model 4 had a recognition accuracy of 83.32 %, which was 11.20 % lower than Model 1. Based on the content in the figure, model 1 has high stability and the highest recognition accuracy among the four recognition models.
The research uses the recall rate (Re), the precision rate (pr) and the accuracy rate to evaluate the recognition of the four models in the three interference situations of image deformation, light change, and noise influence, as well as under normal conditions. Table 2 displays the information.
Table 2Evaluation of model identification
Interference | Evaluating indicator | Model 1 | Model 3 | Model 4 |
Image deformation | Re | 91.13 % | 87.26 % | 86.94 % |
PR | 92.64 % | 86.98 % | 87.01 % | |
Accuracy | 91.69 % | 87.02 % | 86.99 % | |
Light variation | Re | 90.01 % | 86.29 % | 87.02 % |
PR | 91.56 % | 86.23 % | 86.58 % | |
Accuracy | 90.26 % | 86.20 % | 86.72 % | |
Noise impact | Re | 88.39 % | 83.56 % | 84.02 % |
PR | 89.46 % | 84.10 % | 83.76 % | |
Accuracy | 88.97 % | 83.97 % | 83.89 % | |
Normal | Re | 93.36 % | 89.57 % | 89.38 % |
PR | 95.50 % | 91.33 % | 91.64 % | |
Accuracy | 94.14 % | 90.28 % | 90.71 % |
From Table 2 that under different interference conditions, the recognition of each model was affected to varying degrees, and model 1 was the least affected. Model 1 achieved an average recall of 89.84 %, precision of 91.22 %, and accuracy of 90.31 % under the three distractors. The average recall rate, the precision rate and the accuracy rate of model 2 was 84.00 %, 83.22 % and 83.20 %, respectively. The average precision rate was 7.11 % lower than that of model 1. The average recall rate, the precision rate and the accuracy rate of model 3 was 85.70 %, 85.77 % and 85.73 %, respectively. The average precision rate was 4.58 % lower than that of model 1. Model 4 has an average recall rate, the precision rate and the accuracy rate of 85.99 %, 85.78 % and 85.87 %, respectively. The average accuracy rate was 4.44 % lower than that of model 1; The recognition accuracy rate of 2 has increased by 7.22 %, which was 3.88 % higher than that of model 3, and 3.43 % higher than that of model 4. Based on the above content, the intelligent detection model for apparent defects of cable stays based on Gabor wavelet transform and improved regional CNN can efficiently and accurately identify various defects of cable stays, and achieve the goal of timely maintenance of bridges and ensuring bridge health.
5. Conclusions
The majority of stayed cables, which serve as the “lifeline” of cable-stayed bridges, are formed of parallel, high-strength steel wires. They are exposed to environmental corrosion and alternating loads in the ambient atmosphere all the year round, which is prone to cumulative fatigue damage and seriously threatens the bridge structure. safety. The real-time monitoring of the safety status of the stayed cable structure of the bridge is an essential work to ensure the normal operation of the bridge. For this reason, the median filter was used to denoise the image of the cable stay, and the impact of light on the picture was reduced using the Retinex algorithm. The OTSU approach was used to implement image segmentation after the picture has been preprocessed using the aforementioned techniques. The Gabor wavelet transform was then used to extract the image’s texture information. The obtained feature image was applied to the recognition model, because the research employed Faster RCNN to develop a recognition model since the regular CNN would produce a huge number of parameters, resulting in an inadequate training pace and uses ZFNet as a feature extraction network. Based on this, the research built an intelligent detection model for apparent defects of stay cables based on Gabor wavelet transform and improved RCNN. Through experimental verification and analysis, the recall rate, the recognition precision rate and accuracy rate of the model constructed in this research was 93.36 %, 95.50 % and 94.14 %, respectively. The research carried out real-time detection of the damage status of the stay cables, but did not classify the types of defects in detail, which can be further divided in subsequent studies to achieve more detailed health monitoring.
References
-
A. Javanmardi, K. Ghaedi, F. Huang, M. U. Hanif, and A. Tabrizikahou, “Application of structural control systems for the cables of cable-stayed bridges: state-of-the-art and state-of-the-practice,” Archives of Computational Methods in Engineering, Vol. 29, No. 3, pp. 1611–1641, May 2022, https://doi.org/10.1007/s11831-021-09632-4
-
B. Atmaca, T. Dede, and M. Grzywinski, “Optimization of cables size and prestressing force for a single pylon cable-stayed bridge with Jaya algorithm,” Steel and Composite Structures, Vol. 34, No. 6, pp. 853–862, 2020, https://doi.org/10.12989/scs.2020.34.6.853
-
S. Invernizzi, F. Montagnoli, and A. Carpinteri, “Fatigue assessment of the collapsed XXth Century cable-stayed Polcevera Bridge in Genoa,” Procedia Structural Integrity, Vol. 18, pp. 237–244, 2019, https://doi.org/10.1016/j.prostr.2019.08.159
-
Y. Feng, C. Lan, B. Briseghella, L. Fenu, and T. Zordan, “Cable optimization of a cable-stayed bridge based on genetic algorithms and the influence matrix method,” Engineering Optimization, Vol. 54, No. 1, pp. 20–39, Jan. 2022, https://doi.org/10.1080/0305215x.2020.1850709
-
A. Ghasemzadeh, S. Sarbazi Azad, and E. Esmaeili, “Breast cancer detection based on Gabor-wavelet transform and machine learning methods,” International Journal of Machine Learning and Cybernetics, Vol. 10, No. 7, pp. 1603–1612, Jul. 2019, https://doi.org/10.1007/s13042-018-0837-2
-
H. Son, Y. Jang, S.-E. Kim, D. Kim, and J.-W. Park, “Deep learning-based anomaly detection to classify inaccurate data and damaged condition of a cable-stayed bridge,” IEEE Access, Vol. 9, pp. 124549–124559, 2021, https://doi.org/10.1109/access.2021.3100419
-
H. Xin, L. Cheng, R. Diender, and M. Veljkovic, “Fracture acoustic emission signals identification of stay cables in bridge engineering application using deep transfer learning and wavelet analysis,” Advances in Bridge Engineering, Vol. 1, No. 1, pp. 1–16, Dec. 2020, https://doi.org/10.1186/s43251-020-00006-7
-
X. Li, C. Gao, Y. Guo, F. He, and Y. Shao, “Cable surface damage detection in cable-stayed bridges using optical techniques and image mosaicking,” Optics and Laser Technology, Vol. 110, No. 1, pp. 36–43, Feb. 2019, https://doi.org/10.1016/j.optlastec.2018.07.012
-
C. Chu, F. Ghrib, and S. Cheng, “Cable tension monitoring through feature-based video image processing,” Journal of Civil Structural Health Monitoring, Vol. 11, No. 1, pp. 69–84, Feb. 2021, https://doi.org/10.1007/s13349-020-00438-9
-
M. H. Daneshvar, A. Gharighoran, S. A. Zareei, and A. Karamodin, “Early damage detection under massive data via innovative hybrid methods: application to a large-scale cable-stayed bridge,” Structure and Infrastructure Engineering, Vol. 17, No. 7, pp. 902–920, Jul. 2021, https://doi.org/10.1080/15732479.2020.1777572
-
A. Muthukrishnan, J. Charles Rajesh Kumar, D. Vinod Kumar, and M. Kanagaraj, “Internet of image things-discrete wavelet transform and Gabor wavelet transform based image enhancement resolution technique for IoT satellite applications,” Cognitive Systems Research, Vol. 57, pp. 46–53, Oct. 2019, https://doi.org/10.1016/j.cogsys.2018.10.010
-
Q. Zhang, H. Li, M. Li, and L. Ding, “Feature extraction of face image based on LBP and 2-D Gabor wavelet transform,” Mathematical Biosciences and Engineering, Vol. 17, No. 2, pp. 1578–1592, 2020, https://doi.org/10.3934/mbe.2020082
-
D. M. Kumar, D. Satyanarayana, and M. N. G. Prasad, “An improved Gabor wavelet transform and rough K-means clustering algorithm for MRI brain tumor image segmentation,” Multimedia Tools and Applications, Vol. 80, No. 5, pp. 6939–6957, Feb. 2021, https://doi.org/10.1007/s11042-020-09635-6
-
X. Zhang, Z. Liu, J. Wang, and J. Wang, “Time-frequency analysis for bearing fault diagnosis using multiple Q-factor Gabor wavelets,” ISA Transactions, Vol. 87, pp. 225–234, Apr. 2019, https://doi.org/10.1016/j.isatra.2018.11.033
-
R. B. Wicaksono, S. Aulia, S. Hadiyoso, and B. Hidayat, “Human height and weight classification based on footprint using Gabor wavelet and K-NN methods,” Jurnal Infotel, Vol. 14, No. 2, pp. 101–107, May 2022, https://doi.org/10.20895/infotel.v14i2.728
-
P. Bharati and A. Pramanik, “Deep learning techniques-R-CNN to mask R-CNN: a survey,” Computational Intelligence in Pattern Recognition, pp. 657–668, 2020, https://doi.org/10.1007/978-981-13-9042-5_56
-
S. Albahli, M. Nawaz, A. Javed, and A. Irtaza, “An improved faster-RCNN model for handwritten character recognition,” Arabian Journal for Science and Engineering, Vol. 46, No. 9, pp. 8509–8523, Sep. 2021, https://doi.org/10.1007/s13369-021-05471-4
-
D. Jiang, G. Li, C. Tan, L. Huang, Y. Sun, and J. Kong, “Semantic segmentation for multiscale target based on object recognition using the improved Faster-RCNN model,” Future Generation Computer Systems, Vol. 123, pp. 94–104, Oct. 2021, https://doi.org/10.1016/j.future.2021.04.019
-
M. Vania and D. Lee, “Intervertebral disc instance segmentation using a multistage optimization mask-RCNN (MOM-RCNN),” Journal of Computational Design and Engineering, Vol. 8, No. 4, pp. 1023–1036, Jun. 2021, https://doi.org/10.1093/jcde/qwab030
-
B. Hu and J. Wang, “Detection of PCB surface defects with improved faster-RCNN and feature pyramid network,” IEEE Access, Vol. 8, pp. 108335–108345, 2020, https://doi.org/10.1109/access.2020.3001349
About this article

The authors have not disclosed any funding.
The datasets generated during and/or analyzed during the current study are available from the corresponding author on reasonable request.
The authors declare that they have no conflict of interest.
