Abstract
In this study, BaO-ZnO-TiO2 SiO2 was used as the research system, and IR, XRD and DTA analysis were used to study the structure, thermal behavior, crystallization phenomenon and chemical stability of the glass when different proportions of ZnO gradually replaced BaO in this system. The results indicate that replacing BaO with ZnO does not change the amorphous structure of the glass, and the density of the glass increases with the increase of ZnO content. With the increase of ZnO content in glass, the tendency of devitrification increases during cooling, indicating an increased tendency for surface crystallization of glass. The glass with high ZnO content has the highest density and refractive index, and has the best water resistance. However, at this time, the glass is easier to crystallize after heat treatment.
Highlights
- Replacing BaO with ZnO in the system did not change the structure of the glass, and the density of the material showed an increasing trend with the increase of ZnO content.
- The devitrification trend of glass during cooling gradually becomes apparent with the increase of ZnO content, indicating that the surface crystallization trend of glass gradually increases.
- The glass with high ZnO content has the highest density and refractive index, and has the best water resistance. However, this glass is easier to crystallize after heat treatment.
1. Introduction
High refractive index glass is the main component of retroreflective materials. Retroreflective materials are thin film materials made using optical refraction and reflection principles using glass microspheres or micro prisms, and are a new type of reflective material. Among them, the ball is the main optical element for achieving reverse reflection function, generally with a high refractive index. After receiving incident light, it can basically return most of the light energy in a direction parallel to but opposite to the incident light. Therefore, it is also called a retroreflective material, and is commonly used as a safety indicator sign. It is widely used in road safety facilities and various protective equipment, such as reflective traffic signs, reflective road markings, and reflective vehicle body recognition Warning signs for faulty vehicles, high visibility warning clothing, reflective raincoats, reflective warning tapes, etc., serve as a warning to drivers at night to avoid or reduce accidents [1-3].
High refractive index glass bead is mainly made of water quenched glass materials with high refractive index. After drying and grinding, they are fired by flame [4-7]. Glass is a metastable substance that is prone to spontaneous crystallization under certain thermodynamic conditions, thereby affecting the property of the glass itself. Therefore, a qualified high refractive index glass material that is not easily lost is a prerequisite for preparing high refractive index glass beads. Typical and successfully commercialized high refractive index glass bead are composed of BaO-TiO2 glasses, of which TiO2 is a glass forming agent and SiO2 is an excellent glass network forming agent. Adding these substances to the titanate glass system is conducive to the formation of glass and reduces glass loss during cooling [8-10]. In the glass composition, BaO is the external main body of the glass network, used to increase the refractive index of the glass. In order to further improve the refractive index of glass, both BaO and ZnO can be used in the system [11-12].
Nowadays, a large number of research results have proven that according to the calculation method of glass refractive index, in order to obtain glass with higher refractive index, it is necessary to add some raw materials with high refractive index themselves to the system to modify the entire system, such as TiO2, B2O3, TiO2, ZrO2, PbO and other high refractive index materials [13-14]. Based on previous research, in order to obtain a high refractive index glass system and explore the role of ZnO in BaO-TiO2 based glass, this study used ZnO to gradually replace SiO2 in the original system, and analyzed and characterized the structural properties of the sample.
2. Experimental
2.1. Raw materials
The raw materials used in this study are shown in Table 1, including SiO2, ZnO, TiO2, BaCO3, CaCO3, and Al2O3. All raw materials and experiments are actually analytical reagents.
Table 1Raw material type and manufacturer
Reagent name | Molecular formula | Molecular weight | Purity | Manufacturer |
Quartz sand | SiO2 | 60.08 | – | – |
Titanium dioxide | TiO2 | 79.87 | Analytically pure | Shanghai McLean Biochemical Technology Co., Ltd. |
Zinc oxide | ZnO | 81.39 | Analytically pure | Sinopharm Group Chemical Reagent Co., Ltd. |
Barium carbonate | BaCO3 | 197.34 | Analytically pure | Shanghai McLean Biochemical Technology Co., Ltd. |
Calcium carbonate | CaCO3 | 100.09 | Analytically pure | Sinopharm Group Chemical Reagent Co., Ltd. |
Alumina | Al2O3 | 101.96 | Analytically pure | Sinopharm Group Chemical Reagent Co., Ltd. |
2.2. Formula design
In this paper, we have designed and experimentally explored the formulations of two types of glass in the TBS (TiO2+ZnO+CaO, BaO, SiO2) series. The chemical composition of its formula is shown in Table 2. Two glass samples were obtained by melting titanium dioxide, barium carbonate, silicon dioxide, zinc oxide, and calcium carbonate at 1350 ℃ for 0.5 h. The sample with a silicon dioxide content of 15 % was named TBS15, and the sample with a silicon dioxide content of 10 % was named TBS10.
Table 2Involved composition of glass [wt%]
TiO2+ZnO+CaO | BaO | SiO2 | |
TBS10 | 50 | 40 | 10 |
TBS15 | 50 | 35 | 15 |
2.3. Experimental steps
Design the material formula, calculate the dosage of each raw material based on the formula, accurately weigh each raw material, thoroughly mix the raw materials, and obtain a uniformly mixed batch. Place the batch of materials into an alumina crucible and heat it in a high-temperature furnace to 1350 °C for 30 minutes (at a heating rate of 5 °C/min). Quench in water to obtain glass water quenched materials.
2.4. Equations
(1) Refractive index. The refractive index of glass is expressed by the ratio of the sine of the incident angle of light to the sine of the refractive angle:
In the formula: ∠AOB-Incidence angle, ∠COD-Refraction angle.
(2) The relationship between density and refractive index:
where: – Avogadro constant, – oxide molecular weight, – density.
2.5. Sample testing and characterization
(1) X-ray diffraction analysis (XRD). The glass water quenching material is ground into fine powder, and the diffraction pattern of the sample is obtained by X-ray diffractometer analysis, and the data is analyzed by software jade6.0 to determine the crystal phase type of the sample. The X-ray diffractometer used was a Shimadzu XRD-6100 diffractometer.
(2) Infrared spectroscopy (IR). Grind the sample to be tested to below 200 mesh, add a certain amount of KBr, mix and grind evenly and press it into tablets. Use a Fourier transform infrared spectrometer to record the infrared spectrum curve of the sample, and analyze and determine the type of groups or chemical bonds contained in the sample. The infrared spectrometer used was the iS10 type of Nicholas Corporation of the United States.
(3) Density. The glass frit was washed and dried, and the density of the sample was measured by the Archimedes method on a 1/10000 density balance, and the average value was obtained by multiple measurements of 5 groups of samples.
(4) Differential thermal analysis (DTA). Grind the sample to a sufficiently fine point, weigh a certain amount of sample into an alumina crucible and heat it to 1000 °C (heating rate of 10 °C/min). Determine the glass transition temperature (Tg) and crystallization peak temperature of the sample according to the data results. (Tc). The instrument used is a permanent HCT-4 integrated thermal analyzer.
3. Results and Discussion
As shown in Fig. 1(a), both TBS10 and TBS15 formula samples exhibit a wide diffraction peak in the range of 20-40°, indicating that these samples are amorphous in structure and are typical of glass patterns. However, compared to the TBS15 sample, the TBS10 sample has several smaller diffraction peaks at about 47° and 59°, indicating a slight devitrification phenomenon. TBS15 does not have this situation, which may be due to the increase in the content of SiO2 in the formula, as SiO2 is the formative oxide of glass, which helps to reduce the probability of devitrification during vitrification; In addition, an increase in SiO2 content will increase the viscosity of the glass and hinder the long-distance diffusion of the sites required for crystallization. From Fig. 1(b), it can be clearly seen that both TBS10 and TBS15 glass samples have a relatively wide absorption band around 3448 cm-1, the reason for this phenomenon may be the stretching vibration of the O-H bond in the silane alcohol group or the asymmetric stretching vibration of the O-H bond in water. The absorption peak at 960 cm-1 can be attributed to the bending vibration of the Si-O bond, and as the Si content increases, the absorption peak intensity of the TBS15 sample increases around 1630 cm-1. From these results, the peaks of TBS10 at 960 cm-1 and 464 cm-1shift slightly towards a lower wave number compared to the peaks of TBS15, indicating that the structure of TBS10 samples is more porous than that of TBS15. With the increase of Si content in glass, the glass structure is strengthened.
Based on the original formula of TBS15, change the content of BaO and ZnO in the original formula, gradually add 2, 4, 6, and 8 % ZnO instead of BaO in the original formula, to obtain different glass samples, and analyze and compare them. According to the content of ZnO in its formula, it is named as Zn12-Zn18, and the TBS15 sample is named as Zn10 in this section. The melting process and heat treatment system of this part of samples are the same as before. The chemical composition of its formula is shown in Table 3.
Fig. 1a) XRD and b) IR pattern of TBS samples
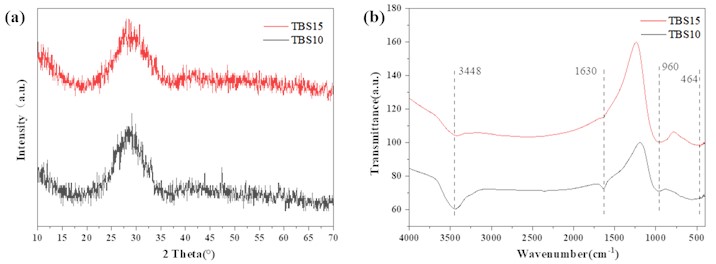
Table 3Involved composition of glass [wt%]
TiO2+ SiO2+CaO | BaO | ZnO | |
Zn10 | 55 | 35 | 10 |
Zn12 | 55 | 33 | 12 |
Zn14 | 55 | 31 | 14 |
Zn16 | 55 | 29 | 16 |
Zn18 | 55 | 27 | 18 |
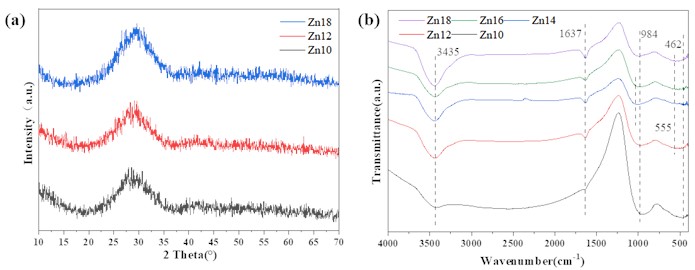
As shown in Fig. 2(a), increase the content of ZnO instead of BaO in the original formula, and the sample still mainly exists in the form of a steamed bread peak, which indicates that adjusting the proportion of Zn/Ba in the glass will not change the amorphous structure of the sample. It can be inferred that Zn14 and Zn16 are also amorphous glass structures. As can be clearly seen from Fig. 2(b), as the content of ZnO increases, the infrared spectrum of the sample shows minimal variation, and the asymmetric stretching vibration of the O-H bond in the water adsorbed by the sample results in a relatively wide absorption band near 3435 cm-1,the bending vibration of the O-H bond in water molecules results in an absorption band near 1637 cm-1, while the asymmetric stretching vibration of the Si-O-Si bond results in an absorption band at 984 cm-1. As the Zn content increases, the absorption band in the sample gradually shifts towards higher wave numbers. The vibration of Ti-O bonds in amorphous titanium dioxide results in a wide absorption peak between 500-700 cm-1. At this point, the absorption peak caused by the symmetric stretching vibration of the Si-O-Si bond at 462 cm-1 is not significant.
Fig. 2a) XRD and b) IR pattern of samples
From Fig. 3(a), it can be seen that the density of the glass samples is above 4.10 g/cm3, and the density gradually increases with the increase of ZnO content. This may be due to the zinc oxide tetrahedron [ZnO4] in the sample entering the structural network of the glass, making the glass structure more dense, so its density presents an increasing trend.
The DTA curves of glass with different ZnO contents are shown in Fig. 3(b). It can be observed that as the heating temperature increases, the DTA curve of the glass shows a weak endothermic peak and three exothermic peaks. The corresponding crystallization peak temperature () and glass transition temperature () are shown in Table 4. As can be seen from Fig. 3(b) and Table 4, the glass transition temperature of the sample gradually decreases with the increase of ZnO content, but the difference is not significant. The crystallization peak temperature significantly decreases, indicating that the activation energy of glass crystallization decreases and the area of the peak gradually decreases, the above indicates that the surface crystallization trend of glass increases with the increase of ZnO content. When a small amount of ZnO is added to the glass, the second crystallization peak is very weak, and then gradually increases with the increase of ZnO content, indicating that crystallization is strengthened, with an exothermic effect; as the ZnO content increases, gradually decreases, indicating an increase in the crystallization and devitrification trend of the glass during the cooling process. After the addition of ZnO, the third crystallization peak temperature of the glass generally shows a weakening trend, and the crystallization temperature fluctuates between 937 and 948 degrees.
Fig. 3a) Density and b) DTA pattern of samples
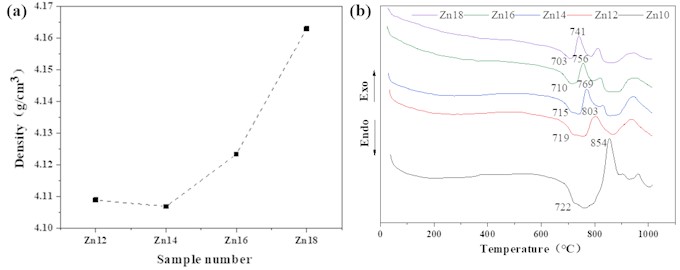
Table 4Tg, Tc and ∆Tc of Zn series samples. (∆Tc=Tc1-Tg, °C)
Sample name | |||||
Zn10 | 722 | 854 | 903 | 962 | 132 |
Zn12 | 719 | 803 | 848 | 937 | 84 |
Zn14 | 715 | 769 | 830 | 944 | 54 |
Zn16 | 710 | 756 | 820 | 945 | 46 |
Zn18 | 703 | 741 | 811 | 948 | 38 |
Conduct water resistance test on various samples of Zn series. The test was conducted in two stages, the first for Zn14, Zn16, and Zn18, and the second for Zn12. The water resistance test was conducted at 98 ℃, and the acid consumption data during the titration process of the sample particle solution are shown in Table 5. According to the standard for water resistance classification of glass beads in GB/T6582-1997, the water resistance of HGB1 indicates that the hydrochloric acid solution consumed per gram of glass particles is between 0 and 0.1 ml/g. After careful comparison of the Zn series samples, it was found that their water resistance generally decreased with the increase of Zn content, indicating that the glass stability decreased to a certain extent with the increase of ZnO content. The experimental results showed that the refractive indices of Zn10, Zn12, and Zn18 glasses were 1.93, 1.82, and 1.87, respectively. The glass with a ZnO content of 10 % had the highest refractive index, which is consistent with the trend of density and crystallization strength. Therefore, from the perspective of improving chemical stability, it is necessary to select the appropriate ZnO/BaO ratio to obtain high refractive index microspheres in this system.
Table 5Sample acid consumption
Sample serial number | Acid consumption per unit sample (mL/g) |
Zn10 | 0.02 |
Zn12 | 0.02 |
Zn14 | 0.025 |
Zn16 | 0.035 |
Zn18 | 0.045 |
4. Conclusions
In this part of the research, the BaO-ZnO-TiO2 SiO2 glass system is used as the research system, and ZnO is used to gradually replace the BaO in the system to prepare high refractive index glass bead. Through relevant testing and performance analysis, the main conclusions are as follows:
1) Replacing BaO with ZnO in the system did not change the structure of the glass, and the density of the material showed an increasing trend with the increase of ZnO content.
2) The devitrification trend of glass during cooling gradually becomes apparent with the increase of ZnO content, indicating that the surface crystallization trend of glass gradually increases.
3) The glass with high ZnO content has the highest density and refractive index, and has the best water resistance. However, this glass is easier to crystallize after heat treatment.
References
-
Nigel Anderson and Morgenzicht Witkoppen, “Retro-reflective materials,” United States Patent: 3971692, 1976.
-
Y. Huang and Y. Chen, “Analysis of the present situation in the retro reflective materials,” New Chemical Materials, No. 9, pp. 22–25, 1999.
-
M. H. Zhang, J. D. Yu, X. H. Pan, Y. X., Chen, and Y. Liu, “Preparation and up conversion luminescence of Nd3+/Yb3+ Co-doped La2O3-TiO2-ZrO2glass-ceramics,” Journal of Inorganic Materials, Vol. 28, No. 8, pp. 896–900, 2013.
-
R. O. Alekseev, N. A. Romanov, V. I. Savinkov, N. N. Klimenko, and V. N. Sigaev, “Multicomponent optical glasses with high refractive index,” Glass and Ceramics, Vol. 78, No. 1-2, pp. 3–7, May 2021, https://doi.org/10.1007/s10717-021-00338-4
-
A. Saitoh et al., “Origins of the coloration from structure and valence state of bismuth oxide glasses,” Journal of Non-Crystalline Solids, Vol. 560, No. 1, p. 120720, May 2021, https://doi.org/10.1016/j.jnoncrysol.2021.120720
-
X. J. Liu, Z. D. Deng, T. Z. Ying, G. F., Yang, and B. Yin, “BaO-TiO2-SiO2system high refractive index optical glass,” Glass Enamel and Ophthalmic Optics, Vol. 34, No. 1, pp. 5–9, 2006.
-
N. Kitamura, K. Fukumi, K. Kintaka, H. Ofuchi, T. Honma, and T. Akai, “Development and precision molding of optical glasses with high refractive index for optical applications,” Key Engineering Materials, Vol. 702, pp. 96–100, 2016.
-
G. Lakshminarayana, H. Yang, Y. Teng, and J. Qiu, “Spectral analysis of Pr3+-, Sm3+ – and Dy3+-doped transparent GeO2-BaO-TiO2 glass ceramics,” Journal of Luminescence, Vol. 129, No. 1, pp. 59–68, Jan. 2009, https://doi.org/10.1016/j.jlumin.2008.08.001
-
R. Ogawa, H. Masai, Y. Takahashi, H. Mori, T. Fujiwara, and T. Komatsu, “Crystallization behavior of BaO-TiO2-GeO2glass thin film,” Key Engineering Materials, Vol. 388, pp. 149–152, 2009.
-
H. Masai et al., “Precipitation of Pt nanocrystallites from BaO-TiO2-GeO2 remelted glass,” Journal of Applied Physics, Vol. 111, No. 12, p. 223, Jun. 2012, https://doi.org/10.1063/1.4729488
-
Y. P. Pu, M. Dong, and Z. He, “Preparation of high-refractive-index glass beads in TiO2-BaO-SiO2 system,” Glass and Enamel, Vol. 32, No. 2, pp. 25–28, 2004.
-
Y. T. An, B. H. Choi, and H. S. Kim, “Interaction between transparent dielectric of Bi2O3-B2O3-BaO-ZnO glass and ag electrode,” Korean Journal of Materials Research, Vol. 18, No. 12, pp. 678–682, 2008.
-
F. X. Gan, “A new calculation system for the physical properties of inorganic oxide glasses,” (in Chinese), Scientia Sinica (Mathematica), Vol. 7, No. 4, pp. 351–366, 1974.
-
F. X. Gan, “A new calculation system for the physical properties of silicate glass,” (in Chinese), Journal of the Chinese Ceramic Society, Vol. 1, No. 2, pp. 55–76, 1962.
About this article

The authors have not disclosed any funding.
The datasets generated during and/or analyzed during the current study are available from the corresponding author on reasonable request.
The authors declare that they have no conflict of interest.
