Abstract
Noise, Vibration & Harshness (NVH) is one of the key parameters associated with comfort of an automobile. An Electric Vehicle (EV) consists of transmission driven by electric motor which ultimately gets its power or current supply from inverter. As per Electric vehicle architecture, motor ranks first followed by transmission and inverter in terms of NVH performance. The function of an inverter is to convert DC current from battery source to 3-phase AC current which goes to electric motor. Torque and speed characteristics of motor is dependent on current and voltage supply from inverter. Hence it is important to assess NVH characteristics of inverter as well. In this paper, vibration and acoustic performance of a standalone EV inverter have been studied by testing it at different vehicle operating conditions. Ideally the output 3 phase AC current from inverter should contain only electrical frequency, but it is observed that AC current contains harmonics in the form of linear combination of electrical frequency and switching frequency. From this study, observations from NVH tests on an EV inverter is highlighted in frequency range where relatively high vibration and noise levels were present.
1. Introduction
An EV mainly consists of components such as battery source, inverter, motor and transmission. The main function of an inverter is to convert DC current from battery source to 3-phase AC current which goes into motor. The technique which is used to convert DC current from battery to 3-phase AC current to motor is Pulse width modulation (PWM) [1]. The frequency at which this conversion occurs is termed as switching frequency. This switching frequency is usually same across inverter’s different operating conditions. The speed at which motor rotates is governed by electrical frequency of 3-phase AC current from inverter. When the output current signal from inverter is analyzed, it is observed that amplitude of AC current in frequency domain has sharp peaks of higher amplitude at switching frequency [7]. Further it is observed that AC current has higher amplitude in sidebands of combination of switching frequency and electrical frequency [1]. This fluctuation in current gives rise to fluctuating forces and hence leads to vibration in structures where AC current is passing such as inverter housing and motor [9].
In this paper, focus is on NVH characteristics of an inverter. Through literature it is observed that there are various sources responsible for noise in a power electronic device such as inverter [2]. These sources are Lorentz forces, magnetostriction and electrostriction. These phenomena are applicable to electrical components which is generally present in inverter. Broadly speaking, conducting units such as AC and DC busbars are responsible for noise generated due to EMAG sources [8]. Choke coil (inductors) are responsible for noise due to magnetostriction while MLCC capacitors are responsible for noise generated due to electrostriction phenomena.
In literatures, information about noise levels for individual key electrical components are present, but overall noise characteristic of inverter is not available. In this paper, emphasize is given on testing to measure overall vibration and noise levels of an inverter keeping the focus of this study around switching frequency of inverter. This test setup or testing is applicable to all power electronics product which has noise radiating components such as busbars, inductors & capacitors.
2. Problem description
It was believed that motor is the noisiest component in EV, but recent study shows that inverter is also responsible for noise at higher frequency [2]. The 3-phase AC current has ripples developed due to PWM technique from IGBTs which causes sharp peaks of higher amplitude of current around switching frequency [7]. These currents are responsible for force fluctuation in electrical components like busbars. These fluctuation in forces cause vibration in structure and hence leads to noise at around switching frequency ranging from 5 to 15 kHz depending upon inverter application. In this paper, responses obtained from vibration and acoustic testing on an inverter at different operating conditions are shown at higher frequency range which can prove to be irritating to a person or observer sitting inside vehicle cabin.
3. Sources of noise
Inverters are an integrated part of electric propulsion system of EV. At various vehicle modes such as charging, driving, cruising etc., these components radiate humming, buzzing, tonal noise at higher frequencies. As per literature, current state of power electronics of Inverter and its noise excitation mechanism is studied. There are broadly three phenomena responsible for high frequency tonal noise in an inverter. They are Lorentz forces, magnetostriction and electrostriction. The components like busbars, inductors, MLCCs etc. are key components used in inverter to radiate noise as it is observed that these three phenomena radiate significant noise even when tested separately. These components if present inside inverter radiates acoustic noise as a combination or separately through different physics which are given below:
3.1. Lorentz forces
The Lorentz forces which is proportional to current flowing through 3 parallel conductors for ex: in busbars is given by following equation:
where, is current, is gap between conductors where current is flowing [3]. When current is varying with respect to time, forces will also change with time and thus responsible for vibration excitation for electrical conductors such as AC & DC busbars inside inverter [6]. The force will get transferred through busbar supports to inverter housing.
3.2. Magnetostriction
When a component such as inductor is present inside inverter, it leads to strain in core at a frequency of current which is passing through it. This leads to change in dimension of core and leads to vibration and thus noise to structure [4]. Inverter has common mode chokes to filter out output signal. As it is a vital component its placement on inverter is responsible for acoustic noise radiation.
3.3. Electrostriction
Electric field polarizes a dielectric medium in presence of varying voltage. This leads to yielding of dielectric medium at frequency of fluctuating voltage. This fluctuation leads to force transfer on PCB where MLCC capacitors are mounted and thus vibration is transferred to structure. Noise is generated through this source is caused by voltage characteristics of each MLCCs [3]. Usually, a PCB consists of many MLCCs which can potentially produce significant forces. This force gets transferred through PCB mounts and radiates noise.
4. Test setup
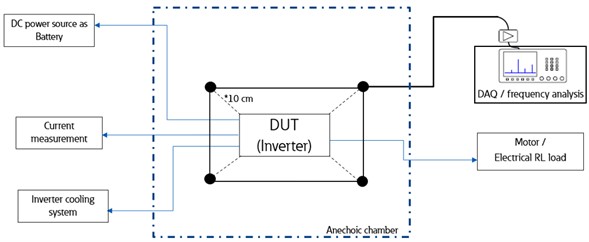
The test setup consists of inverter as DUT along with supporting components required for its functioning at different operating conditions. These supporting components include DC power input which acts as DC power source for inverter. Cooling channel unit is required to remove heat generated during IGBT’s operation from inverter. Resistive inductive load (R-L load) has been tuned to mimic motor load which draws current from inverter. A fixture is used to hold DUT to isolate ground vibrations interfering with vibration generated due to electrical sources at operating conditions. For sound measurement a customized hemi-anechoic chamber is built to isolate inverter acoustic noise from background noise. A microphone setup is used to measure sound pressure level (SPL) at 10 cm from inverter which is defined as per OEM requirement. This test is performed in two parts where vibration responses were measured on housing followed by acoustic noise measurement from inverter. In this test, designing of anechoic chamber was critical to isolate low frequency noise from high frequency acoustic noise near switching frequency zone. Hence details about design of anechoic chamber are mentioned in detail.
Fig. 1Schematic of acoustic testing of inverter and supporting components required to make inverter functional
4.1. Construction of anechoic chamber
The dimension of anechoic chamber should comply as per requirement given by ISO3745 which implies that maximum volume of the object measured inside the chamber should be less than or equal to 5 percent of volume of inside volume of anechoic chamber .
Considering the approximate dimensions of DUT used in this testing, the volume of object is around 0.0224 m3.
Hence the volume of chamber comes out to be 0.448 m3 which is rounded off to 0.5 m3 as it is better to have a chamber as large as possible.
Since the volume of chamber is fixed, it is now required to fix the chamber dimensions. The room dimensions are given in terms of the ratios of length of three sides of rectangular chamber as per room proportion criterion mentioned in Bolt [5].
The plot mentioned in Bolt [5] useful for designing rectangular anechoic chamber to isolate excitation due to room modes. According to recommendations, the minimum dimensions of anechoic chamber should be following 1:1.2:1.4.
From volume of chamber: = 0.5 m3.
Solving equations: 0.67 m, 0.8 m, 0.94 m.
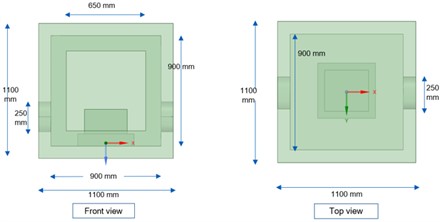
Due to ease of manufacturing, the finalized dimension of chamber from inside is 0.9 m×0.9 m×0.9 m as mentioned in Fig. 2. The design of such chamber can be done as per [5] based on DUT of choice and individual application.
Fig. 2Dimensions of acoustic chamber for testing of inverter, test setup for acoustic testing inside chamber
5. Test conditions
Testing is conducted in a room where DC power input is present along with space to keep RL load, CCU and anechoic chamber. This testing is conducted in two parts.
5.1. Vibration testing
For vibration testing, DUT is mounted on a fixture with the help of bolts which is again mounted on bench. Since response levels due to electrical sources are low, it is better to use Laser Doppler Vibrometer (LDV) instead of accelerometers as former can measure responses without contacting object. Here inverter is placed on fixture to isolate ground vibrations which could interfere with vibration responses from LDV. The inverter is powered on at different operating conditions as mentioned in Table 1 and vibration is measured on housing surface. For measurement of vibration responses, LDV is pointed on inverter housing.
Table 1Operating conditions for vibration testing
S. No. | Output current from Inverter (in rms) | Electrical frequency | Switching frequency |
1 | 36 amps | 450 Hz | 10 kHz |
2 | 50 amps | 500 Hz | 10 kHz |
3 | 48 amps | 700 Hz | 10 kHz |
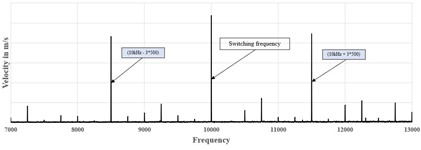
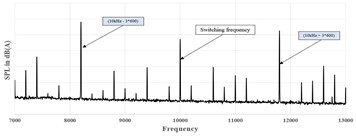
The responses measured at given operating condition for inverter are given in Fig. 3. Here the differences in test conditions are rms value of AC current and electrical frequency of AC current while switching frequency remains same for these 3 testing conditions as mentioned in Table 1.
Through vibration testing, it is observed that responses from inverter near switching frequency and harmonics of switching and electrical frequency are responsible for significant vibration levels from inverter due to 3 phase AC current as per Fig. 3. As per observed significant peaks from vibration test, acoustic testing is performed subsequently as well to evaluate noise due to these vibration signatures.
5.2. Acoustic testing
For acoustic testing, DUT is placed inside anechoic chamber and is powered on using cables which is coming out from chamber from side cavities as per schematic given in Fig. 1.
A set of microphones is placed inside anechoic chamber, around inverter and is powered on using cables coming from side conduits. The side openings of anechoic chamber are sealed using industrial wax after wiring setup. Thus, testing is commenced, and reading is taken at different inverter operating conditions as mentioned in Table [2].
Fig. 3Vibration responses (m/s vs frequency in Hz) of inverter housing
a) Test 1
b) Test 2
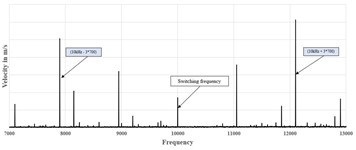
c) Test 3
Table 2Operating conditions for acoustic testing
S No. | Output current from Inverter (in rms) | Electrical frequency | Switching frequency |
0 | 0 amps | Power off | Power off |
1 | 138 amps | 500 Hz | 10 kHz |
2 | 130 amps | 600 Hz | 10 kHz |
3 | 122 amps | 700 Hz | 10 kHz |
The sound pressure level (SPL) is measured for above mentioned operating conditions of inverter. The acoustic test is performed at higher power rating as compared to vibration test which reflects from higher rms AC current value of inverter. It is observed that power electronics devices tend to radiate greater acoustic noise at higher current levels.
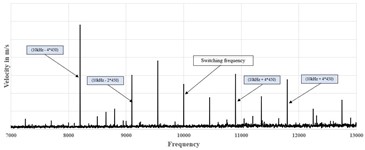
The outcome from acoustic testing is given in fig [4] where sharp peaks are observed at and around switching frequency while for power off condition, no peaks were observed which confirms that there is no background noise present even at higher frequency.
Fig. 4Acoustic responses of inverter housing (SPL vs frequency in Hz)
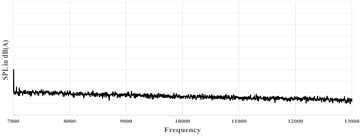
a) Test 0
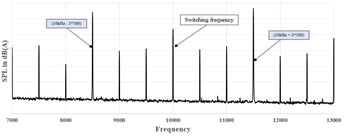
b) Test 1
c) Test 2
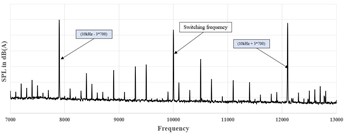
d) Test 3
6. Observations
As per Fig. 3 vibration responses at switching frequency are higher when rms AC current from inverter is higher (Amplitude of current in Test 2 > Test 3 > Test 1). Hence amplitude of vibration is directly proportional to magnitude of rms AC current which governs equation [1] that Emag force increases with current amplitude. Also from Fig. 3 and 4 it can be deduced that harmonics of higher amplitude AC current is present at 10 kHz ± (N)*electrical frequency where 1, 2, 3, etc. along with switching frequency. Hence, higher magnitude of vibration is observed at switching frequency as well as combination of switching and electrical frequency. Since acoustic testing is done with higher power rating as compared to vibration testing as evident from Table 1 and 2, SPL at switching frequency and at combination of switching and electrical frequency have sharp response levels as observed in Fig. 4 than Fig. 3. SPL response around switching frequency is following same trend as responses from vibration testing and has harmonics present at combination of switching and electrical frequencies of higher amplitude. An interesting finding which is common to both acoustic and vibration testing is that amplitude of third harmonic 10 kHz ± 3*electrical frequency has higher response as compared to other harmonics except Test 1 case of vibration testing.
7. Conclusions
The trend of vibration responses at harmonics of combination of switching frequency and electrical frequency correlates with acoustic testing performed on inverter. Hence it can be concluded that AC current ripples cause high level of vibration and acoustic noise response around switching frequency of inverter. This testing helped to pinpoint areas and frequency range where noise issue needs to be addressed for an inverter. Thus, giving advantage in benchmarking inverter as per acoustic noise performance for EVs.
References
-
R. Shao, Z. Guo, and L. Chang, “A PWM strategy for acoustic noise reduction for grid-connected single-phase inverters,” in PEC 07 – Twenty-Second Annual IEEE Applied Power Electronics Conference and Exposition, Feb. 2007, https://doi.org/10.1109/apex.2007.357530
-
P. M. Korner, R. Stiegler, J. Meyer, T. Wohlfahrt, C. Waniek, and J. M. A. Myrzik, “Acoustic noise of massmarket equipment caused by supraharmonics in the frequency range 2 to 20 kHz,” in 2018 18th International Conference on Harmonics and Quality of Power (ICHQP), May 2018, https://doi.org/10.1109/ichqp.2018.8378856
-
B. Klarin, P. Olbrich, M. Resch, T. Resch, S. Brandl, and H. Reindl, “Power electronic noise-simulation measurement comparison,” Noise and Vibration Conference and Exhibition, Jun. 2019, https://doi.org/10.4271/2019-01-1451
-
J. Miihlethaler, M. Schubiger, U. Badstubner, and J. W. Kolar, “Acoustic noise in inductive power components,” in 2013 15th European Conference on Power Electronics and Applications (EPE), Sep. 2013, https://doi.org/10.1109/epe.2013.6634420
-
R. H. Bolt, “Note on normal frequency statistics for rectangular rooms,” The Journal of the Acoustical Society of America, Vol. 18, No. 1, pp. 130–133, Jul. 1946, https://doi.org/10.1121/1.1916349
-
F. M. Yusop, M. K. M. Jamil, D. Ishak, and S. Masri, “Study on the electromagnetic force affected by short-circuit current in vertical and horizontal arrangement of busbar system,” in 2011 International Conference on Electrical, Control and Computer Engineering (INECCE), Jun. 2011, https://doi.org/10.1109/inecce.2011.5953875
-
V. Radha and Z. M. Ripin, “Correlation between PWM modulation of an induction motor inverter and radiated electromagnetic acoustic noise,” in 2014 IEEE International Conference on Control System, Computing and Engineering (ICCSCE), Nov. 2014, https://doi.org/10.1109/iccsce.2014.7072728
-
F. Marignetti et al., “Noise and vibration analysis of an inverter-fed three-phase induction motor,” in 2020 International Symposium on Power Electronics, Electrical Drives, Automation and Motion (SPEEDAM), Jun. 2020, https://doi.org/10.1109/ias.2004.1348746
-
I. P. Tsoumas and H. Tischmacher, “Influence of the inverter’s modulation technique on the audible noise of electric motors,” IEEE Transactions on Industry Applications, Vol. 50, No. 1, pp. 269–278, Jan. 2014, https://doi.org/10.1109/tia.2013.2268453
About this article

We are thankful to Eaton India Innovation Centre, Pune for providing this opportunity and infrastructure to perform this task. We are thankful to leadership at EIIC Pune and Eaton for providing guidance and continuous support.
The datasets generated during and/or analyzed during the current study are available from the corresponding author on reasonable request.
The authors declare that they have no conflict of interest.
