Abstract
In this paper, the fuel pump impeller was selected as a typical airborne equipment for the investigation of random vibration fatigue. First, based on the platform of ANSYS WORKBENCH, the reasonable calculation of FSI for the impeller was carried out. Then, the stress was transferred to modal analysis, and the prestress-structure modal was extracted. Through random vibration response analysis, the stress of the impeller was obtained. The Palmgren and Miner rule and Dirlik fatigue calculation method was used to calculate fatigue life, and the result was consistent with practice. The work in this paper provided a method about how to obtain random vibration fatigue life with prestress-structure, which was critical references for aviation technologists.
Highlights
- The effect of prestress to mode and random vibration fatigue for a typical airborne equipment was studied.
- According to Miner linear fatigue accumulation law, random vibration fatigue life was studied based on the three interval method. damage values and fatigue life at dangerous points was obtained. The product development cycle has been shortened and the testing cost has been saved effectively.
- The calculation method in this article had been applied in engineering practice and could solve problems effectively, it contained engineers' years of experience. The calculation method in this article not only can calculate fatigue life, but also was operational. The calculation process is easy and effective, which is required in engineering.
1. Introduction
Compared to fixed-wing aircrafts, the vibration environment of helicopters was more complicated. The main vibration sources of helicopters were the rotor and tail rotor systems. Helicopters can perform various flight maneuvers because of the aerodynamic force generated by rotor and tail rotor. In-flight, deformation of swing, shimmy, and torsional existed on rotor blade because of the airflow. Periodic alternating forces and moments are generated on the hub, and these forces and moments were transmitted to the fuselage through the hub. These were vibration sources, and had relatively low vibration frequencies, and could be transmitted to various parts of the helicopter through the fuselage. These vibration sources created a unique vibration environment. These vibration sources mainly included periodic vibrations and low broadband random vibration [1], [2]. In addition, high-speed rotary components such as engines and transmission systems also generated periodic vibrations. Airborne equipment is prone to fatigue failure under the vibration loads, it would directly affect the safety of helicopter pilot. Therefore, it is necessary to analyze the fatigue life of random vibration.
Some airborne equipment had complex working cases and special structure, the model would change under the influence of prestress. Components exhibited different dynamic characteristics under different stress states. The modal analysis was inexact without prestress. It was difficult to do a multiple stress coupled life test due to limitations of test conditions and cost. Therefore, digital simulation analysis was a feasible approach. In this paper, random vibration fatigue for a typical airborne equipment was studied, which could predict fatigue life of product. The work in this paper provided critical references for engineering design and application, and it could reduce the failure rate effectively and prolong the service life of airborne equipment. This study is not only applicable to pump impeller, but also to the other airborne equipment with complex mechanisms. It is important to provide a generally applicable fatigue life calculation method for engineering.
2. Basic theory
2.1. Frequency domain method
Power spectral density function of acceleration is the main data of random vibration fatigue analysis. There are two ways to get the function, time domain analysis method and frequency domain analysis method. Time domain analysis method needs too much data, therefore we choose the frequency domain method.
The frequency domain analysis method was based on power spectral density, it had the advantages of less computation and it didn’t need cycle counting. So it was favored by many scholars. The estimation of structural fatigue life based on power spectral density function had been applied in industries such as automotive, aerospace, and machine manufacturing.
There were usually two methods to obtain power spectrum density of stress. One was the indirect method, which mainly used the finite element method to obtain the response power spectral density of local stress. Another method was direct method, strain patterns usually occurred to dangerous parts of the structure, the stress power spectral density was obtained by measured method. In this paper, the finite element method was used to obtain the response power spectral density of local stress. A dynamic model of complex structure was established, and the finite element method was used to calculate the stress power spectral density of the dangerous parts of the structure by controlling excitation inputs, applying boundary constraints, and defining structural parameters reasonably.
For a gaussian random process , the average value was 0, and the probability density function could be expressed as:
where, was standard deviation, and it could be expressed as:
where, is unilateral PSD. The random vibration analysis of linear system could be calculated by PSD in frequency domain. When the excitation signal of linear system was Gaussian distribution, its response was also Gaussian distribution. We assumed that under the excitation of random vibration signal , the response of a linear system is . The auto-power spectrum of the system response was:
The cross-power spectrum of response and excitation was:
where, was Hermitian transformation of matrix.
2.2. Palmgren and Miner rule
Palmgren was the first person who proposed the linear hypothesis of damage accumulation of fatigue. He assumed that fatigue damage accumulation is linear. Miner proposed the calculation formula based on the linear hypothesis of damage accumulation, and formed the Palmgren-Miner rule [3].
According to Palmgren and Miner, every loading cycle could cause damage, failures would occur when the cumulative damage was equal to a certain extent D. They believed that fatigue damage can be linearly accumulated, and each stress is independent. The mathematical formulation of cumulative damage fatigue was shown in following Eq. (5):
where, was the number of cycles, applied at the -th stress level , was the fatigue life at , and was the number of stress levels in the block loading spectrum. The ratio of the number of cycles at a given stress level to the fatigue life was called the cycle ratio. The equation above stated that fatigue failure would occur when the sum of the cycle ratios amounted to one.
2.3. Random vibration analysis
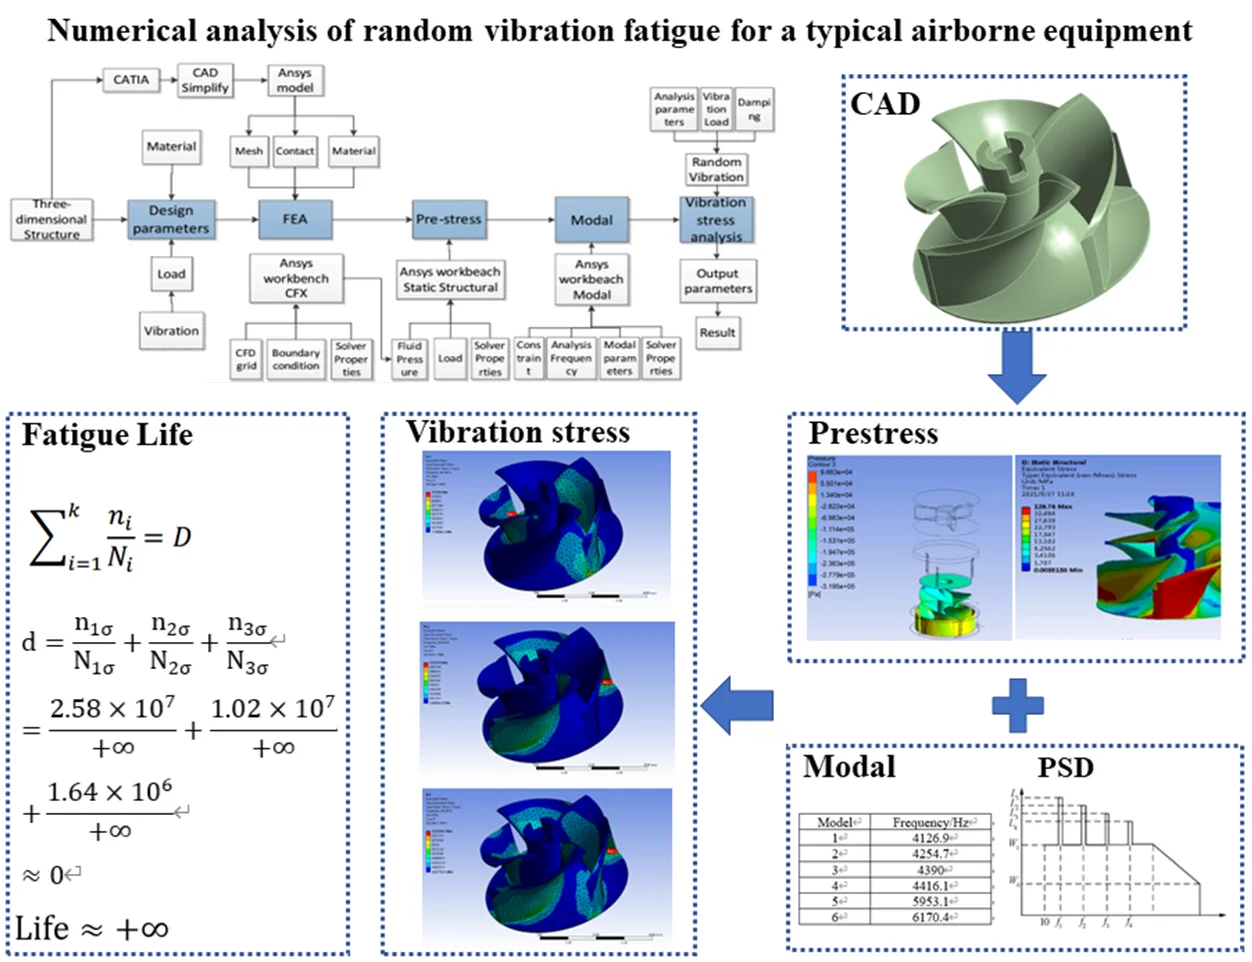
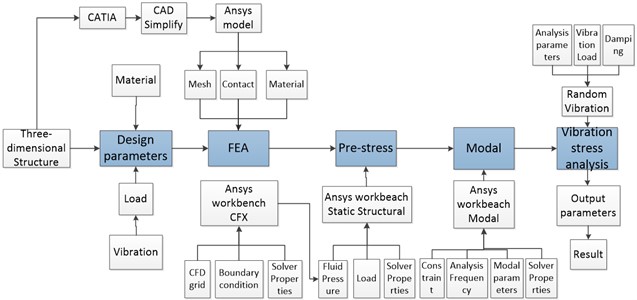
Based on the platform of ANSYS, random vibration analysis with prestress consisted of two steps. First, fluid structure coupling analysis was carried out. Then, the stress was transferred to modal analysis, and the modal with prestress was extracted, and the frequency of the vibration was analyzed. The specific analysis process was shown in Fig. 1.
Fig. 1Simulation and analysis process of random vibration with prestress
2.4. Prestress analysis
This simulation belonged to one-way fluid-structure coupling simulation. The fluid pressure on the impeller was obtained based on the platform of CFX. This fluid pressure was the input load for structural stress calculation. The fluid pressure and stress on the impeller was shown in Fig. 2.
Fig. 2The fluid pressure and stress on the impeller
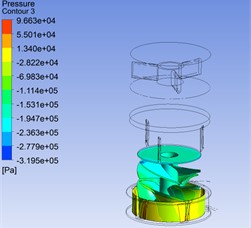
a) The fluid pressure
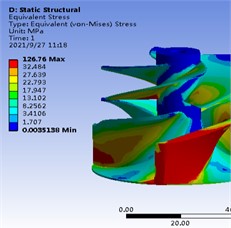
b) Equivalent (von-Mises) stress
2.5. Random vibration analysis
After obtaining the stress distribution of the impeller, the stress and stiffness matrix was imported into the random vibration analysis module. Modality analysis was done on the impeller with the finite element software ANSYS.
Helicopter vibration excitation included sinusoidal excitation and low-frequency random vibration excitation. Sinusoidal excitation could be equivalently converted into narrowband random vibration excitation through the following formula:
where, was auto-power spectrum of the equivalent narrowband random vibration of sinusoidal vibration. B was equivalent narrowband bandwidth, 4. was the peak value of sinusoidal vibration. was quality factor. was the sinusoidal vibration frequency. was equivalence factor, 1.8.
Acceleration power spectral density could be obtained by superposition of broadband random vibration and narrowband random vibration. Through random vibration stress analysis under the random vibration excitation, stress PSD and maximum stress at dangerous parts of the impeller could be obtained.
The modal analysis results were shown in Table 1, and the corresponding mode shapes were shown in Fig. 3. The first three modes results were presented in the figure, 4126.9 Hz, 4234 Hz, 4476 Hz, outside the random vibration frequency range of the helicopter.
Fig. 3The corresponding mode shapes of fuel pump impeller
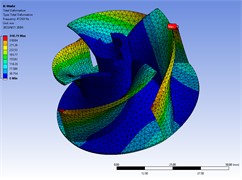
a) The first mode shape
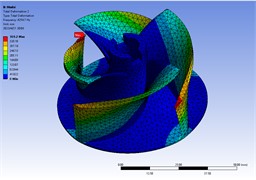
b) The second mode shape
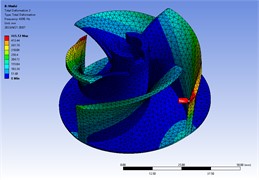
c) The third mode shape
Vibration stress response in , , and directions was shown in Fig. 4. According to the results of random vibration stress analysis, the maximum stress in the direction was 0.1165 MPa, it occurred at blade root. The maximum stress in the direction was 0.1038 MPa, it occurred at blade root. The maximum stress in the direction was 0.024 MPa, it occurred at blade root.
Fig. 4Vibration stress response in X, Y, Z
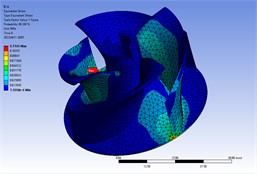
a) direction
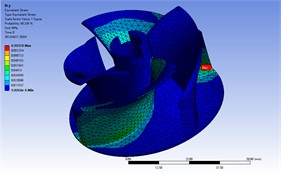
b) direction
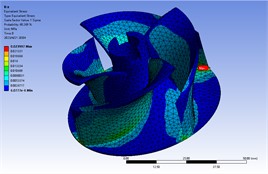
c) direction
Table 1The modal analysis results of fuel pump impeller
Model | Frequency / Hz |
1 | 4126.9 |
2 | 4254.7 |
3 | 4390 |
4 | 4416.1 |
5 | 5953.1 |
6 | 6170.4 |
3. Fatigue life calculation
Fatigue life was obtained based on Gaussian distribution and Palmgren and Miner Rule [4], [5]. On the numerical results of the spectral analysis, the random vibration fatigue analysis of the impeller was obtained by means of the three-interval method base on Gaussian distribution and Miner linear fatigue accumulation law [6].
We assumed that the random excitation to the structure follows a Gaussian distribution. The percentage of time occurred between is 68.3 %, the percentage of time occurred between is 27.1 %, the percentage of time occurred between is 4.33 %. The probability within is 99.73 %, the probability of other stresses occurring is very small. According to the three assumptions of Miner’s Law, all stresses can be divided into three stages, ,,.
According to Steinberg, the damage caused per unit time was:
where, was the number of cycles with stress between. was the number of cycles with stress between , . was the number of cycles with stress between , . , , was the number of cycles in S-N fatigue curve under ,,.
The vibration frequency ranged from 10 Hz to 2000 Hz, the average vibration frequency was 1050 Hz. When the vibration time was 10 hours, 36000 s:
The material of the impeller was 5A02, = 83 MPa [7]. According to the random vibration fatigue life calculation results, random vibrational stress was as follows:
The above values were incorporated into the calculation Eq. (8) for overall damage:
From Eq. (14) we could see that the damage is far below 1. Therefore, the impeller could meet the fatigue requirements under random vibration conditions. The life of impeller met engineering requirement. In the random vibration durability test, the same random vibration load was played in , , directions. The equipment performance is intact after ten hours of vibration in each direction. The result of test indicated that the simulation calculation results are correct.
4. Conclusions
In this paper, the fuel pump impeller was selected as experiment object. The effect of prestress to mode and random vibration fatigue for a typical airborne equipment was studied. The results of the study have been concluded as follows:
1) Based on the platform of ANSYS, random vibration fatigue for a typical airborne equipment under prestress was studied. The simulation results were consistent with the actual random vibration fatigue test.
2) According to Miner linear fatigue accumulation law, random vibration fatigue life was studied based on the three-interval method. damage values and fatigue life at dangerous points was obtained. The product development cycle has been shortened and the testing cost has been saved effectively.
3) The work in this paper provided a method about how to obtain random vibration fatigue life with prestress-structure. The influence of prestress on vibration fatigue life was often overlooked, which sometimes formed fatal effects. The calculation method in this article had been applied in engineering practice and could solve problems effectively, it contained engineers’ years of experience. The calculation method in this article not only can calculate fatigue life, but also was operational. The calculation process is easy and effective, which is required in engineering.
References
-
L. Zhentao, Y. Dehao, and L. Yufeng, “Random vibration analysis of mounting rack for helicopter-borne equipment,” Electro-Mechanical Engineering, Vol. 25, No. 5, pp. 21–24, 2009.
-
Donghong Sun, Guanghai Guo, and Aimin Ling, “Discussion on several issues of helicopter vibration environment and airborne equipment vibration environment test,” Aeronautic Standardization and Quality, Vol. 4, No. 12, pp. 47–49, 2004.
-
M. A. Miner, “Cumulative damage in fatigue,” Journal of Applied Mechanics, Vol. 12, No. 3, pp. A159–A164, Sep. 1945, https://doi.org/10.1115/1.4009458
-
H. Mingjun and Y. Weiping, “Application of power spectrum method in fatigue life estimation of mechanical parts,” China Mechanical Engineering, Vol. 9, No. 11, pp. 16–19, 1998.
-
Z. Biaozhong and G. Sen, “A formula for pre-estimating random fatigue expectation life,” Journal of Zhejiang University, Vol. 4, No. 4, pp. 16–19, 1998.
-
Qunhao Cao, “Random vibration and fatigue strength analysis of bus skeleton for army,” Shanghai Jiao Tong University, 2007.
-
Aeronautical Materials Handbook Editorial Board, “Aeronautical Materials Handbook,” Standards Press of China. 2001, pp. 195–202.
About this article

The authors have not disclosed any funding.
The datasets generated during and/or analyzed during the current study are available from the corresponding author on reasonable request.
The authors declare that they have no conflict of interest.
