Abstract
In this study, the flow field and impeller structure response in the mixed-flow pump are cooperative solved based on the bidirectional synchronization solving method, to study the vibration characteristics of the mixed-flow pump impeller rotor under the fluid-structure interaction. The pressure distributions of blade surface in the mixed-flow pump under different flow rate conditions were compared, and the deformation, equivalent stress distribution and natural vibration frequency of impeller blade under static force load were studied. Meanwhile, the deformation of impeller blade and coupling stress distribution was analyzed based on bidirectional fluid-structure interaction. The results show that the deformation of impeller blade increases from hub to rim, and the maximum deformation occurs at the rim of the blade. The stress distribution of impeller blade in the circumferential direction is symmetrical, and the maximum equivalent stress occurs at the blade outlet edge near the hub. The maximum deformation position and the stress concentration location are basically consistent before and after coupling calculation, but the maximum deformation value increases and the maximum equivalent stress value decreases under the fluid-structure interaction. The influence of water pressure on the strength and frequency of vibration is very limited. With the increase of flow rate, the maximum equivalent stress of impeller decreases and the total deformation increases gradually. The results of this research provide reference basis for the structure design and reliability analysis of the mixed-flow pump.
1. Introduction
Mixed-flow pump is widely used in agricultural irrigation, urban water supply and drainage, mine, large-scale water conservancy projects, ships hydraulic propulsion, the sea water desalination system, circulating water system of thermal power and nuclear power plant, and etc. [1-3]. It plays an important role in the national economic construction. With the increase of hydraulic mechanical capacity and size, people are going to focus on the running stability and reliability problem increasingly. As the impeller of mixed-flow pump is a key component to convert the energy, its reliability and stability has a great influence on the stable operation and pump efficiency [4]. Therefore, it is meaningful to research the vibration characteristics of the large-scale mixed-flow pump impeller.
Along with the development of CFD technology, it is one of the most effective research means to analyze the stress and strain of the key components of rotating mechanical by using the fluid-structure interaction method [5-8]. Chen [9] et al calculated the strength and aerodynamic performance of the centrifugal gas turbine impeller with different geometrical dimensions by using the finite element software and the internal flow field calculation software. Kato [10-12] et al carried out the simulation calculation and prediction of the noise of the centrifugal pump impeller coupling system by using the method of unidirectional fluid-structure interaction. Jiang [13, 14] et al analyzed the influence the deformation of mixed-flow water turbine impeller on the flow field and the vibration characteristics of the shell induced by the fluid with the ANSYS software. But most of the above studies only consider the effect of the fluid on the structure but does not consider the adverse effects of the structure to the flow field. Since the fluid field and the structure field is simple to be solved separately, the interaction between the fluid field and the structure field is not considered, which will lead to the inconsistence of analysis between the numerical and actual flow field. Therefore, it is necessary to consider the bidirectional fluid-structure interaction in the numerical simulation. Huang [15] analyzed the influence of unidirectional and bidirectional coupling method under different transient phase on the stress and strain of the marine centrifugal pump impeller and carried out multiple phase analysis of the rotor mode. Pei [16] et al took the synchronization solution of the flow field and the structural response in the centrifugal pump, and analyzed influence of fluid-structure coupling on the flow field in the centrifugal pump. Benra [17] et al analyzed the vibration displacement and hydraulic exciting of the single vane non-clog centrifugal pump rotor by the one-way coupling and two-way coupling methods, and the hydraulic exciting vibration displacement was measured. However, the most of the aforementioned research object are centrifugal pump, and fluid-structure coupling vibration characteristics of mixed-flow pump under various working conditions have not been seen in the related research reports.
In this paper, the flow field and structure field of the mixed-flow pump impeller are cooperative solved based on the bidirectional alternate fluid-structure interaction method, and the stress and the deformation of the impeller blades, as well as the coupled vibration characteristics of the mixed-flow pump impeller under various working conditions are analyzed. It provides theoretical reference for optimization design and steady operation of mixed-flow pump.
2. Fluid-structure coupling calculation
2.1. Physical model
In this paper, the main parameters of the mixed-flow pump are as follows: flow rate 380 m3/h, head 6 m, rotate speed 1450 r/min, specific speed 480, number of blades 4, number of guide vanes 7. The calculation domain are the whole segments from the inlet segment of pump to the outlet segment of the circular volute chamber. Three-dimensional modeling of inlet segment, impeller, guide blade, circular volute chamber and outlet segment is established respectively using the Pro/Engineer software. 3D models of impeller and guide vane are shown in Fig. 1.
Fig. 1Three-dimensional models
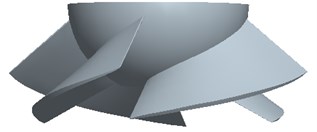
a) Impeller
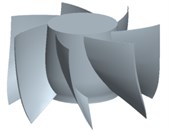
b) Guide vane
2.2. The fluid-structure coupling calculation model and mesh generation
The material the impeller of the mixed-flow pump model is steel, its elasticity modulus is 2.06×10¹¹ Pa, Poisson’s ratio is 0.3, density is 7.85×10³ kg∙m-3, modulus of rigidity is 7.6923×10¹⁰ N∙m-2, yield strength is 2.5×10⁸ N∙m-2.
Considering the tip clearance is very small relatively to the size of the impeller, and in order to ensure the enough number of grid cell in the tip clearance, effective number of nodes and the uniform transition from tip clearance grid to the internal grid of impeller. Mesh of fluid zones are generated by the hexahedral mesh. In the impeller and the guide vane, the J/O topological structure and the H/O topological structure are adopted respectively. The Y-block topological structure is used in the inlet section and the flow passage is formed by the periodic array. The grid is changed uniformly according to the curvature of each wall by controlling the node of each topology line and encryption processing is carried out in the impeller. The total grid number of flow field calculation domain is about 1.1001 million, and the impeller calculation domain unit is about 461100, guide vane calculation domain unit is about 453700, and the total number of nodes is 1.017 million. When the computing grid number is over 1.1001 million, the change of head is very small with the increasing of grid number. The error of calculation is within ±5 %, which conforms to the requirements of the grid independence test. The y+ of the whole calculation domain is less than 100, that is, the grid nodes of the first layer are located in the layer of logarithmic law, and the boundary layer is processed by the standard wall function accordingly. The fluid surfaces with different boundary conditions or contacting with different walls are set as different PART in the process of meshing. So that the different boundary conditions and the coupling interface can be flexibly and correspondingly set in the CFX software. Fluid meshing is shown in Fig. 2.
Fig. 2Mesh in fluid zone
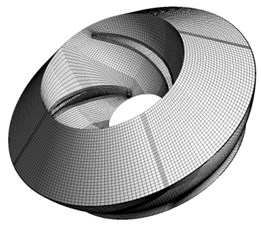
Fig. 3Mesh in structure zones
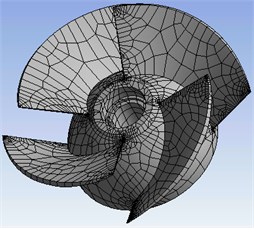
Mesh of structure zones are generated using grid automatic generating function in the Workbench. The dots, lines, surfaces and entities of the rotor model are fully converted into the simulation module of the Workbench with the seamless docking function between ANSYS 14 components and PRO/E software. Meanwhile, the structural finite element mesh is generated using the Automatic meshing mode in Mesh functions, which is shown in Fig. 3. Furthermore, the corresponding coordinates of the two solving domains in the respective solver are to be maintained, so that the relative positions of the two solving domains are the same, to ensure that the fluid interface and the contiguous solid interface correspond with each other correctly.
2.3. The realization process of the fluid-structure interaction calculation
The flow field is calculated in the CFX software and the transient dynamics analysis of the solid structure is carried out in Workbench ANSYS. The results of steady calculation as the initial value of unsteady flow field calculation. The flow field and structural response are individually calculated before the fluid-structure coupling synchronization solving. If the two fields both could obtain the satisfactory results without considering the impact of external field, the fluid-structure coupling synchronization solving can be carried out simultaneously to ensure the calculation go with a swing.
In the structure field solver ANSYS Workbench, the transient dynamic analysis of the structure is used to realize the synchronous solution with the calculation of the unsteady flow field, and the transient dynamic analysis install the corresponding external loads and the fixed constraints. For the structure in the fluid-structure coupling solution, the external load is the action of fluid force on the structure surface, so the surface which the impeller and fluid contact with each other is set as the fluid solid interface and the pressure load produced by the fluid is applied on the structure. The impeller is set to the corresponding fixed support, as shown in Fig. 4 with blue marks. The solving time and step length is set to be the same as these of the unsteady flow field calculation in the CFX software. In the coupling calculation, the fluid calculation grid will deform under the action of fluid-structure interaction, therefore, it needs to be provided by using dynamic mesh technology in the CFX software to solve the problem and set the analog type as transient mode.
In order to get the stable results, the unsteady flow field and the structural response within the time when the impeller rotates 4 times have been calculated. By monitoring, after fluctuation process at the beginning of the calculation, the pressure fluctuations of the unsteady flow field in the impeller and the change of the axis offset of the impeller are basically stable. Therefore, the fourth lap of impeller rotation is chosen to analyze. The instantaneous flow field is solved using the Second Order Backward Euler scheme, and the residual error convergence target of flow field calculation at each time point is 10-4. The relaxation factor of coupling calculation during data transfer process is 0.75, and the convergent standard is 10-3.
Fig. 4A schematic diagram of loads and constraints of the rotor
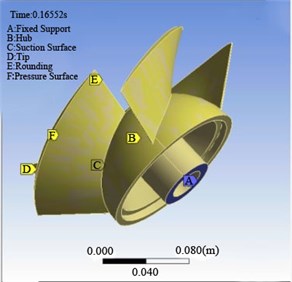
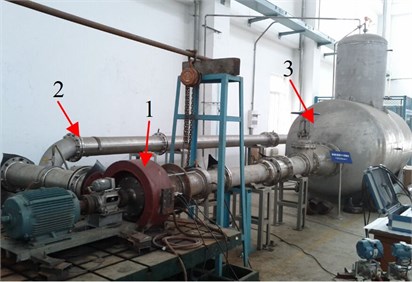
Fig. 5Experimental setup: 1 – mixed-flow pump, 2 – test line, 3 – surge tank
3. Experimental validation of external characteristic
3.1. Testing apparatus
A closed test rig for mixed-flow pump is set up to verify the accuracy of the numerical simulation. The test rig is suitable for diameter 250 mm axial flow pump, mixed-flow pump and model device, as shown in Fig. 5.
In this test, the rotating speed, torque and shaft power of the model pump were measured using ZJ type torque tachometer connected between the rotor and model pump shaft, which was produced by Shanghai-standard Intelligent Terminal Co., Ltd. The pump head was measured using MPM type pressure sensor produced by Mike Company. The pump flow was measured using LWGY type turbine flow-meter produced by Shanghai ZiYiJiu Company. High frequency pressure sensor was installed at the inlet and outlet of pump section, by using 0-24v DC power source for power supply, and the raw output is 0-5 V voltage signal. All the signals were collected automatically and sent to the computer and displayed on the screen. The measurement errors of tachometer and flow meter are ±0.2 % and ±0.5 %, respectively. The accuracy level of pressure gauge is 0.4, and the test rig reaches the level 1 accuracy requirement.
3.2. Test result and analysis
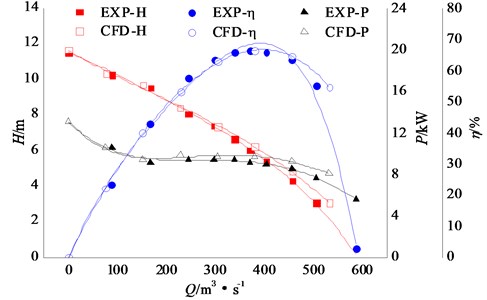
The predicted external characteristic was compared with the experimental external characteristic, as shown in Fig. 6. In this figure, the experimental results named EXP are showed by solid symbol and the numerical simulation results named CFD are showed by the hollow symbol. It can be seen from the figure, the calculated head value is higher than the model test, but the efficiency is lower than the experimental test results slightly. At small flow rate condition, the results of numerical simulation and experiment are very similar. At the highest point of efficiency, the error of head and efficiency is separately 3.29 % and 0.2 %. Due to the local structure difference for pumps used in the comparison of numerical calculation model and test measurement and other effects such as mesh quality, it is inevitable to exist the error of numerical calculation and test measurement. However, as a whole, the head and efficiency of numerical simulation are generally consistent with the performance of test measurement, which indicates that the flow field calculation model can accurately predict its performance. By solving the model, it can accurately obtain the pressure load information of the impeller blade surface, which provides guarantee for the impeller finite element analysis.
Fig. 6Comparison between experimental external characteristics and numerical results
4. Results of the fluid-structure interaction calculation and discussion
In order to analyze the stress and deformation of the impeller comprehensively, the flow fields of mixed-flow pump are calculated under the flow rate conditions of 0.6, 0.8, 1.0, 1.2, and 1.4 respectively. Then, the pressure load on the coupling surface is applied to the impeller structure, and the finite element analysis of impeller is carried out in the ANSYS-Static Structural software.
4.1. Pressure distribution of blade surface under various flow rate conditions
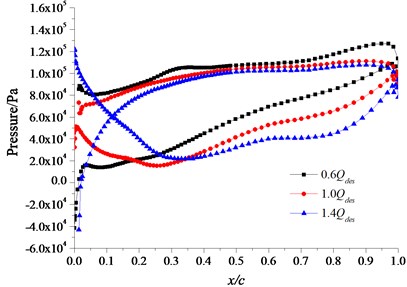
The distribution of the flow field in different flow rate conditions is obtained by the calculation of the three-dimensional flow field. The pressure field under small flow rate (0.6) condition, design flow rate (1.0) condition and large flow rate (1.4) condition are chosen and compared. Fig. 7 is the distribution of pressure along with the chord line of the different section at the location of different blade height. The -coordinate () presents the ratio of the distance which is a distance from a certain location to the blade inlet edge on the blade section and the chord length . In the -coordinate, 0 presents the inlet edge and 1 presents the outlet edge. It can be seen from the figure, on the hub streamline, middle streamline and rim streamline, the fluid pressure on the blade pressure surface at the inlet edge is lowest under small flow rate condition, along the direction of fluid flow, the fluid pressure increases gradually and it reaches the largest value near the blade outlet edge. The fluid pressure on the blade suction surface is lower than the pressure surface, and the lowest pressure comes up at the blade inlet edge. The fluid pressure on the blade pressure surface is lowest at the blade inlet edge under design flow rate, along the direction of fluid flow, the fluid pressure increases gradually and it reaches the largest value at the rim of the blade outlet edge. The lowest fluid pressure on the blade suction surface comes up at the middle section near the blade inlet edge where the pressure difference is bigger. Duo to the regional hydraulic shock and flow separation at the blade inlet and outlet under the large flow rate condition, the pressure surface of the blade inlet section appears local low pressure regions where will easily come up cavitation. The fluid pressure on the pressure surface increases rapidly firstly and then increases slowly along the direction of fluid flow. The lowest fluid pressure on the suction surface appears at the middle section near the blade inlet edge, and the maximum pressure appears at the rim of the blade inlet edge. The inverse pressure difference of pressure surface and suction surface at the blade inlet edge is bigger. With the increase of flow rate, the pressure on the blade surface reduces, and the pressure gradient from the inlet edge to the outlet edge slows down gradually.
Fig. 7Pressure distribution on blade surface at the location of different blade height
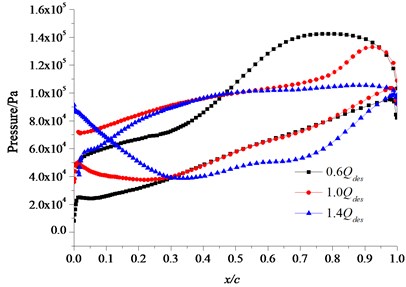
a) Streamline of the hub
b) Streamline of the middle
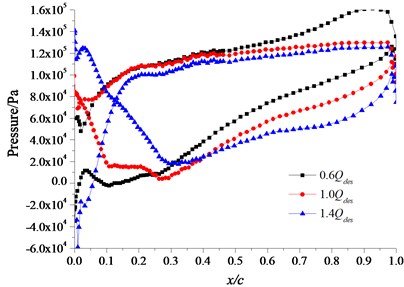
c) Streamline of the rim
4.2. Modal analysis under various working conditions
Fig. 8 shows the static analysis results of the total deformation and equivalent stress of the impeller rotor at the design point based on the steady CFD results, which will be used as the pre-stressing boundary conditions and then conduct the modal analysis. It can be seen from the Fig. 8, the deformation of impeller blade increases from hub to rim and the maximum deformation occur at the blade rim where the maximum deformation is about 0.0611 mm. As the strength for the rest of the impeller is much larger than that of the blade, the deformation is much less than the blade. The stress distribution of impeller blade in the circumferential direction is symmetrical, and the minimum equivalent stress occurs in the region of the rim, but the maximum equivalent stress occurs at the blade outlet edge near the hub. The maximum equivalent stress value is about 22.18 MPa which is far less than the fatigue limit of material and the yield strength. Therefore, the impeller will not take place fatigue damage and plastic deformation. For the traditional strength calculation of impeller makes more simplified, the maximum stress which is calculated with the finite element method is larger than the result of the traditional method.
The results of static analysis under various flow rate conditions are shown in Table 1. Within a certain flow rate range, the maximum stress of the mixed-flow pump impeller decreases and the maximum deformation increases with the increase of flow rate, but the minimum stress decreases firstly and then increases with the increase of the flow rate. When the flow rate is 1.0, the minimum stress of impeller appears smaller value, which indicates that the minimum stress of impeller will appear the smallest value under the optimum operating condition.
Fig. 8A distribution diagram of deformation and equivalent stress on impeller
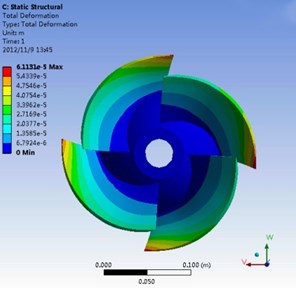
a) Deformation distribution
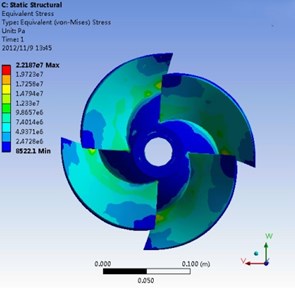
b) Equivalent stress distribution
Table 1Results of static stress under different conditions
Flow rate | Maximum stress / 10 MPa | Minimum stress / 10-2MPa | Maximum deformation / 10-5m | Minimum deformation / 10-5m |
0.6 | 3.3492 | 2.7461 | 5.7482 | 0 |
0.8 | 2.8314 | 2.1638 | 5.9257 | 0 |
1.0 | 2.2187 | 0.8522 | 6.1131 | 0 |
1.2 | 1.7965 | 1.9267 | 6.4563 | 0 |
1.4 | 1.6874 | 3.7511 | 6.8178 | 0 |
The static analysis results are used as the pre-stressing boundary conditions to carry out modal analysis of impeller rotor. As shown in Table 2, it is the modal frequency comparison of first 10 orders in the air and water medium at the design flow rate condition. By comparing the results, there are some differences between natural frequencies of two cases, but the difference is small, and the impact of the blade surface water pressure on the vibration characteristics is very small.
Table 2First 10 orders of nature frequency on impeller rotor in air and water
Order | 1 | 2 | 3 | 4 | 5 | 6 | 7 | 8 | 9 | 10 |
Frequency / Hz (in air) | 1012.7 | 1091.1 | 1092.1 | 1535.8 | 1725.3 | 1796.3 | 1804 | 2017 | 2020.2 | 2066.7 |
Frequency / Hz (in water) | 1012.5 | 1091 | 1091.7 | 1533.8 | 1724.6 | 1795 | 1798.8 | 2016.8 | 2019.7 | 2069.2 |
Table 3Relative difference percentage of natural vibration frequency
Order | Relative difference percentage compared with 1.0 | |
0.6 | 1.4 | |
1 | 0.059 % | 0.010 % |
2 | 0.174 % | 0.073 % |
3 | 0.119 % | 0.064 % |
4 | 0.685 % | 0.228 % |
5 | 0.557 % | 0.284 % |
6 | 0.735 % | 0.496 % |
7 | 0.511 % | 0.028 % |
8 | 0.114 % | 0.010 % |
9 | 0.193 % | 0.010 % |
10 | 0.396 % | 0.058 % |
Table 2 shows that the first order frequency of impeller rotor is 1012.5 Hz, and the blade passing frequency (BPF) is 96.6 Hz. Therefore, the natural vibration frequency of mixed-flow pump is much greater than the blade passing frequency which means the resonance will not occur and the fluid-structure coupling calculation is credible.
Table 3 shows the relative difference percentage of natural vibration frequency under different operating condition. The table shows that the natural vibration frequency under different operating condition has some difference, but the difference is not big. The maximum relative difference percentage is 1.003 %, and the minimum relative difference percentage is 0.01 %.
4.3. Deformation of the impeller blades and dynamic stress distribution under the action of fluid-structure interaction
When material or structure undergoes the long-term and repeated dynamic load, although the dynamic stress value does not surpass the material strength limit, the damage might happen still, namely it is the fatigue fracture. Therefore, it is important to improve the operation stability and reliability of impeller rotor by studying the dynamic stress.
Through the above research, the main distribution area of maximum deformation and concentration point of equivalent stress on the blade can be determined. Therefore, four key points are chosen respectively to study in these regions. Fig. 9 is the sampling point location of the equivalent stress. In the figure, point A is located on the rim of blade inlet edge, point B is the intersection between blade inlet edge and hub, point C is the rim of blade outlet edge, and point D is the intersection between blade outlet edge and hub.
Fig. 9Sampling points position of equivalent stress
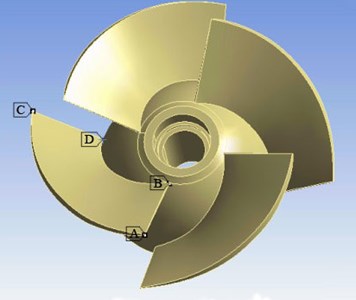
Fig. 10 shows the deformation and equivalent stress distribution on the impeller blade at the design point when 0.16552 s. It can be seen in the Fig. 10(a), the deformation gradient increases obviously from hub to rim in the radial direction and the vibration problem of rim is more outstanding. The maximum deformation occurs at the blade outlet edge on the suction surface near the rim, and the maximum deformation is about 0.0627 mm. The large deformation of the blade rim is mainly because of the magnification of small deformation at the hub, therefore, it is necessary to keep the reasonable clearance between the blade rim and the side wall when designing and checking the pump. As you can see from Fig. 10(b), the maximum equivalent stress occurs at blade outlet edge on the blade suction surface near the hub, where is the most dangerous section of blade and the fatigue fracture is prone to occur, which is basically consistent with the crack location in the engineering practice, and the maximum equivalent stress is about 19.85 MPa. The deformation of the blade is mainly for bending and torsion deformation which caused by the flow field pressure at the impeller outlet edge, and the tensile deformation caused by the centrifugal force is not obvious. It indicates that centrifugal force has little impact on the impeller but the fluid force has greater influence. At the same time, due to the large shock at the blade inlet, when the vibration occurs, the blade inlet edge near the hub could not release stress by elastic deformation. Those will cause stress concentration nearly fulcrum place of blade, namely near the hub, where becomes the distribution area of the maximum equivalent stress. The calculation results of stress concentration can be used as the basis of qualitative analysis, and the stress distribution on the blade surface can be optimized by increasing thickness of blade at hub or taking the circular arc transition way. Comparing the deformation and equivalent stress distribution of impeller with Fig. 7, it can be found that the maximum deformation position and the stress concentration location are basically consistent before and after coupling calculation, but the maximum deformation value increases and the maximum equivalent stress value decreases under the action of fluid-structure interaction. The maximum difference value of deformation is about 0.0016 mm and the maximum difference value of equivalent stress is about 2.33 MPa before and after the coupling calculation. The effect of fluid-structure interaction on the deformation and stress distribution of impeller is obvious, but the maximum equivalent stress is still meeting the requirement of material fatigue limit and yield strength.
Fig. 10A distribution diagram of stress-strain on impeller blade (t= 0.16552 s)
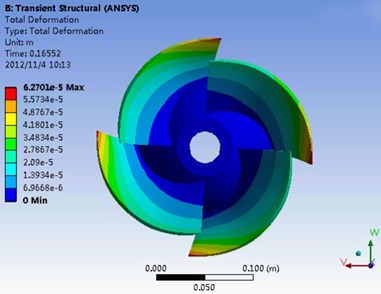
a) Deformation of impeller blade
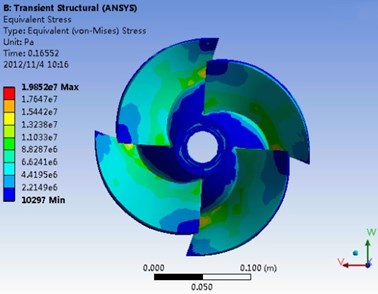
b) Stress distribution of impeller blade
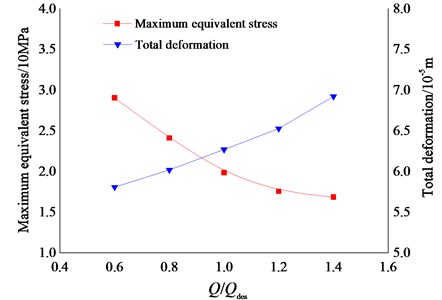
In order to study the effect of flow rate on the maximum equivalent stress and total deformation of impeller, the structural deformation characteristics of the impeller under five different flow conditions (0.6, 0.8, 1.0, 1.2, and 1.4) are calculated respectively. As shown in Fig. 11, it is the maximum equivalent stress curve and total deformation curve of impeller under different flow rate conditions. It can be seen from the figure, the maximum equivalent stress of the impeller decreases gradually with the increase of flow rate, and the total deformation of the impeller increases gradually with the increase of flow rate.
Fig. 11Curve of maximum equivalent stress and total deformation
5. Conclusions
Comparing the external characteristic results of numerical simulation and experiment, it can be found that the error of head and efficiency of the mixed-flow pump is 3.29 % and 0.2 % respectively at the highest efficiency point. The results of two cases are basically consistent which indicates that calculation model of the flow field can accurately predict its performance. The pressure load information on the impeller blade surface is accurately obtained by solving the model, which provides guarantee for the impeller finite element analysis.
The static analysis results show that the maximum deformation occurs at the blade outlet edge on the suction surface near the rim, and the maximum equivalent stress occurs at the blade outlet edge on the blade suction surface near the hub. The maximum stress of the mixed-flow pump decreases with the increase of flow rate, while the maximum deformation increases. The minimum stress of the impeller appears the smallest value under the optimum operating condition, and the flow rate has little impact on the natural vibration frequency.
It can be found that the maximum deformation position and the stress concentration location are basically consistent before and after coupling calculation, but the maximum deformation value increases and the maximum equivalent stress value decreases under the action of fluid-structure interaction. The maximum difference value of deformation is about 0.0016 mm and the maximum difference value of equivalent stress is about 2.33 MPa before and after the coupling calculation. The effect of fluid-structure interaction on the deformation and stress distribution of impeller is obvious, and the coupling results can better reflect the actual mechanical properties of mixed-flow pump impeller.
References
-
Miyabe M., Maeda H., Umeki I., et al. Unstable head flow characteristic generation mechanism of a low specific speed mixed flow pump. Journal of Thermal Science, Vol. 11, Issue 2, 2006, p. 115-120.
-
Kato C., Mukai H., Manabe A. Large-eddy simulation of unsteady flow in a mixed-flow pump. International Journal of Rotating Machinery, Vol. 9, Issue 5, 2003, p. 345-351.
-
Chunlin W., Fei J., Zhiwang W., et al. Pressure fluctuation of unsteady flow in high specific speed mixed flow pump. Journal of Irrigation and Drainage Engineering., Vol. 31, Issue 2, 2013, p. 103-108.
-
Shuangquan Z., Jun W., Shixin Q., et al. Dynamic characteristics analysis of mixed-flow pump runner based on ANSYS. Water Resources and Power, Vol. 28, Issue 10, 2010, p. 107-108.
-
Zhang L., Guo Y., Wang W. FEM simulation of turbulent flow in a turbine blade passage with dynamical fluid-structure interaction. International Journal for Numerical Methods in Fluids, Vol. 61, Issue 12, 2009, p. 1299-1330.
-
Xuelin T., Yuxia J., Fujun W., et al. Turbulent flows in tubular pump and fluid-structure interaction characteristics of impeller. Journal of Irrigation and Drainage Engineering, Vol. 31, Issue 5, 2013, p. 379-383.
-
Yuan S., Xu Y., Zhang J., et al. Numerical analysis for effect of fluid-structure interaction on flow field in screw centrifugal pump. Transactions of the Chinese Society for Agricultural, Vol. 44, Issue 1, 2013, p. 38-42.
-
Weidong S., Yan X., Qihua Z. Structural strength analysis of multistage submersible pump impeller based on fluid-structure interaction. Transactions of the Chinese Society for Agricultural, Vol. 44, Issue 5, 2013, p. 70-73.
-
Chen S., Yang C., Yang C., et al. Investigation of geometrical parameters influence to the stress and aerodynamic performance of centrifugal impeller. Journal of Fluid Mechanics, Vol. 40, Issue 3, 2012, p. 21-26.
-
Kato C., Yamade Y., Wang Hong, et al. Prediction of the noise from a multi-stage centrifugal pump. ASME FEDSM2005, Houston, Texas, PART B, 2005, p. 1273-1280.
-
Chen X., Yuan D., Yang M., et al. Blade stress of the reactor coolant pump of 300 MWe nuclear power plant in china based on fluid-solid coupling method. Journal of Mechanical Engineering, Vol. 46, Issue 4, 2010, p. 111-115.
-
Langlhjem M. A. A numerical study of flow-induced noise in a two-dimensional centrifugal pump, Part I: hydrodynamics. Journal of Fluids and Structures, Vol. 19, Issue 3, 2004, p. 349-368.
-
Weili L., Bin X., Peng L., et al. Influence of runner blade deformation on fluid field of Francis turbine under part load. Chinese Journal of Mechanical Engineering, Vol. 42, Issue 6, 2006, p. 55-59.
-
Jiang Y. Y., Yoshimura S., Imai R., et al. Quantitative evaluation of flow-induced structural vibration and noise in turbomachinery by full-scale weakly coupled simulation. Journal of Fluids and Structures, Vol. 23, Issue 4, 2007, p. 531-544.
-
Huang H., Liu H., Wang Y., et al. Stress-strain and modal analysis on rotor of marine centrifugal pump based on fluid-structure interaction. Transactions from the Chinese Society of Agricultural Engineering, Vol. 30, Issue 15, 2014, p. 98-105.
-
Pei J., Yuan S., Yuan J. Numerical calculation for effect of fluid-structure interaction on flow field in centrifugal pump. Transactions of the Chinese Society for Agricultural, Vol. 40, Issue 12, 2009, p. 107-112.
-
Benra F. K., Dohmen H. J. Comparison of pump impeller orbit curves obtained by measurement and FSI simulation. ASME PVP2007, San Antonio, Texas, 2007.
Cited by
About this article

The work was sponsored by the National Natural Science Foundation of China (No. 51409127, No. 51579118), PAPD, Six Talents Peak Project of Jiangsu Province (No. HYZB-002), Postdoctoral Science Foundation of China (No. 2013M541614) and Postdoctoral Science Foundation of Jiangsu Province (1301062C), Key R&D projects in Jiangsu Province (BE2015119, BE2015001-4), Science and Technology Support Program of Zhenjiang (No. NY2013031), Scientific Research Start Foundation Project of Jiangsu University (No. 13JDG105).
Dr. Wei Li conceived and designed this work that led to the results, acquired data, and played an important role in interpreting the results and organize the manuscript. Mr. Leilei Ji carried out the numerical simulation and draw the figures and tables for this paper. Dr. Weidong Shi designed the experiments and revised the manuscript in detail. Dr. Ling Zhou analyzed the numerical simulation results and draft the original manuscript. Dr. Xiaoping Jiang carried out the experiments and process these results. Mr. Yang Zhang assisted to finish the numerical calculation and experimental study.
