Abstract
This study achieved the goal of guiding bed design and optimization by conducting multi-objective optimization research on the performance of CNC lathe beds. In this study, Morris analysis was first performed on the sensitivity of the parameters, and then out to optimize the parameters using a combination of neural network and genetic algorithm. The loss function value, RMSE error accumulation, recall, sensitivity and specificity of the ASSGA-BP optimization model were better. The maximum error between the predicted and true values of the ASSGA-BP model was 0.28 mm. In the performance study of the multi-objective optimization method based on the Morris sensitivity analysis and the improved GA algorithm, the average MAE value is 0.91 %. The average RMSE value is 0.59 %. Also, the new model is significantly better than the NSGA-II, EGA, and FGA algorithms in terms of both the number of final non-dominated solutions and the speed of reaching convergence. The above results demonstrate that the model proposed in this study has high performance, can achieve faster convergence and has the best stability of the convergence state. The innovation of this article lies in the use of the Morris method to screen and evaluate numerous parameters in order to improve the accuracy of the calculation results and ensure the effectiveness of the optimization results. The improved algorithm overcomes the problems of BP neural network and can effectively improve the generalization performance of the neural network, thereby improving the prediction accuracy of the model.
1. Introduction
CNC lathes are specialized equipment for specific processes and have an irreplaceable position. As a key component of CNC lathes, the performance of the bed directly affects the processing quality of the workpiece. In order to meet the multi-functional requirement of modern industry, the lathe bed often needs to have higher stiffness, strength and better anti-vibration capability, and at the same time, it must ensure that the designed lathe bed is easy to process and manufacture with high cost performance. Obviously, the performance indicators of the bed are conflicting with each other. When optimizing parameters, it is difficult to effectively improve and enhance the comprehensive performance of the bed if only staying at single objective optimization. In addition, how to construct the relationship between the bed structure parameters and various objectives is the key to the above optimization process. This relationship is similar to an unknown black box problem, and there is no clear mathematical expression that can reflect this change pattern. Therefore, the conventional Deterministic algorithm cannot meet the performance optimization of CNC lathe. The improvement of comprehensive performance of CNC lathe requires the optimization of structural parts, which is mainly reflected in two aspects: the replacement of traditional materials and the optimization of lathe structure [1-2]. The optimization of product structure mainly includes the improvement and optimization of form and parameters, and the improvement of form can help researchers break the limits of thinking and carry out innovative design. By using the optimization of parameters, the most influential factors in the production process can be analyzed, so that the best parameters can be selected to obtain the best mathematical model [3-4]. In practical engineering optimization it is also necessary to consider the interaction between multiple objectives, and it is not possible to achieve optimal solutions for all objectives within the given constraints [5]. Therefore, in the solution of multi-objective problems, only a compromise can be made to achieve relative optimality, i.e. multi-objective optimization problems. For solving multi-objective optimization problems, the two main methods include mathematical programming and heuristic intelligent algorithms [6]. The mathematical planning method requires the initial solution to be given and then iterative processing until the algorithm converges. Compared with the mathematical programming method, the heuristic intelligent algorithm has an extremely strong global search capability and is widely applicable in the solution of high-latitude nonlinear problems. Therefore, the heuristic intelligent algorithm is chosen for parameter optimization of the mathematical model in this experiment. In addition, since the performance optimization of CNC lathe involves more parameters, it is also necessary to conduct sensitivity analysis on the parameters and filter out the parameters with greater influence to reduce the difficulty of calculation.
For solving multi-objective optimization problems, the two main methods include mathematical programming as well as heuristic intelligent algorithms [7]. The mathematical programming methods require the initial solution to be given and then iterative processing until the algorithm converges [8]. The mathematical programming methods have high requirements on the initial solution assigned, and the algorithm is prone to fail to achieve convergence or partial convergence during the iterative process [9]. In addition, the mathematical programming methods require that the variables need to satisfy the requirement of continuous differentiability, which leads to the poor generality of the method. Heuristic intelligent algorithms include simulated annealing algorithm, genetic algorithm, ant colony algorithm, particle swarm algorithm, etc. These methods have extremely strong global search capability and have wide applicability in the solution of high-latitude nonlinear problems [10]. In the study of manipulator trajectory optimization, researchers use particle swarm algorithm to optimize the mechanical performance based on the corresponding mathematical model. Experiments have shown that the particle swarm optimization algorithm, after improvement, has improved the ability of automatic optimization search. The method has better convergence and also reduces the time consumption [11]. Kumar et al. [12] used fuzzy mathematics for model building and then used genetic algorithm for parameter optimization of this mathematical model. After the parameter optimization by genetic algorithm, a new prediction model was obtained experimentally. In the evaluation and prediction of the parameter-target relationship, the predicted values of this model differed less from the experimental values, indicating that the newly established model has a good predictive performance. The combination of different heuristic algorithms with each other is also advantageous in solving multi-objective optimization problems. Xue [13] applied the ant colony algorithm and genetic algorithm to the multi-objective optimization problem of wireless power transmission for energy transmission and information transmission, and the method can optimize both objectives simultaneously with high efficiency and information transmission capability.
The application of CNC lathe improves the quality and efficiency of product processing, and reasonable parameters are important factors affecting the effectiveness of CNC lathe application [14]. In the solution of engineering problems, there is an unknown black box problem between structural parameters and performance indexes [15]. The approximation model can obtain the expression of the implicit system input and system output's connection based on the known sample information using mathematical methods. The approximation model can be used to mathematically solve the black box problem between structural parameters and performance indicators, and is used to predict the unknown relationship between the two. The approximation model is the main method to realize the optimization of CNC lathe parts, and the commonly used approximation models include neural network model, polynomial response surface model, support vector regression model and Kringing model. The combination of approximate models and heuristic intelligence algorithms provides a good idea for solving multi-objective optimization problems. Mukherjee and Diwekar [16] first used support vector machines to build a mathematical model, and then combined with ant colony algorithms to optimize the parameters of this mathematical model. In this way, the multi-objective optimization problem in natural gas processing is solved. Intelligent algorithms improve the problem solving capability and optimize the resource allocation in solving multi-objective problems. Researchers combine multimodal multi-objective optimization with deep learning techniques to rationalize the space allocation to improve this model's area search capability and find optimal solution better [17]. In the field information analysis of drilling operations, some scholars have used support vector machines combined with simulated annealing algorithms for multi-objective optimization model building. This model has better classification function and stronger problem solving ability in solving multi-objective optimization problems [18].
Considering that the CNC lathe has a complex structure, the lathe is affected by each parameter to a different extent. In the subsequent multi-objective parameter optimization, to improve the accuracy of the calculation results and ensure the validity of the optimization results, it is also necessary to screen and evaluate numerous parameters. The sensitivity of the parameters is evaluated before the optimization of the multi-objective parameters, and the impact of different parameters on the overall objective is analyzed according to the results of the sensitivity evaluation. We need to keep the parameters that have a greater impact on the overall target and eliminate the parameters that have a smaller impact. The methods of sensitivity analysis mainly include local analysis and global analysis [19]. Local analysis is the estimation of a single influence factor while ensuring that other influencing factors remain unchanged. The Morris method in global analysis is able to perform global sensitivity analysis and comparison with the least amount of computation. Therefore, the Morris method is chosen as the evaluation of parameter sensitivity in CNC lathe performance optimization in this study. Among the heuristic intelligent algorithms, genetic algorithm has the features of easy convergence, simple structure, and better robustness. Also, the method can be used for the maintenance of species diversity and finally obtain a uniformly distributed solution set. It is also combined with neural network to solve the multi-objective optimization problem to improve the accuracy of CNC lathe performance optimization and prediction. The innovation of this article lies in the use of the Morris method to screen and evaluate numerous parameters in order to improve the accuracy of the calculation results and ensure the effectiveness of the optimization results. Before optimizing multi-objective parameters, the sensitivity of the parameters was evaluated, and the impact of different parameters on the overall objective was analyzed based on the results of the sensitivity evaluation. In response to the shortcomings of traditional genetic algorithms, an accelerated search strategy based genetic algorithm (ASSGA) was proposed in the experiment. This algorithm improves the genetic operator of traditional genetic algorithms and introduces a local search algorithm. And the improved genetic algorithm is applied to the training of BP neural network, which can effectively overcome the problem of BP neural network easily falling into local extreme points and improve the generalization performance of the neural network, thereby improving the prediction accuracy of the model. This experiment achieved the goal of guiding bed design and optimization by conducting multi-objective optimization research on the performance of CNC lathe beds.
2. Research on CNC lathe performance optimization method
2.1. Research on the optimization method of CNC lathe performance based on Morris sensitivity analysis
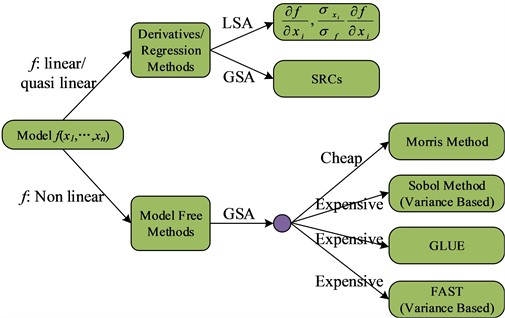
To solve multi-objective optimization problems, the parameters need to be optimized. However, the number of parameters involved in the engineering field increases the difficulty of calculation. Therefore, a sensitivity analysis of parameters is also needed before the actual parameter optimization to filter out the parameters with a greater degree of influence. The sensitivity analysis method of parameters mainly includes local analysis and global analysis. Local analysis is to estimate a single influencing factor when other influencing factors are guaranteed to be unchanged. The global analysis mainly includes the Sobol method, the Morris method, etc. [20]. The sensitivity assessment methods are classified according to the characteristics of the model, and Fig. 1 shows the classification results.
Among the above classification of sensitivity assessment methods, the Sobol method is more widely used, but the method has a high computational cost and is difficult to implement when there are more parameters. In mathematical models with more parameters, the Morris method is able to perform global sensitivity analysis and comparison with the least amount of computation. Therefore, the Morris method is chosen as the evaluation of parameter sensitivity in CNC lathe performance optimization in this study. Assuming that the system contains parameters, the sensitivity of the parameters can be judged by analyzing the effect of the parameters on the results through Eq. (1):
Fig. 1Sensitivity analysis method
The Morris method requires mapping the parameters to the interval [0, 1], while random sampling is performed from . Where denotes the level of random sampling and denotes the amount of variation that has been determined in advance. The next step is to construct the random sampling matrix . While constructing the matrix , the parameters mapped in the interval [0, 1] are remapped to the initial range. The sample data are then obtained based on the random sampling matrix to solve for the sensitivity values of the parameters. In the construction of the random sampling matrix , it is assumed that is a matrix of order , and –1 or 1 is randomly selected as the diagonal element. denotes a matrix with all diagonal elements of order 1, and its size is order. B denotes a triangular matrix with all diagonal elements of order 1, and its size is order, see Eq. (2):
Also, a matrix of size of order is constructed in Eq. (3):
Assuming that the base value of the parameter is represented as , which is taken in . Also, a matrix of size of order is constructed in Eq. (4):
It is supposed that the random permutation matrix of order is denoted as . There is only one element 1 in both rows and columns of this matrix. And the rest of the elements are 0. Then the representation of the random sampling matrix is given in Eq. (5):
represents a matrix of size of order and all elements are 1 in Eq. (5). Since the elements of the matrices , and are independent, mutually exclusive and random values, is also a random matrix. In matrix, each row represents a set of input parameters, while only one parameter is changing in two adjacent rows. The basic influence of each parameter can be calculated by combining Eq. (1). To improve the accuracy and credibility of the calculation results, the above calculation is repeated times. The Morris method defines two sensitivity indicators, and , to represent the influence of the input variables on the output. denotes the mean value, which is used to estimate the overall impact on the output with the test variables, and is calculated in Eq. (6):
where denotes the number of sampling times in Eq. (6) and is the meta-effect of variable at the th sampling. denotes the standard deviation, which is used to estimate the effect of nonlinearity with the test variable on the output, as well as the effect caused by the interaction between the input variable and other output variables, which is calculated in Eq. (7):
A higher value of indicates a greater influence of the parameter on the system, and a higher value of indicates a greater interaction between the parameter and other parameters.
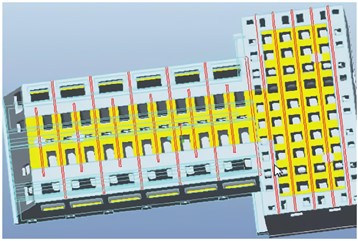
In the experiment, the effects of 17 parameters such as the width of the main rib plate, the thickness of the main rib plate, the thickness of the horizontal partition plate, and the thickness of the horizontal partition plate on the performance of the CNC lathe were tested. In the Morris method, the value of parameter is crucial. If it is too small, it is difficult to ensure the credibility of the results, and if it is too small, it will increase the computational workload. Morris suggests taking an even number for p to ensure more uniform values for each parameter. The experiment shows that 4 and 10 can basically meet the analysis requirements. The larger the value, the more sensitive the parameter is to the bed, and the σ value reflects the interaction between the parameter and other parameters. Through research, it can also be found that overall, the larger the value, the higher the corresponding σ value. Through analysis, it can be seen that four structural parameters have a relatively small impact on the performance indicators of the bed. Therefore, removing these 4 parameters, only the remaining 13 structural parameters were sampled to prepare for the subsequent construction of an approximate model of the bed and optimization of bed parameters. In actual state, the bottom of the bed is fixed to the foundation with 8 bolts. Therefore, constraints are added to the bolts on the bottom surface of the bed, with zero degrees of freedom in all directions.
2.2. Research on CNC lathe performance optimization method based on improved GA algorithm
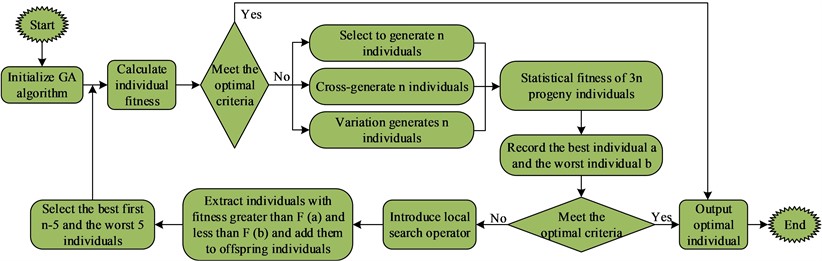
The approximation models can be used for the representation of implicit relationships in black-box problems based on known sample information. The use of approximation models enables the solution of complex problems in engineering problems, which shortens the product development cycle and can improve the efficiency. Due to the high complexity of CNC lathe structure, multi-objective optimization of nonlinear relationships needs to be realized. In the study of CNC lathe performance, a lot of time needs to be consumed for calculation every time. In the actual production process in the engineering field, intelligent algorithms are widely applied in the parameter optimization of machine tools. Genetic algorithm is widely used in the solution of multi-objective problems, but the current GA algorithm still needs to be optimized to improve the local search capability and solve the problem of premature optimization results. In this experiment, we propose to improve the traditional GA algorithm by using accelerated search strategy, namely Accelerated Search Strategy Genetic Algorithm (ASSGA). The training process of this method includes initial parent individual generation, individual evaluation, selection operation of parent individuals, segmented point crossing operation, two selections of random multipoint variants, local search operator, iteration, and introduction of accelerated search operator in Fig. 2.
Fig. 2Training flow chart of ASSGA algorithm
The ASSGA algorithm is able to select elite individual migration operators to achieve improved global superiority seeking ability. The method is able to increase the convergence speed of the algorithm while ensuring the superiority of the species. In the ASSGA algorithm, the worst genetic individuals obtained after selection are used in the mutation operation. By doing so, the diversity of the population can be improved, while enhancing the algorithm's global search ability and reducing the probability of premature occurrence. In addition, segmented point taking can ensure that the exchange of individual element information can occur evenly, and the introduction of local operators can enhance the local search ability of ASSGA algorithm. BP neural network can be well used for the prediction of production quality index parameters in the engineering field, but the traditional BP algorithm tends to fall into local optimum and has the defects of long model training time and slow convergence speed. Therefore, in this study, the combination of ASSGA algorithm and BP algorithm is used to obtain the model ASSGA-BP to improve model parameter prediction's accuracy. The specific steps of the combination of ASSGA algorithm and BP algorithm include the following points. Firstly, training samples' number is set as , including training samples and in Eq. (8-9):
In the unimproved GA algorithm combined with the BP algorithm, the fitness function used is the BP method, and the error is obtained by training in Eqs. (10-11):
Assuming that the adaptation function of the ASSGA algorithm combined with the BP algorithm is , it is defined in Eq. (12):
Eq. (13) is the objective formula for ASSGA algorithm combined with the BP algorithm:
In Eq. (13), indicates the connection weights from the input layer to the middle layer, indicates the connection weights from the first hidden layer to the second hidden layer, indicates the connection weights from the hidden layer to the output layer, indicates the threshold value of each neuron in the hidden layer, and indicates each neuron's threshold value in the output layer. denotes algorithm's desired output value and denotes algorithm's actual output value. ASSGA algorithm and BP algorithm's combining process requires the input training sample , which is calculated in Eq. (14):
It is assumed that is the test sample and its sample size is . At the end of the calculation, the combination of parameters can be obtained by substituting into Eq. (15) to test the generalization ability of the algorithm with this parameter:
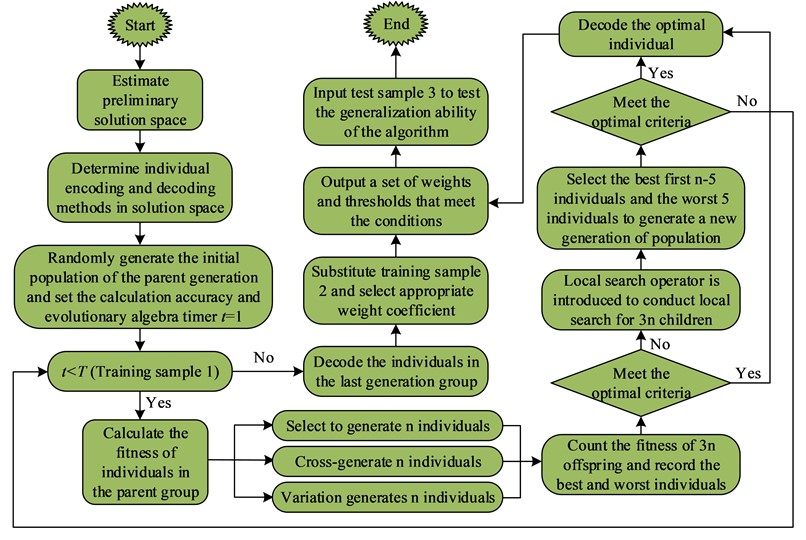
where denotes the error value in Eq. (15). If , this combination of parameters is the optimal solution. Fig. 3 shows the flow of ASSGA algorithm combined with BP algorithm.
In the flowchart in Fig. 3, it mainly includes determining the initial solution space; determining the coding of individuals in the solution space and the decoding method; randomly generating the initial population of parents and setting the calculation accuracy and evolutionary generation timer; calculating the fitness of individuals in the parent population; performing the selection operation, crossover operation and variation operation of individuals in the parent population; counting the fitness of individuals in 3 children and recording the best and worst individuals. The local search operator is introduced to perform local search on the 3 children; the top optimal individuals and the worst 5 individuals are selected to generate the new generation population; the individuals in the last generation population are decoded; the appropriate weight coefficients are selected by substituting into the training sample 2; a set of weights and queues satisfying the conditions are output; finally, the testing sample 3 is input to test the generalization ability of the algorithm. The improved ASSGA algorithm can optimize BP algorithm's weights and thresholds. Since the improved ASSGA algorithm does not need the gradient information required by the traditional method, as long as the function is solvable, then the combined algorithm can operate properly. The improved ASSGA method can improve the generalization ability of BP neural network and solve the problems such as local optimality in the traditional BP algorithm.
In the experiment, based on the traditional BP algorithm, the genetic algorithm was combined with the BP neural network. And the global search performance of the genetic algorithm was used to determine the initial weights and thresholds of the BP neural network, effectively overcoming the local convergence problem of the BP algorithm. Due to the improved genetic algorithm (ASSGA)'s search method, which does not require the gradient information required by traditional BP, it only needs to solve the function under constraints, and the algorithm can operate normally. The improved genetic algorithm has better global search ability, so it has a good effect on optimizing the weights and thresholds of BP neural networks. It can effectively solve the problems existing in traditional BP neural networks and improve the generalization performance of neural networks.
Fig. 3Flow chart of ASSGA algorithm combined with BP algorithm
2.3. Simulation analysis of CNC lathe performance optimization method based on Morris sensitivity analysis and improved GA algorithm
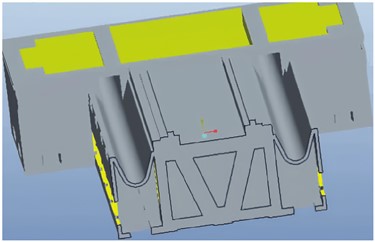
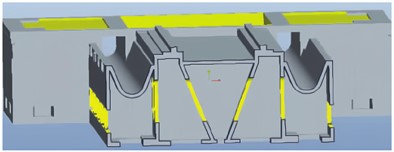
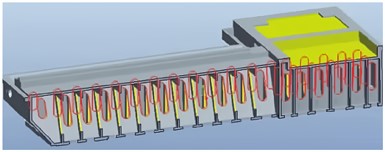
The performance optimization effect of the CNC lathe was demonstrated using the main rib plate of the bed as an example in the experiment. In the experiment, the wall thickness, rib height, and rib thickness of the bed were used as a set of design variables, and the sensitivity method was used to analyze the impact of changes in structural parameters on the dynamic performance of the bed. The sensitivity diagram for height optimization of vertical and triangular bars in the main reinforcement plate is shown in Fig. 4.
In the experiment, parameter optimization was carried out on the arrangement of the rib plates. By changing the value of the rib plate parameters, calculation and analysis were conducted to obtain a sensitivity map of the rib plate parameters on the deformation of the bed, in order to obtain better rib plate structural parameters.
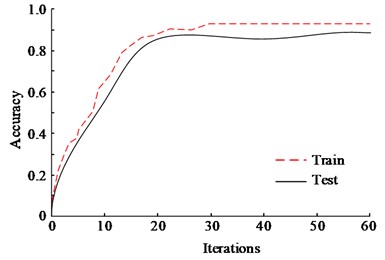
In order to test and evaluate the application of Morris sensitivity analysis with improved GA algorithm in CNC lathe performance study, ASSGA-BP was trained in the training set and the results were tested in the test set. Fig. 5 shows the accuracy and loss function results of the ASSGA-BP model in the training set and the test set. For the accuracy of the model in the training set, its success rate reached 92.3 % with the final loss function value of 0.09 when trained to the 20th batch; the success rate of the model in the test set when trained to the 20th batch reached 89.6 % with the final loss function value of 0.15.This is because the ASSGA-BP can select elite individual transfer operators to achieve the goal of improving global optimization ability. This method ensures the superiority of species while also improving the convergence speed of the algorithm.
Fig. 4Optimization of bed rib plate
a) Vertical ribs of the bed
b) Height of bed vertical reinforcement
c) Triangular ribs of the bed
d) Height of triangular ribs on the bed
Fig. 5Accuracy and loss function results of ASSGA-BP method
a) Accuracy
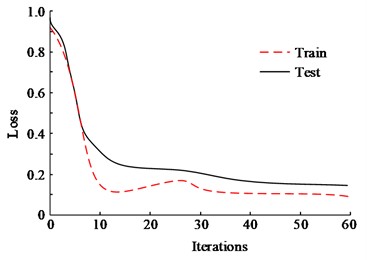
b) Loss
The ASSGA-BP method was compared and analyzed with the traditional GA and BP algorithms, and GA-BP algorithms [21]. The loss function values between the different methods were compared in the experiments, and the results are shown in Fig. 6(a). The loss function value of GA model is 0.25, BP model is 0.25, GA-BP model is 0.24, and ASSGA-BP model is 0.18. The loss function values of GA model, BP model, and GA-BP model are high relative to the loss function value of ASSGA-BP model. The root-mean-square error can be used to describe the dispersion of the samples, and the comparison of algorithm accuracy can be performed in the algorithm performance comparison. The root-mean-square error accumulation was used simultaneously in the experiments for the GA and BP algorithms, and GA-BP algorithms for comparative analysis, and the results are shown in Fig. 6(b). From the Figure, the root mean square error cumulative sum of GA, BP, and GA-BP method are all greater, which proves that the ASSGA-BP is highly accurate [22-23]. This is because in the ASSGA algorithm, the worst genetic individual obtained after selection is used for mutation operations. Through this approach, the diversity of the population can be improved, while enhancing the global search ability of the algorithm and reducing the probability of premature phenomena. In addition, segmented point selection can ensure that the exchange of individual element information can occur evenly, and the introduction of local operators can enhance the local search ability of the ASSGA algorithm.
The experimental validation of the recall rate of different algorithms was performed using datasets 1 to 6, each dataset contains 70 sets of data. Fig. 7(a) shows the recall results of ASSGA-BP and GA-BP. The recall rate of the ASSGA-BP model is significantly higher in four data sets. Although the GA-BP model outperforms the improved RBF network on two datasets, observing the area of the recall images of the two algorithms on the radar plot, it is found that the area of ASSGA-BP is larger, i.e., ASSGA-BP model shows a better recall than the GA-BP model overall. Fig. 7(b) shows the results of the recall rate comparison between the ASSGA-BP model and the GA model, and ASSGA-BP performs better than the GA network on every data set, and the difference between the two recall rates reaches up to 0.40, which indicates that the ASSGA-BP model steadily outperforms the GA network in terms of recall rate.
Fig. 6Cumulative comparison results of loss function values and root mean square error of different methods
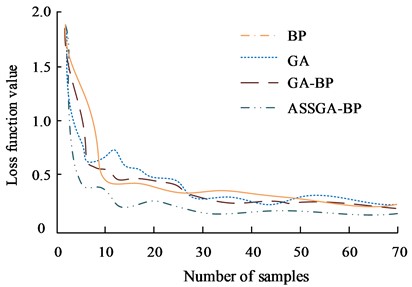
a) Loss function value
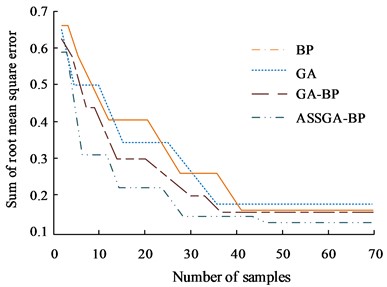
b) Sum of root mean square error
Fig. 7Recall performance of the improved ASSGA-BP algorithm
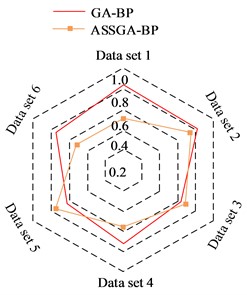
a) Recall results of ASSGA-BP and GA-BP
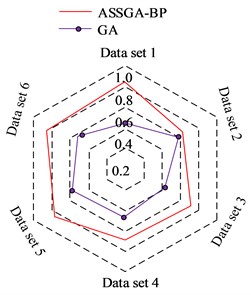
b) Recall results of ASSGA-BP and GA
Fig. 8(a) depicts the results of the specificity and sensitivity of ASSGA-BP and GA-BP model, while Fig. 8(b) shows the results of the improved ASSGA-BP model compared with the GA model. ASSGA-BP's specificity is always higher, with the difference reaching up to 10 %. When the data complexity is low, GA-BP’s specificity is lower. However, as data complexity increases, ASSGA-BP and GA-BP's difference gradually decreases. GA’s sensitivity is lower when data have low complexity. At this time, ASSGA-BP and GA-BP's difference is not obvious. As the data complexity rises, the sensitivity of the ASSGA-BP model decreases significantly less. This is because improving the ASSGA algorithm does not require the gradient information required by traditional methods. As long as the function is solvable, the combined algorithm can operate normally, thus reducing the computational difficulty of the algorithm.
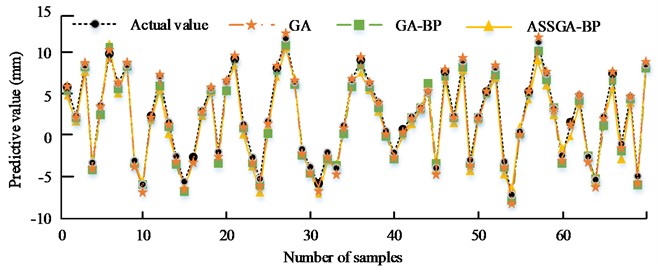
The results of GA model, GA-BP model and ASSGA-BP model for CNC lathe performance prediction are compared in Fig. 9. Compared with the real values, ASSGA-BP’s prediction accuracy model is higher. About the predicted value and real value's highest error, GA is 0.45 mm, GA-BP is 0.37 mm, and ASSGA-BP is 0.28 mm. It indicates that the accuracy of ASSGA-BP model is higher in CNC lathe performance prediction.
Fig. 8Comparison results of sensitivity and specificity of different algorithms
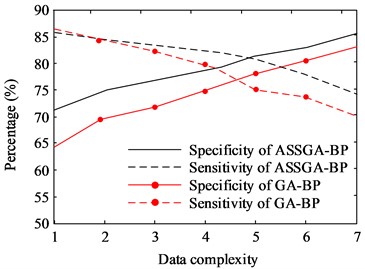
a) Results of ASSGA-BP and GA-BP
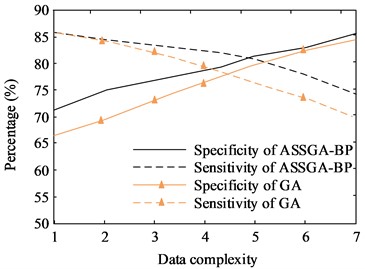
b) Results of ASSGA-BP and GA
Fig. 9Comparison of predictions of different methods
To further verify the performance of the multi-objective optimization method based on Morris sensitivity analysis with improved GA algorithm in the study of CNC lathe performance optimization methods, the model is experimentally compared with three commonly used multi-objective optimization models, FGA, EGA, and NSGA-II [24-26]. The comparison metrics selected in the experiment are MAE and RMSE, and the results are shown in Fig. 10(a) and Fig. 10(b), respectively. From Fig. 10(a), FGA’s highest MAE value is 1.43 %, the lowest MAE is 1.12 %, and the mean MAE is 1.21 % as the number of experiments increases. EGA's highest MAE is 1.39 %, the lowest MAE is 0.92 %, and the mean MAE is 1.12 %. NSGA-II's maximum MAE is 1.57 %, the lowest MAE is 1.20 %, and the mean MAE is 1.43 %. The highest MAE of the proposed model in this experiment is 1.12 %, the lowest MAE is 0.78 %, and the mean MAE is 0.91 %. From Fig. 10(b), as the number of experiments increases, FGA’s highest RMSE is 1.12 %, the lowest RMSE is 0.63 %, and the mean RMSE is 0.81 %. EGA’s highest RMSE is 1.20 %, the lowest RMSE is 0.72 %, and the mean RMSE is 0.83 %. NSGA-II's highest RMSE is 1.24 %, the lowest RMSE is 0.82 %, and the mean RMSE is 0.96 %. The highest RMSE of the proposed model in this experiment is 0.91 %, the lowest RMSE is 0.41 %, and the mean RMSE is 0.59 %. In the MAE and RMSE comparison experiments of different algorithms, the proposed model in this experiment is smaller than the three commonly used multi-objective optimization models, FGA, EGA, and NSGA-II.
In multi-objective optimization, the number of non-dominated solutions can be used to indicate the superiority of a solution. Hypervolume (HV) is a metric used to indicate non-dominated solution’s dispersion and convergence. Among the multi-objective evaluation metrics applied in recent years, HV is one of the more commonly used metrics. If the value of HV is larger, it means that the final solution obtained is better. Fig. 11 shows the comparison results of the number of non-dominated solutions and HV for different methods. The results in Fig. 11(a) show that NSGA-II has the smallest number of non-dominated solutions, and EGA and FGA have the same number of non-dominated solutions. And the model proposed in this experiment is significantly better than the NSGA-II, EGA, and FGA algorithms in terms of both the number of final non-dominated solutions and the speed of reaching convergence. It shows that the method can maintain a high accuracy in solving the problem and also accelerate the convergence speed with better global search capability and local search capability. The HV values of each method are also calculated in Fig. 11(b). The convergence status of NSGA-II has a large volatility and the stability of the method is poor. The convergence status of EGA and FGA is relatively stable. The model proposed in this experiment can achieve faster convergence and the best stability of the convergence state.
Fig. 10Comparison of MAE and RMSE
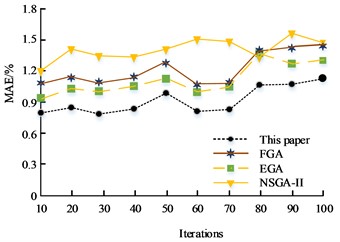
a) MAE / %
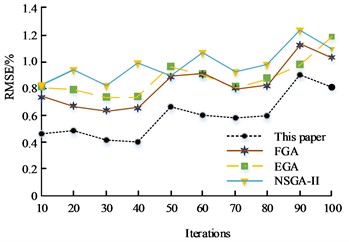
b) RMSE / %
Fig. 11Comparison results of the number of non-dominated solutions and HV for different methods
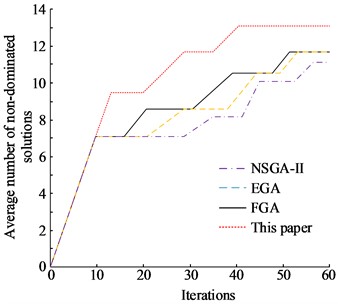
a) Comparison of average number of non-dominated solutions
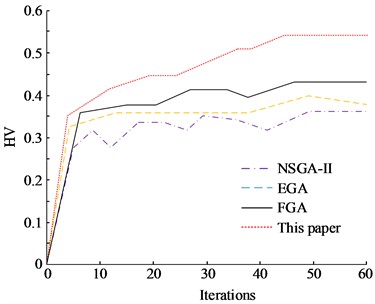
b) Comparison of HV
In the comparison results of the specificity and sensitivity of the algorithm, as the data complexity increases, the decrease in sensitivity of the ASSGA-BP model is significantly smaller than that of the GA model and GA-BP model. In the comparison of the number of non-dominated solutions, the model proposed in this experiment is significantly better than the NSGA-II, EGA, and FGA algorithms in terms of both the final number of non-dominated solutions and the speed of convergence. It shows that the method can maintain high accuracy in solving, and can also accelerate the rate of convergence, and has better global search ability and local search ability. At the same time, this method can demonstrate high accuracy while ensuring high efficiency. These results confirm the superiority of the proposed method in the experiment.
In sensitivity analysis, the experiment mainly analyzed the impact of internal structural parameters of the bed on the quality performance indicators of the bed in Table 1. 17 structural parameters were initially selected in the experiment, and their range of variation was summarized from actual experience and casting process conditions. Based on the Morris sampling method, the parameters 17, 20, and the number of repeated experiments 10 were set, resulting in a total of 180 experimental schemes being generated for sensitivity analysis of each structural parameter.
Table 1Structure parameters and their variation range of the bed
Bed structure parameters | Code | Initial value / mm | Lower limit / mm | Upper limit / mm |
Bottom plate thickness | P1 | 35 | 25 | 46 |
Thickness of cylindrical reinforcement | P2 | 20 | 14 | 26 |
Horizontal edge distance of sand hole | P3 | 25 | 18 | 33 |
Longitudinal edge distance of sand hole | P4 | 30 | 21 | 39 |
Vertical partition height | P5 | 115 | 81 | 150 |
Longitudinal partition thickness | P6 | 30 | 21 | 39 |
Outer diameter of cylindrical reinforcement | P7 | 300 | 210 | 390 |
Height of cylinder bar Centre-to-centre distance bottom | P8 | 338 | 240 | 440 |
Width of main reinforcement plate | P9 | 120 | 84 | 156 |
Thickness of main reinforcement plate | P10 | 20 | 17 | 26 |
Horizontal partition thickness | P11 | 20 | 14 | 26 |
Transverse partition thickness | P12 | 20 | 14 | 26 |
Distance between the center of the cylindrical reinforcement and the rear wall | P13 | 335 | 235 | 435 |
Thickness of rear wall reinforcement | P14 | 20 | 14 | 26 |
Rear wall reinforcement width | P15 | 80 | 55 | 105 |
The height of the reinforcing rib under the rear wall from the bottom surface | P16 | 318 | 195 | 400 |
The height of the reinforcing rib on the rear wall from the bottom surface | P17 | 760 | 700 | 850 |
Fig. 12Sensitivity analysis results of bed structure parameters
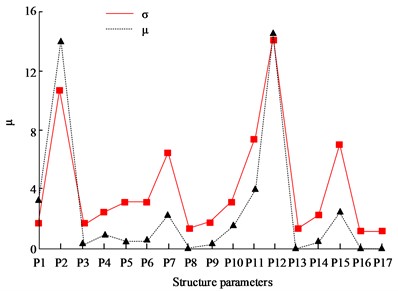
Fig. 12 shows the sensitivity calculation results between 17 bed structure parameters and quality performance indicators. The left and right vertical coordinates in each Figure represent the and corresponding to the structural parameters. Among them, above zero indicates a positive correlation between the parameter and the indicator, while below zero it is the opposite. The larger the value, the more sensitive the parameter is to the bed, and the value reflects the interaction between the parameter and other parameters. Through the graph, it can also be observed that the larger the value, the larger the corresponding value. By analyzing Fig. 12, it can be seen that the top ten structural parameters that have a significant impact on the quality of the bed are P12, P2, P11, P1, P15, P7, P5, P10, P4, and P9. Among them, P8, P13, P6, and P17 have a sensitivity level of 0 to quality. Through comprehensive analysis, it can be seen that the four structural parameters P3, P6, P14, and P16 have a relatively small impact on the performance indicators of the bed. Therefore, removing these 4 parameters, only the remaining 13 structural parameters were sampled to prepare for the subsequent construction of an approximate model of the bed and optimization of bed parameters.
3. Conclusions
The improvement of the comprehensive performance of CNC lathes requires optimization of structural components. This involves solving multi-objective problems. In order to improve the accuracy of multi-objective problem calculation results and ensure the effectiveness of optimization results, the Morris method was used to screen and evaluate numerous parameters in the experiment. Before optimizing multi-objective parameters, evaluate the sensitivity of the parameters and analyze the impact of different parameters on the overall objective based on the results of the sensitivity evaluation. In the experiment, it was found that the four structural parameters had a relatively small impact on the various performance indicators of the bed, and these parameters will be removed in subsequent validation experiments. At the same time, in response to the shortcomings of traditional genetic algorithms, ASSGA was proposed in the experiment. This algorithm improves the genetic operator of traditional genetic algorithms. The improved genetic algorithm effectively improves the generalization performance of the neural network and improves the prediction accuracy of the model. The accuracy of improved ASSGA-BP model in the training set its success rate reached 92.3 % and the final loss function value was 0.09; the success rate of this model in the test set trained to the 20th batch reached 89.6 % and the final loss function value was 0.15. The loss function value, root mean square error accumulation, recall, sensitivity and specificity of the ASSGA-BP model. The predicted value and true value's maximum error of ASSGA-BP is 0.28 mm. About the performance study of multi-objective optimization method based on Morris sensitivity analysis and improved GA algorithm, its highest MAE is 1.12 %, lowest MAE is 0.78 %, and mean MAE is 0.91 %. Its highest RMSE is 0.91 %, lowest RMSE is 0.41 %, and mean RMSE is 0.59 %. Also, the model proposed in this experiment is significantly better than the NSGA-II, EGA, and FGA algorithms in terms of both the number of final non-dominated solutions and the speed of reaching convergence. The above results demonstrate that the model proposed in this experiment has high performance, can achieve faster convergence and has the best stability of the convergence state.
References
-
D. Gu, Y. Zhong, Z. Xu, B. Chen, and Z. Wang, “An importance measure of a CNC lathe considering failure correlations,” Quality and Reliability Engineering International, Vol. 38, No. 3, pp. 1367–1379, Apr. 2022, https://doi.org/10.1002/qre.2963
-
P. Gupta, B. Singh, and Y. Shrivastava, “Grey relational analysis for optimal process variables during turning on CNC lathe,” Materials Today: Proceedings, Vol. 51, No. 1, pp. 228–233, 2022, https://doi.org/10.1016/j.matpr.2021.05.259
-
M. S. Ismail, B. H. T. Baharudin, and K. K. B. Hon, “Analytical model prediction: micro-cutting tool forces with the effect of friction on machining titanium alloy (Ti-6Al-4V),” Zenodo, Vol. 6, No. 8, pp. 177–192, Aug. 2012, https://doi.org/10.5281/zenodo.1058429
-
Z. Y. Nan, J. Li, and M. J. Tan, “Influential factors of inclined fracture induction logging based on numerical simulation and physical experiment,” Exploration Geophysics, Vol. 53, No. 1, pp. 26–37, Jan. 2022, https://doi.org/10.1080/08123985.2021.1885293
-
S. Jia et al., “Multi-objective optimization of CNC turning process parameters considering transient-steady state energy consumption,” Sustainability, Vol. 13, No. 24, p. 13803, Dec. 2021, https://doi.org/10.3390/su132413803
-
H. Ganesan and G. Mohankumar, “Optimization of machining techniques in CNC turning centre using genetic algorithm,” Arabian Journal for Science and Engineering, Vol. 38, No. 6, pp. 1529–1538, Jun. 2013, https://doi.org/10.1007/s13369-013-0539-8
-
M. Sellali et al., “Multi-objective optimization-based health-conscious predictive energy management strategy for fuel cell hybrid electric vehicles,” Energies, Vol. 15, No. 4, p. 1318, Feb. 2022, https://doi.org/10.3390/en15041318
-
A. M. Attia, “A multi-objective robust optimization model for upstream hydrocarbon supply chain,” Alexandria Engineering Journal, Vol. 60, No. 6, pp. 5115–5127, Dec. 2021, https://doi.org/10.1016/j.aej.2021.03.046
-
L. F. Santos, C. B. B. Costa, J. A. Caballero, and M. A. S. S. Ravagnani, “Framework for embedding process simulator in GAMS via kriging surrogate model applied to C3MR natural gas liquefaction optimization,” Chemical Engineering Transactions, Vol. 88, pp. 475–480, Nov. 2021, https://doi.org/10.3303/cet2188079
-
Y. Hou, Y. Zhang, N. Wu, and Q. Zhu, “Constrained multi-objective optimization of short-term crude oil scheduling with dual pipelines and charging tank maintenance requirement,” Information Sciences, Vol. 588, pp. 381–404, Apr. 2022, https://doi.org/10.1016/j.ins.2021.12.067
-
Y. Liu and X. Zhang, “Trajectory optimization for manipulators based on external archives self-searching multi-objective particle swarm optimization,” Proceedings of the Institution of Mechanical Engineers, Part C: Journal of Mechanical Engineering Science, Vol. 236, No. 2, pp. 1188–1201, Jan. 2022, https://doi.org/10.1177/0954406221997486
-
S. Kumar, A. K. Gupta, P. Chandna, G. Bhushan, and A. Kumar, “A novel approach of GEF and GA for the optimization of multi-objective wire EDM process during the machining of DC53 super alloy,” Proceedings of the Institution of Mechanical Engineers, Part E: Journal of Process Mechanical Engineering, Vol. 235, No. 4, pp. 1119–1131, Aug. 2021, https://doi.org/10.1177/0954408921992918
-
H. Qin, B. Zhao, L. Xu, and X. Bai, “Petri-net based multi-objective optimization in multi-UAV aided large-scale wireless power and information transfer networks,” Remote Sensing, Vol. 13, No. 13, p. 2611, Jul. 2021, https://doi.org/10.3390/rs13132611
-
T.-T. Nguyen, Q.-D. Duong, and M. Mia, “Multi-response optimization of the actively driven rotary turning for energy efficiency, carbon emissions, and machining quality,” Proceedings of the Institution of Mechanical Engineers, Part B: Journal of Engineering Manufacture, Vol. 235, No. 13, pp. 2155–2173, Nov. 2021, https://doi.org/10.1177/09544054211001014
-
F. Shahramforouz, S. M. Hejazi, and A. Taherizadeh, “The effect of composite structural parameters on tribo‐mechanical characteristics and thermal conductivity of self‐lubricant composites,” Polymer Composites, Vol. 43, No. 1, pp. 187–202, Jan. 2022, https://doi.org/10.1002/pc.26366
-
R. Mukherjee and U. M. Diwekar, “Multi-objective optimization of the TEG dehydration process for BTEX emission mitigation using machine-learning and metaheuristic algorithms,” ACS Sustainable Chemistry and Engineering, Vol. 9, No. 3, pp. 1213–1228, Jan. 2021, https://doi.org/10.1021/acssuschemeng.0c06951
-
Q.-L. Dang, W. Xu, and Y.-F. Yuan, “A dynamic resource allocation strategy with reinforcement learning for multimodal multi-objective optimization,” Machine Intelligence Research, Vol. 19, No. 2, pp. 138–152, Apr. 2022, https://doi.org/10.1007/s11633-022-1314-7
-
H. Chen, J. Duan, R. Yin, V. V. Ponkratov, and J. W. G. Guerrero, “Prediction of penetration rate by coupled simulated annealing-least square support vector machine (CSA_LSSVM) learning in a hydrocarbon formation based on drilling parameters,” Energy Reports, Vol. 7, pp. 3971–3978, Nov. 2021, https://doi.org/10.1016/j.egyr.2021.06.080
-
H. Soliman, I. A. Khan, and Y. Hussain, “Global sensitivity analysis for fuzzy RDF data,” International Journal of Software Engineering and Knowledge Engineering, Vol. 31, No. 8, pp. 1119–1144, Aug. 2021, https://doi.org/10.1142/s0218194021500352
-
M. Wimmer, L. Raynaud, L. Descamps, L. Berre, and Y. Seity, “Sensitivity analysis of the convective‐scale AROME model to physical and dynamical parameters,” Quarterly Journal of the Royal Meteorological Society, Vol. 148, No. 743, pp. 920–942, Jan. 2022, https://doi.org/10.1002/qj.4239
-
Z. Zhu, X. Xu, L. Li, Y. Dai, and Z. Meng, “A novel GA-BP neural network for wireless diagnosis of rolling bearing,” Journal of Circuits, Systems and Computers, Vol. 31, No. 10, pp. 1–17, Jul. 2022, https://doi.org/10.1142/s0218126622501730
-
R. Özkan and M. S. Genç, “Multi-objective structural optimization of a wind turbine blade using NSGA-II algorithm and FSI,” Aircraft Engineering and Aerospace Technology, Vol. 93, No. 6, pp. 1029–1042, Aug. 2021, https://doi.org/10.1108/aeat-02-2021-0055
-
J. L. J. Pereira, G. A. Oliver, M. B. Francisco, S. S. Cunha, and G. F. Gomes, “A review of multi-objective optimization: Methods and algorithms in mechanical engineering problems,” Archives of Computational Methods in Engineering, Vol. 29, No. 4, pp. 2285–2308, Jun. 2022, https://doi.org/10.1007/s11831-021-09663-x
-
W. Deng et al., “An enhanced fast non-dominated solution sorting genetic algorithm for multi-objective problems,” Information Sciences, Vol. 585, pp. 441–453, Mar. 2022, https://doi.org/10.1016/j.ins.2021.11.052
-
K. Boulanouar, A. Hadjali, and M. Lagha, “Trends summarization of times series: a multi-objective genetic algorithm-based model,” Journal of Smart Environments and Green Computing, Vol. 2, No. 1, pp. 19–33, 2022, https://doi.org/10.20517/jsegc.2021.25
-
A. Babaeinesami, H. Tohidi, P. Ghasemi, F. Goodarzian, and E. B. Tirkolaee, “A closed-loop supply chain configuration considering environmental impacts: a self-adaptive NSGA-II algorithm,” Applied Intelligence, Vol. 52, No. 12, pp. 13478–13496, Sep. 2022, https://doi.org/10.1007/s10489-021-02944-9
About this article

The research is supported by: The “Fourteenth Five Year Plan” Teaching Reform Project of Ordinary Undergraduate Universities in Zhejiang Province (No. jg20220681): The Teaching Reform of Engineering Training Integrated with the Ideological and Political Education of the Curriculum in an All-round way; Zhejiang Provincial Course Ideological and Political Demonstration Course (No. 425): Engineering Training for Mechanical Design, Manufacturing and Automation; The Ministry of Education's Project of Cooperative Education of Production and Learning (No. 202101133002): Cultivation of Laser New Technology Innovation Talents for New Engineering; Zhejiang Educational Science Planning Project (No.: 2021SCG189): Exploration and Practice of Teaching Reform in the Engineering Training Center for Training Innovative Talents for New Engineering Subjects; Higher Education Research Project of Zhejiang Institute of Higher Education (No. KT2022029): Construction of Engineering Training General Course and Practical Course System of Ideological and Political Education; Course Ideological and Political Demonstration Course Construction Project of NingboTech University (No. 7): Engineering Training; The First-class Course Construction Project of NingboTech University (No. NITJG-202066): Engineering Training; Zhejiang Province Online and Offline Hybrid First-class Course (No.: 594): Engineering Training.
The datasets generated during and/or analyzed during the current study are available from the corresponding author on reasonable request.
The authors declare that they have no conflict of interest.
