Abstract
Three models of seat suspension using the negative stiffness structure including steel springs (SS), roller springs (RS), and tuned mass damper (TMD) are proposed and studied to improve the driver's seat ride comfort. Based on the dynamic models of the SS, RS, and TMD, their isolation efficiency and driver’s ride comfort are evaluated via two indexes of the root mean square displacement and acceleration of the seat ( and ) under two excitations of the random road surface and bumpy road surface. The results show that under the random road surface, the and with the seat's RS are reduced by 10.31 % and 20.32 % in comparison with the seat’s SS; whereas the and with the seat's TMD are smaller than that of the seat's RS by 19.15 % and 26.13 %; and the seat’s SS by 27.49 % and 41.15 %, respectively. Besides, the seat's displacement and acceleration responses with the seat’s TMD are also lower than that of both the SS and RS under the bumpy road surface. Therefore, the structure of the TMD should be designed and added to the seat suspension to enhance the driver’s seat ride comfort.
Highlights
- Three models of seat suspension using the negative stiffness structure including steel springs (SS), roller springs (RS), and tuned mass damper (TMD) are proposed and studied to improve the driver's seat ride comfort.
- under the random road surface, the zws and aws with the seat's RS are reduced by 10.31% and 20.32% in comparison with the seat's SS; whereas the zws and aws with the seat's TMD are smaller than that of the seat's RS by 19.15% and 26.13%; and the seat's SS by 27.49% and 41.15%, respectively.
- The seat's displacement and acceleration responses with the seat's TMD are also lower than that of both the SS and RS under the bumpy road surface.
1. Introduction
To improve the driver’s ride quality, the suspension systems of the vehicle and cab were optimized and controlled [1-4]. However, the structure of the semi-active or active suspension systems was very complicated and expensive. Thus, it was limited in application on all vehicles and the driver's ride quality was also limited. To further enhance the driver's ride quality of all the vehicles, based on the isolation efficiency of the negative stiffness structure with its simple structure [5-6], the seat suspension was added by the negative stiffness structure to reduce the vibration of the driver’s seat [7-9]. The study results showed that the driver’s seat acceleration was improved by up to 80 % in comparison with the passive seat suspension in both the time and frequency regions. Besides, the different structures of the negative stiffness structure designed by the steel springs (SS) and roller springs (RS) were researched and evaluated, respectively [6, 8-9]. Furthermore, another negative stiffness structure of the seat suspension using the tuned mass damper (TMD) was also investigated to improve the driver's ride quality [10-12]. The design parameters of the TMD were then also optimized to enhance its isolation efficiency [12]. The studies also showed that the seat suspension equipped with the TMD remarkably improved the driver's ride comfort compared to the traditional seat suspension.
However, in the existing research, the isolation efficiency of the seat suspension equipped with the negative stiffness structure was mainly evaluated via the driver’s seat acceleration, the isolation efficiency of the seat suspension equipped with the negative stiffness structure also needs to be evaluated via the driver's seat displacement. Moreover, the isolation efficiency between the SS, RS, and TMD has also not been evaluated in existing studies. Therefore, three models of seat suspension using the negative stiffness structure designed by the steel springs (SS), roller springs (RS), and tuned mass damper (TMD) are proposed and studied to improve the driver's seat ride comfort. Based on the dynamic models of the SS, RS, and TMD, their isolation efficiency and seat's ride comfort are evaluated via two indexes of the root mean square displacement and acceleration of the seat ( and ) under two excitations of the random and bumpy roads.
2. Design of seat suspension using different models
2.1. Dynamic model of seat suspension
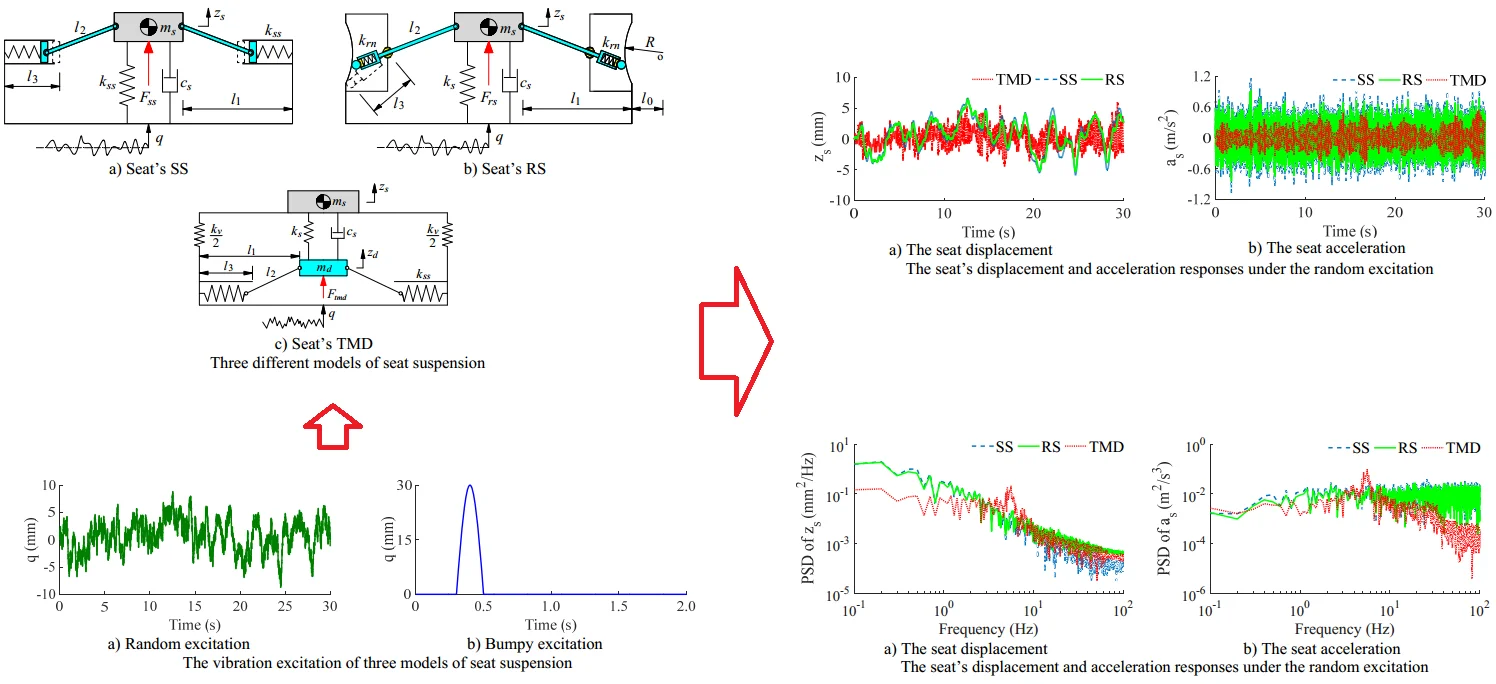
With seat’s SS: Based on the structure of the traditional seat suspension and negative stiffness structure [7-9], the negative stiffness structure is designed by two symmetrical steel springs (SS) with their stiffness parameter . The symmetrical spring and seat are connected via a hard bar . The dynamic model of the seat’s SS is plotted in Fig. 1(a). Where is the driver’s seat mass; is the distance of the seat and well; is the initial length of the SS; and are the stiffness and damping coefficients of the traditional seat suspension; and are the seat’s displacement and vibration excitation of the seat’s SS model.
Fig. 1Three different models of seat suspension
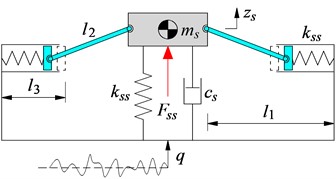
a) Seat’s SS
b) Seat’s RS
c) Seat’s TMD
Under the excitation from the road, the vibration equation of the seat's SS is written [7]:
where .
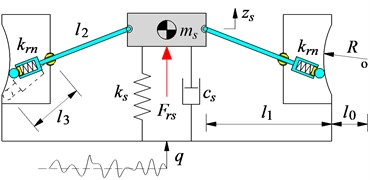
With seat’s RS: Based on the structure of the seat’s SS in Fig. 1(a), its two symmetrical steel springs are then replaced by using two roller springs (RS), as plotted in Fig. 1(b). Where and are the radius of the roller and curved wall; is the stiffness coefficient of the RS.
Under the excitation from the road, the vibration equation of the seat's RS is written by [8]:
where , and .
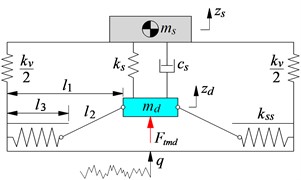
With seat’s TMD: The seat’s TMD is designed by the tuned mass damper connected with the seat via the spring and damping coefficients of and ; the mass connected with the two symmetrical springs via two hard bars ; the seat is connected with the lower base via the spring with its stiffness coefficient . The model of the seat's TMD is plotted in Fig. 1(c). Where and are the displacement of the seat and tuned mass damper; the is vibration excitation.
Under the excitation from the road, the vibration equations of the seat and tuned mass damper are expressed as follows [11-12]:
Based on the vibration equations of the seat’s SS in Eq. (1), the seat’s RS in Eq. (2), and the seat's TMD in Eq. (3), the isolation efficiency of the seat's SS, RS, and TMD is then simulated and evaluated under the vibration excitation of the road surface, respectively.
2.2. Vibration excitation of seat suspension models
With the random excitation: In the actual condition of the vehicle moving on the road surface, the vibration excitation of the vehicle was mainly generated by the random excitation [1-3, 13]. Thus, based on the power spectrum density of the random road in ISO-8608 [13] and the white noise signal , the random vibration of the could be expressed as follows [1]:
where 0.1 m–1 is the reference spatial frequency and is the moving speed of the vehicle.
Assuming that the vehicle moving on the random surface of ISO level B with 64×10–6 m3 at 20 m/s, thus, the excitation q is simulated and plotted in Fig. 2(a).
Fig. 2The vibration excitation of three models of seat suspension
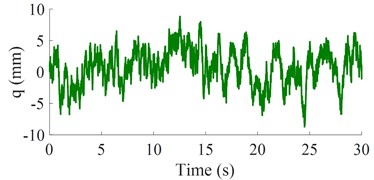
a) Random excitation
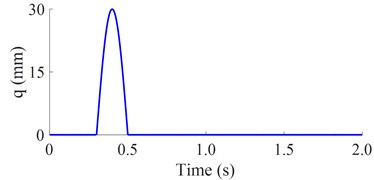
b) Bumpy excitation
With the bumpy excitation: To fully evaluate the isolation efficiency between the SS, RS, and TMD, a bumpy excitation of the road surface is also used for the simulation. Its equation could be described as follows [14]:
where 3 km/h and 0.85 m. Thus, the simulation result of is plotted in Fig. 2(b).
2.3. Evaluation indexes
In the existing studies of the vehicle’s ride comfort, the ride comfort of the driver was mainly evaluated via the index of the root mean square acceleration of the driver’s seat () [1-2, 14-15]. However, the vehicle’s ride comfort was affected by the isolation efficiency of the suspension system, while the isolation efficiency of the suspension system was evaluated via its root mean square displacement (). In this study, to evaluate the isolation efficiency of the seat’s SS, RS, and TMD as well as the driver's ride comfort, two indexes of the and are chosen and expressed as follows [15]:
where and are the seat’s displacement and acceleration responses in the time of .
In order to evaluate the isolation efficiency of the seat’s SS, RS, and TMD, the smaller values of the and are chosen as the objective functions.
3. Results and analysis
Under the same design parameters of the seat's SS, RS, and TMD listed in Table 1 and random excitation of the road surface in Fig. 2(a), three dynamic models of the seat's SS, RS, and TMD in Fig. 1 are then simulated to evaluate their isolation efficiency, respectively. Both the seat’s displacement and acceleration responses and their root mean square values ( and ) are plotted in Figs. 3(a), 3(b), and Table 2, respectively.
Table 1Dynamic parameters of the seat's SS, RS, and TMD
Parameter | Value | Parameter | Value | Parameter | Value |
(kg) | 85 | (N/m) | 25000 | (m) | 0.23 |
(Ns/m) | 250 | (N/m) | 13600 | (m) | 0.17 |
(N/m) | 25000 | (N/m) | 13600 | (m) | 0.14 |
Fig. 3The seat’s displacement and acceleration responses under the random excitation
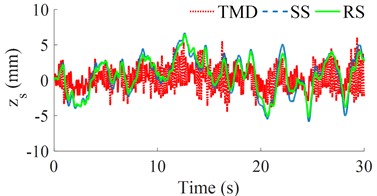
a) The seat displacement
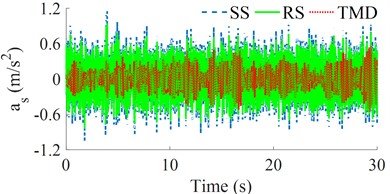
b) The seat acceleration
Table 2The values of zws and aws of the seat’s SS, RS, and TMD
Values | SS | RS | TMD |
(mm) | 2.7834 | 2.4963 | 2.0181 |
(m/s2) | 0.3050 | 0.2430 | 0.1795 |
Figs. 3(a) and 3(b) show that both the seat’s displacement and acceleration responses with the seat’s RS are lower than that of the seat’s SS; while these values with the seat's TMD are the smallest. Based on these displacement and acceleration responses, the calculation results of the and with the seat’s RS are reduced by 10.31 % and 20.32 % in comparison with the seat’s SS; whereas the and with the seat’s TMD are smaller than that of the seat's RS by 19.15 % and 26.13%; and the seat’s SS by 27.49 % and 41.15 %, respectively. The results show that the driver's seat ride comfort and isolation efficiency of the seat’s TMS are better than that of both the seat's SS and RS. This may be due to the influence of the stiffness parameter of and the tuned mass damper of the seat TMD; in which the acts to increase the stiffness of the system thereby reducing the displacement of the seat while the increases the damping force in the system of the TMD [10-12].
To further elucidate the isolation efficiency of the seat’s TMD, the power spectrum density (PSD) values of the seat’s displacement and acceleration in the frequency region are also given and analyzed, as seen in Figs. 4(a) and 4(b). The results of the PSD of and with the seat’s RS are also reduced compared to the seat’s SS, while these results with the seat’s TMD are strongly reduced in comparison with both the seat’s SS and RS, especially the PSD of in Fig. 4(b). Therefore, the seat's TMS improves the driver’s seat ride comfort better than both the seat’s SS and RS in both the time and frequency regions.
Similarly, under the same design parameters of the seat’s SS, RS, and TMD in Table 1 and bumpy excitation of the road surface in Fig. 2(b), three dynamic models of the seat’s SS, RS, and TMD in Fig. 1 are also simulated to assess their isolation efficiency. Both the seat's displacement and acceleration responses are then plotted in Figs. 5(a) and 5(b), respectively.
Fig. 4The seat’s displacement and acceleration responses under the random excitation
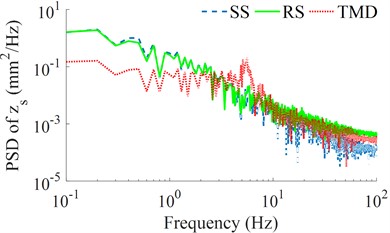
a) The seat displacement
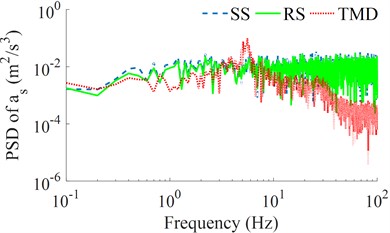
b) The seat acceleration
Fig. 5The seat’s displacement and acceleration responses under the bumpy excitation
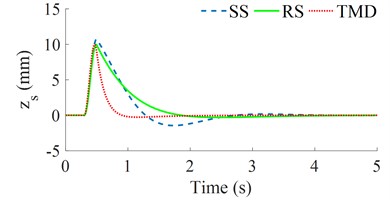
a) The seat displacement
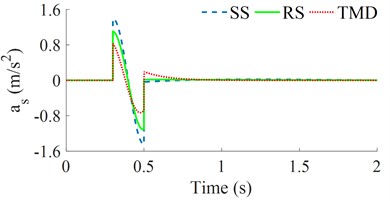
b) The seat acceleration
The simulation results also show that both the seat’s displacement and acceleration responses with the seat’s RS are lower than that of the seat’s SS; while these results with the seat’s TMS are the lowest. This means that the seat's TMS not only improves the driver's ride comfort better than that of both the seat's SS and RS but also is stable under different simulation conditions of the random road surface and bumpy road surface. The existing research of the seat’s SS, RS, and TMD in Refs [6-12] showed that the isolation efficiency of the SS, RS, and TMD is better than that of the seat's passive and semi-active suspension systems. However, the isolation efficiency between the SS, RS, and TMS has not been researched. Based on the results of this study, the TMS should be designed and applied to the seat suspension to enhance the ride quality of the driver.
4. Conclusions
Under the random road surface, the and with the seat’s RS are reduced by 10.31 % and 20.32 % in comparison with the seat’s SS; whereas the and with the seat’s TMD are smaller than that of the seat’s RS by 19.15 % and 26.13 %; and the seat's SS by 27.49 % and 41.15 %, respectively. Besides, the PSD values of the seat’s displacement and acceleration with the seat’s TMD are strongly reduced in comparison with both the seat’s SS and RS, especially the PSD of the seat’s acceleration.
Under the bumpy road surface, the seat’s displacement and acceleration responses with the seat’s TMD are also lower than that of both the SS and RS. Therefore, the structure of the TMD should be designed and added to the seat suspension to enhance the driver's seat ride comfort.
References
-
V. Nguyen, R. Jiao, and J. Zhang, “Control performance of damping and air spring of heavy truck air suspension system with optimal fuzzy control,” SAE International Journal of Vehicle Dynamics, Stability, and NVH, Vol. 4, No. 2, pp. 179–194, Feb. 2020, https://doi.org/10.4271/10-04-02-0013
-
L. Zhang, V. Nguyen, C. Wang, S. Xu, and H. Li, “Review research on isolation systems of the cab and driver’s seat in soil compactors,” SAE International Journal of Vehicle Dynamics, Stability, and NVH, Vol. 7, No. 2, pp. 115–136, Jan. 2023, https://doi.org/10.4271/10-07-02-0008
-
B. Kasemi, A. G. A. Muthalif, M. M. Rashid, and S. Fathima, “Fuzzy-PID controller for semi-active vibration control using magnetorheological fluid damper,” Procedia Engineering, Vol. 41, pp. 1221–1227, 2012, https://doi.org/10.1016/j.proeng.2012.07.304
-
V. Nguyen, J. Zhang, V. Le, and R. Jiao, “Study of fuzzy control for cab’s isolation system of heavy truck,” Vibroengineering Procedia, Vol. 10, pp. 309–314, 2016.
-
J. Jiang, V. Nguyen, S. Xu, and S. Xu, “Isolating efficiency of soil compactor’s seat suspension using optimal negative stiffness structure under various deformable terrains,” SAE International Journal of Vehicle Dynamics, Stability, and NVH, Vol. 6, No. 3, pp. 209–221, Mar. 2022, https://doi.org/10.4271/10-06-03-0014
-
J. Zha, V. Nguyen, B. Su, R. Jiao, and D. Ni, “Performance of the seat suspension system using negative stiffness structure on improving the driver’s ride comfort,” SAE International Journal of Vehicle Dynamics, Stability, and NVH, Vol. 6, No. 2, pp. 135–146, Feb. 2022, https://doi.org/10.4271/10-06-02-0009
-
S. Longjam and K. Shirai, “Numerical investigation of earthquake response reduction effects by negative stiffness connection for adjacent building structures,” Structures, Vol. 38, pp. 672–688, Apr. 2022, https://doi.org/10.1016/j.istruc.2022.01.078
-
S. Zuo, D. Wang, Y. Zhang, and Q. Luo, “Design and testing of a parabolic cam-roller quasi-zero-stiffness vibration isolator,” International Journal of Mechanical Sciences, Vol. 220, p. 107146, Apr. 2022, https://doi.org/10.1016/j.ijmecsci.2022.107146
-
H. Li, J. Li, and K. Bi, “A quasi-active negative stiffness damper for structural vibration control under earthquakes,” Mechanical Systems and Signal Processing, Vol. 173, p. 109071, Jul. 2022, https://doi.org/10.1016/j.ymssp.2022.109071
-
D. Ni et al., “Enhancing the ride comfort of off-road vibratory rollers with seat suspension using optimal quasi-zero stiffness,” The Proceedings of the Institution of Mechanical Engineers, Part C: Journal of Mechanical Engineering Science, Vol. 235, pp. 482–496, 2022.
-
P. Brzeski, T. Kapitaniak, and P. Perlikowski, “Novel type of tuned mass damper with inerter which enables changes of inertance,” Journal of Sound and Vibration, Vol. 349, pp. 56–66, Aug. 2015, https://doi.org/10.1016/j.jsv.2015.03.035
-
N. Attary, M. Symans, and S. Nagarajaiah, “Development of a rotation-based negative stiffness device for seismic protection of structures,” Journal of Vibration and Control, Vol. 23, No. 5, pp. 853–867, Mar. 2017, https://doi.org/10.1177/1077546315585435
-
“ISO 8608. Mechanical vibration – road surface profiles – reporting of measured data,” Geneve, Switzerland, 1995.
-
S. D. Nguyen, Q. H. Nguyen, and S.-B. Choi, “A hybrid clustering based fuzzy structure for vibration control – Part 2: An application to semi-active vehicle seat-suspension system,” Mechanical Systems and Signal Processing, Vol. 56-57, pp. 288–301, May 2015, https://doi.org/10.1016/j.ymssp.2014.10.019
-
“ISO 2631-1. Mechanical vibration and shock – evaluation of human exposure to whole body vibration – Part 1: General requirements,” Geneve, Switzerland, 1997.
About this article

This study is supported by the Open Fund Project of Hubei Key Laboratory of Intelligent Transportation Technology and Device, Hubei Polytechnic University (No. 2021XY103), the Curriculum Ideological and Politics of Hubei Polytechnic University in 2020, and the Research Project of Education and Teaching Reform in Hubei Polytechnic University in 2022 (No. 2022A12).
The datasets generated during and/or analyzed during the current study are available from the corresponding author on reasonable request.
The authors declare that they have no conflict of interest.
