Abstract
This study aimed to model the unevenness and tenacity of ring-spun yarn in a special case in textile engineering using response surface methodology. Yarn number and front roll speed were input variables, while yarn tenacity and unevenness were response/output variables. This study showed that the response surface methodology (RSM) could predict the yarn’s tenacity and unevenness with the yarn coefficient of determination () values of 0.99 and 0.98 and with the error sum of square (SS residual) values 0.00187 and 0.003215, respectively. We also found that an artificial neural network (ANN) could predict the yarn's tenacity and unevenness with the yarn coefficient of determination () values of 0.51 and 0.63 and with the error sum of square (SS residual) values 1.48 and 0.856, respectively. It was concluded that the response surface methodology (RSM) and artificial neural network (ANN) could predict the yarn's tenacity and unevenness. Response surface methodology (RSM) predicts yarn characteristics better than ANN with MIMO (multiple inputs, multiple outputs) modeling. The novelty of this study is that we used RSM and ANN for the first time to obtain the tenacity and unevenness of ring-spun yarn accurately. A simpler approach was employed in this study for predicting tenacity and unevenness using RSM and ANN; however, future research holds the potential for incorporating advanced mathematical models to enhance the prediction. This research suggests that RSM and ANN can be applied to predicting the tenacity and unevenness of ring-spun yarn. The scientific application of this research is that the investigation will benefit practitioners in the textile industry to optimize yarn parameters by ring spinning machines.
Highlights
- Predicting yarn quality using machine learning
- Data Driven Approach
- Comparison of Several Machine Learning models
- Rigorous analysis
1. Introduction
The applications of mathematical physics in various fields have been applied by several researchers, including textile science, from the study of fiber yarn to fabric materials [1]-[6]. Several researchers [7]-[11] stated that modeling and simulation in optimizing the formation of yarn produced from the fiber manufacturing process must be under the needs, types of production machines, and raw materials used in spinning yarns to be applied in improving yarn quality. Herawati, Fauzi, Putra [12], Hunter [13], Neelakantan, and Subramanian [14] have also carried out mechanical modeling of spun yarn using a mathematical and mechanical model approach, but those models are not very good at predicting when compared to experimental results. Lawrence [15], Putra, Rosyid, and Maruto [16], as well as Pavendham and Anbarasan [17], stated that yarn characteristics could generally be seen from the yarn numbering. In textiles, yarn number is closely related to yarn strength. In textile science, there are direct and indirect yarn numbering systems. The direct numbering is in tex units and has the exact dimensions of a material's linear density, while the indirect numbering is Ne or Nm in m/g or hank/lb units.
Putra and Rosyid [18], as well as Smith and Waters [19], stated that the higher the direct yarn number, the higher the tenacity (cN/tex). The yarn produced in the spinning process can be used if the results meet the standard quality criteria that have been set. Modeling is a way to create good textile products by optimising and predicting input parameters, such as machine and material parameters, and output parameters, such as yarn strength (cN) and yarn unevenness [6]. The unevenness of the yarn affects the yarn strength (in units of cN) and in the fabric can affect abrasion or pill resistance, drape, and absorbency. Modeling simplifies a complex element and component to facilitate understanding of the required information, including physical models, image models, or mathematical formulations [16, 19]. Some researchers have combined mechanical and statistical approaches [16, 18, 19]. Mathematical physics and engineering modelling can be done by deriving the system's actual behavior as variables where the relationship between them can be shown in a mathematical equation. Researchers have developed several models to predict and characterize textile material properties [11]-[21]. Generally, two approaches are used to predict the yarn quality: empirical (statistical system) and theoretical (analytic approach). One of the most common models is using statistical methods by surface response methodology and using artificial neural networks (ANN). In several studies, regression analysis is one of the statistical methods widely used in modeling yarn properties, using only the regression method or combination with other methods. Some researchers use regression models to model the mechanical properties of yarns [7, 21]. Although many researchers [11]-[15] have modeled the properties and mechanics of textile materials (i.e., yarns, fibers, and fabrics), modeling the tenacity and unevenness of ring-spun yarns is still rare. The novelty of this study is that we used a new model using RSM and ANN for the first time to obtain the tenacity and unevenness of yarn accurately. This study aims to obtain a numerical formulation and modeling to explain the relationship between yarn number's tenacity and yarn unevenness function (U%) to front roll speed and yarn number through statistical modeling with response surface methodology and artificial neural network. The scientific application of this research is that the investigation will benefit practitioners in the textile industry to optimize yarn parameters by ring spinning machines. In the future, ring spinning machine design with artificial intelligence will increase productivity and reduce the risk of failure in the production process.
2. Research methods
2.1. Material and methods
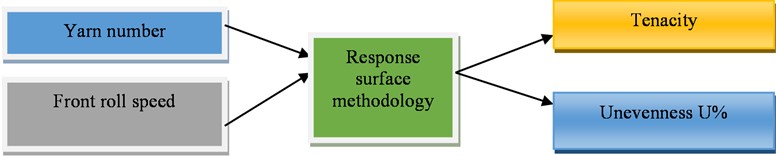
This research was conducted using response surface methodology (RSM), simulation with MATLAB, and validation with data in the textile industry with the output to obtain a model related to yarn tenacity and unevenness (U%) to yarn number and front roll speed (Fig. 1). The model’s derivation and validation of the experimental data results were needed to obtain the R-squared value and square error sum (SS residual).
Fig. 1Response surface methodology scheme
2.2. Model
This study used a neural network architecture developed by several physics and chemistry researchers [19, 20]. This study used yarn number () and front roll speed () as inputs for a model to simulate tenacity and unevenness as the output. Using the output, unevenness, and tenacity were measured. We utilized artificial neural networks to design a model in this study. The tenacity and unevenness of yarn prepared by the ring-spinning machine (as shown in Table 1) were used as learning data for the model. The data were normalized using min-max normalization before using ANNs. During min-max normalization, the original data were transformed linearly. This process obtained all the scaled data in the range [0,1]
Table 1The tenacity and unevenness of yarn prepared by ring spinning machine
Sample | Input | Output | ||
Yarn number (hank/lb) | Front roll speed (rpm) | Tenacity | Unevenness | |
1 | 16 | 280 | 14.79 | 10.04 |
2 | 20 | 279 | 14.45 | 9.46 |
3 | 30 | 223 | 13.45 | 11.39 |
3. Results and discussions
3.1. RSM model for tenacity as a function of yarn number and front roll speed
In this study, the model is derived using RSM to analyze the relationship between tenacity as a function of yarn number and front roll speed as in Eq. (1):
where , , and are certain constants obtained by the optimization method. The parameters used are , the yarn number, , the front roll speed, and , the tenacity. To get Eq. (1), we model as follows:
The difference between the experimental data, , and the model, , is defined as an error, which is as follows:
Eqs. (6) and Eqs. (7) can be used to find the value of a and the model:
Eq. (7) is used to solve the nonlinear Equation and refers to Eq. (1); it can be written as in Eq. (8) to Eq. (12) as follows:
Eq. (12) can be converted into a matrix form as in Eq. (13):
The values of , , and Eq. (12) is obtained through optimization methods, such as in Eq. (14):
In Eq. (11), is ln , is ln , and is ln So that, to get the value of , we use the exponential result of (Eq. (15)):
The values of , , and have been found; hence we can predict the yarn tenacity (Table 2).
Table 2Tenacity prediction results as a function yarn number and front roll speed
Yarn number (hank/lb) | Front Roll speed (rpm) | Modeling of tenacity (cN/tex) |
16 | 280 | 14.7831 |
20 | 279 | 14.4472 |
30 | 223 | 13.4471 |
25 | 317 | 14.3680 |
33 | 346 | 14.1330 |
35 | 374 | 14.1971 |
40 | 403 | 14.1472 |
45 | 431 | 14.1058 |
The coefficient of determination calculation explains the effect of yarn number and front roll speed on tenacity, as shown in Table 3.
The yarn coefficient of determination () is derived as in Eq. (16):
The relationship between yarn number and front roll speed to tenacity can be seen in Eq. (17) and Fig. 2:
Table 3Tenacity determination coefficient data as the function of yarn number and front roll speed
Yarn number (hank/lb) | Front roll speed (rpm) | Modeling of tenacity | Actual tenacity ( | ( | |
16 | 280 | 14.7831 | 14.79 | 0.0018576 | 0.31460 |
20 | 279 | 14.4472 | 14.45 | 0.0000078 | 0.04840 |
30 | 223 | 13.4471 | 13.45 | 0.0000084 | 0.60840 |
25 | 317 | 14.3680 | |||
33 | 346 | 14.1330 | |||
35 | 374 | 14.1971 | |||
40 | 403 | 14.1472 | |||
45 | 431 | 14.1058 | |||
Total | 14,23 | 0.00187 | 0.97140 |
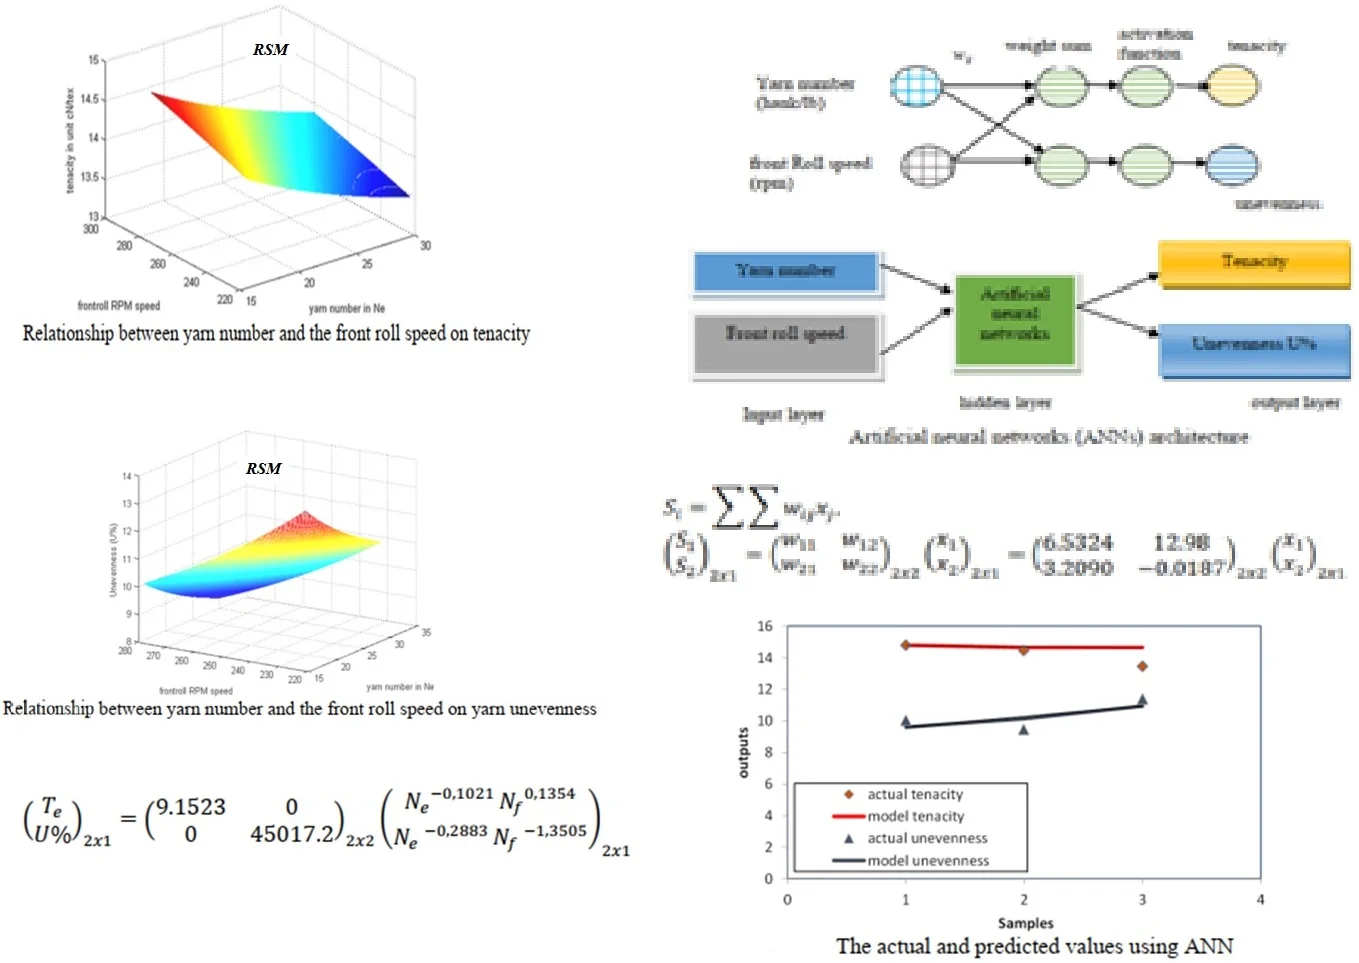
Fig. 2Relationship between yarn number and the front roll speed on tenacity
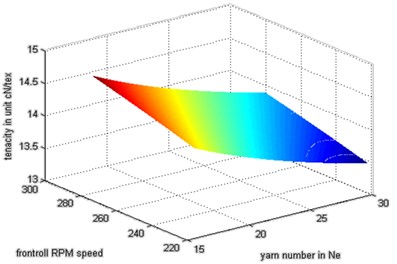
Fig. 2 shows the plot of the predicted values using response surface methodology (RSM) to calculate the tenacity of yarn. The model considered a good relationship between the yarn number and the speed of tenacity, and it showed that the yarn tenacity was closely related to the input parameters. We showed that RSM results quite follow experimental outputs.
3.2. RSM model for unevenness (U%) as a function of yarn number and front roll speed
In this study, we simulate the relationship between yarn unevenness as a function of yarn number and front roll speed using the response surface methodology as in Eq. (18):
where the values of , , and are certain constants obtained through the optimization method; the parameters used are , the yarn number and , the front roll speed, and U%, the yarn unevenness. The nonlinear Equation can be solved in Eq. (19) to Eq. (23):
Eq. (23) can be converted into a matrix form as in Eq. (24):
The values of , and Eq. (24) is obtained through optimization methods to obtain Eqs. (25) and (26):
In Eqs. (21) and (22), is ln , is ln , and is ln So that, to get the value of , we used the exponential result of (Eq. (26)):
The values of , , and have been found; hence we can predict the yarn unevenness (Table 4).
Table 4Predicted results of yarn unevenness as a function of yarn number and front roll speed
Yarn number (hank/lb) | Front roll speed (rpm) | Modeling of % |
16 | 280 | 10.0085 |
20 | 279 | 9.4299 |
30 | 223 | 11.3537 |
25 | 317 | 8.9372 |
33 | 346 | 8.8895 |
35 | 374 | 9.1240 |
40 | 403 | 9.2375 |
45 | 431 | 9.3443 |
The coefficient of determination calculation explains the effect of yarn number and front roll speed on yarn unevenness, as shown in Table 5.
The yarn coefficient of determination () is derived as in Eq. (27):
The relationship between yarn number and front roll speed to tenacity can be seen in Eq. (28) and Fig. 3:
Table 5Tenacity determination coefficient data as the function of yarn number and front roll speed
Yarn number (hank/lb) | Front roll speed (rpm) | Modeling of % | Actual of % ( | ( | |
16 | 280 | 10,0085 | 10.04 | 0.00099225 | 0.31360 |
20 | 279 | 9.4299 | 9.46 | 0.00090601 | 0.04840 |
30 | 223 | 11.3537 | 11.39 | 0.00131769 | 0.60840 |
25 | 317 | 8.9372 | |||
33 | 346 | 8.8895 | |||
35 | 374 | 9.1240 | |||
40 | 403 | 9.2375 | |||
45 | 431 | 9.3443 | |||
Total | 14.23 | 0.003215 | 0.970400 |
Fig. 3Relationship between yarn number and the front roll speed on yarn unevenness
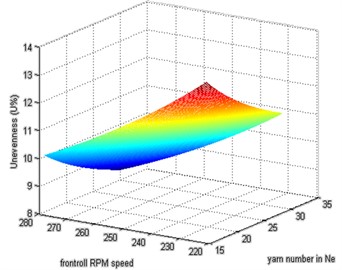
Fig. 3 shows the plot of the predicted values using response surface methodology (RSM) to calculate the yarn unevenness. This Figure shows that RSM results quite follow experimental outputs. The model considered a good relationship between yarn number and the front roll speed on yarn unevenness, and it shows that the yarn unevenness is closely related to the input parameters. Based on Eq. (17) and (28), we make the matrix form as in Eqs. (29-32):
where is the output matrix and is the known constant.
4. Modeling with artificial neural networks (ANNs)
This model considered the artificial neural networks consisting of two input and two output.
The circles and arrows in Fig. 4 represent neurons and signal flow, respectively. The term is the weight matrices. The following formula can calculate the weighted sum: Eqs. (33-34):
Fig. 4Artificial neural networks (ANNs) architecture
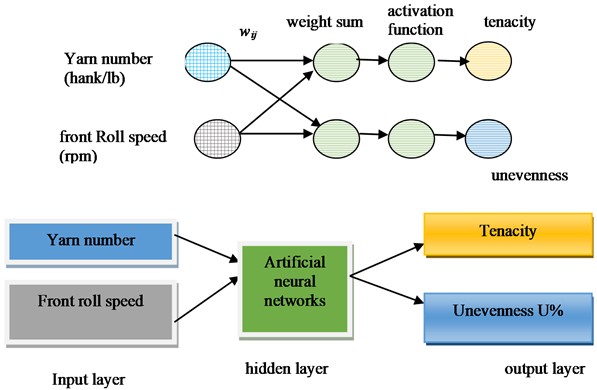
The terms and are the weighted sum and the weight matrices of the layer, respectively. The terms and are input parameters. The neuron enters the weighted sum into the activation function (the sigmoid function) and generates its output as in Eq. (35):
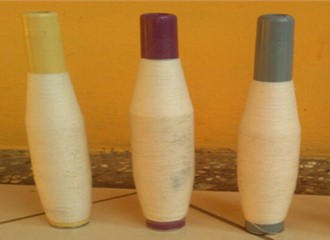
where the terms is the sigmoid function. is the output. Eq. (35) is the predicted value representing the tenacity and unevenness in the normalized value. The results of the predicted values were then denormalized to get the actual value. In this model, training the neural network was to change the weights. Minimizing the sum of the squares of the differences between the target and network output values changed the weights. This study used the perceptron, a fundamental building block of artificial neural networks (ANNs). It is an artificial neuron that takes multiple input signals, applies weights, and combines them using a weighted sum. The perceptron's output is then passed through an activation function to produce the final output. This algorithm updates the network weights in which the performance function decreases quickly. This study used the sigmoid function, a constant learning rate (0.9) in the neural network's architecture, and 50,000 trial methods. Fig. 5 shows the plot of the actual and predicted value using artificial neural networks (ANNs) to calculate the tenacity and unevenness of yarn. We found that an artificial neural network (ANN) could predict the yarn’s tenacity and unevenness with the yarn coefficient of determination () values of 0.51 and 0.63 and with the error sum of square (SS residual) values 1.48 and 0.856, respectively. Fig. 6 shows the three types of yarn samples used to measure the tenacity and unevenness of the ring-spinning yarn.
Fig. 5The actual and predicted values using ANN
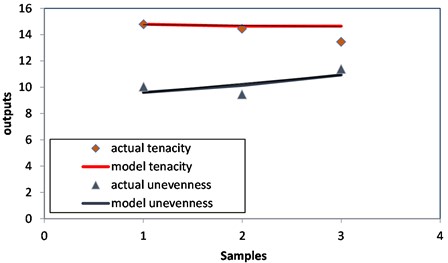
Fig. 6Samples 1 through 3 differed in the number of yarns and speed of the front roll
5. Conclusions
According to this study, the response surface methodology (RSM) could predict the yarn’s tenacity and unevenness with yarn coefficients of determination () of 0.99 and 0.98, and error sums of squares (SS residuals) of 0.00187 and 0.003215, respectively. Additionally, we found that artificial neural networks (ANNs) could predict yarn tenacity and unevenness with yarn coefficient of determination () values of 0.51 and 0.63 and error sum of square (SS residual) values of 1.48 and 0.856. Compared to ANN with MIMO (multiple input multiple outputs) modeling, the response surface methodology (RSM) can predict yarn characteristics well. This research suggests that the RSM can be applied to predicting the tenacity and unevenness of ring-spun yarn. The scientific application of this research is that the investigation will benefit practitioners in the textile industry to optimize yarn parameters by ring spinning machines. In the future, ring spinning machine design with artificial intelligence will increase productivity and reduce the risk of failure in the production process. In this study, we plan to include a noise component in our future work to enhance the model's applicability in real-world scenarios. This will involve studying the effects of different types and levels of noise on the model’s performance and evaluating its robustness in the presence of such noise. By introducing noise into the model, we aim to provide a more realistic representation of the system and better understand how the model responds to noisy inputs. This analysis will provide insights into the model's limitations and help identify strategies for improving its robustness.
References
-
J. G. Hearle, P. Grosberg, and S. Backer, Structural Mechanics of Fibres, Yarns, and Fabrics. New York: Wiley-Interscience, 1969.
-
S. Aggarwal, “A model to estimate the breaking elongation of high twist ring-spun cotton yarns: Part ii: applicability to yarns from mixtures of cotton,” Textile Research Journal, Vol. 59, No. 12, pp. 717–720, 1989.
-
S. K. Aggarwal, “A model to estimate the breaking elongation of high twist ring-spun cotton yarns: Part i: Derivation of the model for yarns from single cotton varieties,” Textile Research Journal, Vol. 59, No. 11, pp. 691–695, 1989.
-
X. Chen, Modeling and Predicting Textile Behavior. New York: CRC Press, 2010.
-
L. B. Deluca, B. Smith, and W. T. Waters, “Analysis of factors influencing ring spun yarn tenacities for a long staple cotton. I. Determining broken fibers in yarns.,” Textile Research Journal, Vol. 60, No. 8, pp. 475–483, Aug. 1990, https://doi.org/10.1177/004051759006000807
-
Y. El Mogahzy and C. H. Chewning, Cotton Fibre to Yarn Manufacturing Technology – Optimizing Cotton Production by Utilizing the Engineered Fibre Selection System. Cary, NC: Cotton Incorporated, 2002.
-
Y. E. El Mogahzy, R. Broughton, and W. K. Lynch, “A statistical approach for determining the technological value of cotton using HVI fiber properties,” Textile Research Journal, Vol. 60, No. 9, pp. 495–500, Sep. 1990, https://doi.org/10.1177/004051759006000901
-
Yehia E. El Mogahzy, “Selecting cotton fiber properties for fitting reliable equations to HVI data,” Textile Research Journal, Vol. 58, No. 7, pp. 392–397, 1988.
-
O. M. A. Hafez, “Yarn-strength prediction of American cotton,” Textile Research Journal, Vol. 48, No. 12, pp. 701–705, 1978.
-
J. Hearle and B. Gupta, “Migration of fibres in yarns part III: a study of migration of staple rayon yarn,” Textile Research Journal, Vol. 35, No. 9, pp. 788–795, 1965.
-
J. Hearle, B. Gupta, and V. Megchant, “Migration of fibres in yarns part I: characterization and idealization of migration behaviour,” Textile Research Journal, Vol. 35, No. 4, pp. 329–334, 1965.
-
R. Herawati and D. V. P. I. Fauzi, “Predicting the actual strength of open-end spun yarn using mechanical model,” Applied Mechanics and Materials, Vol. 780, No. 1, pp. 69–74, Dec. 2018, https://doi.org/10.31227/osf.io/2c9zp
-
L. Hunter, “Prediction of cotton processing performance and yarn properties from HVI test results,” in Soft Computing in Textile Engineering, Corawal, UK: Woodhead publishing, 1988, pp. 229–232.
-
P. Neelakantan Dan T. A. Subramanian, “An attempt to quantify the translation of fiber bundle tenacity into yarn tenacity,” Textile Research Journal, Vol. 46, No. 11, pp. 822–827, 1976.
-
C. A. Lawrence, Fundamentals of Spun Yarn Technology. New York: CRC Press, 2003, https://doi.org/10.1201/9780203009581
-
V. Putra, M. Rosyid, and G. Maruto, “A simulation model of twist influenced by fibre movement inside yarn on solenoid coordinate,” Global Journal of Pure and Applied Mathematics, Vol. 12, No. 1, pp. 405–412, 2016.
-
A. Pavendham, and M. Anbarasan, “Fibre to yarn link,” Textile Research Journal, Vol. 109, No. 2, pp. 40–8, 1998.
-
V. Putra and M. Rosyid, “New theoretical modeling for predicting yarn angle on OE yarn influenced by fiber movement on torus coordinate based on classical mechanics approach,” Indian Journal of Fibre and Textile Research, Vol. 41, No. 1, pp. 359–363, 2017.
-
S. S. Esnaashari, M. Naghibzadeh, M. Adabi, and R. Faridi Majidi, “Evaluation of the effective electrospinning parameters controlling kefiran nanofibers diameter using modelling artificial neural networks,” Nanomedicine Research Journal, Vol. 2, No. 4, pp. 239–249, Dec. 2017, https://doi.org/10.22034/nmrj.2017.04.005
-
R. Faridi‐Majidi, H. Ziyadi, N. Naderi, and A. Amani, “Use of artificial neural networks to determine parameters controlling the nanofibers diameter in electrospinning of nylon‐6,” Journal of Applied Polymer Science, Vol. 124, No. 2, pp. 1589–97, 2012.
-
B. Smith and B. Waters, “Extending applicable ranges of regression equations for yarn strength forecasting,” Textile Research Journal, Vol. 55, No. 12, pp. 713–717, Dec. 1985, https://doi.org/10.1177/004051758505501201
About this article

This work was supported by the research and community service unit (UPPM) Politeknik STTT Bandung and the Ministry of the Industry Republic of Indonesia. The authors are grateful for the support and contributions to this study. We want to thank colleagues who have assisted in data collection in the Industry. Their help and encouragement have been of value to us in pursuing this project.
The datasets generated during and/or analyzed during the current study are available from the corresponding author on reasonable request.
Valentinus Galih Vidia Putra conducted the experiment and the calculations. Valentinus Galih Vidia Putra and Juliany Ningsih Mohamad wrote and revised the manuscript.
The authors declare that they have no conflict of interest.
