Abstract
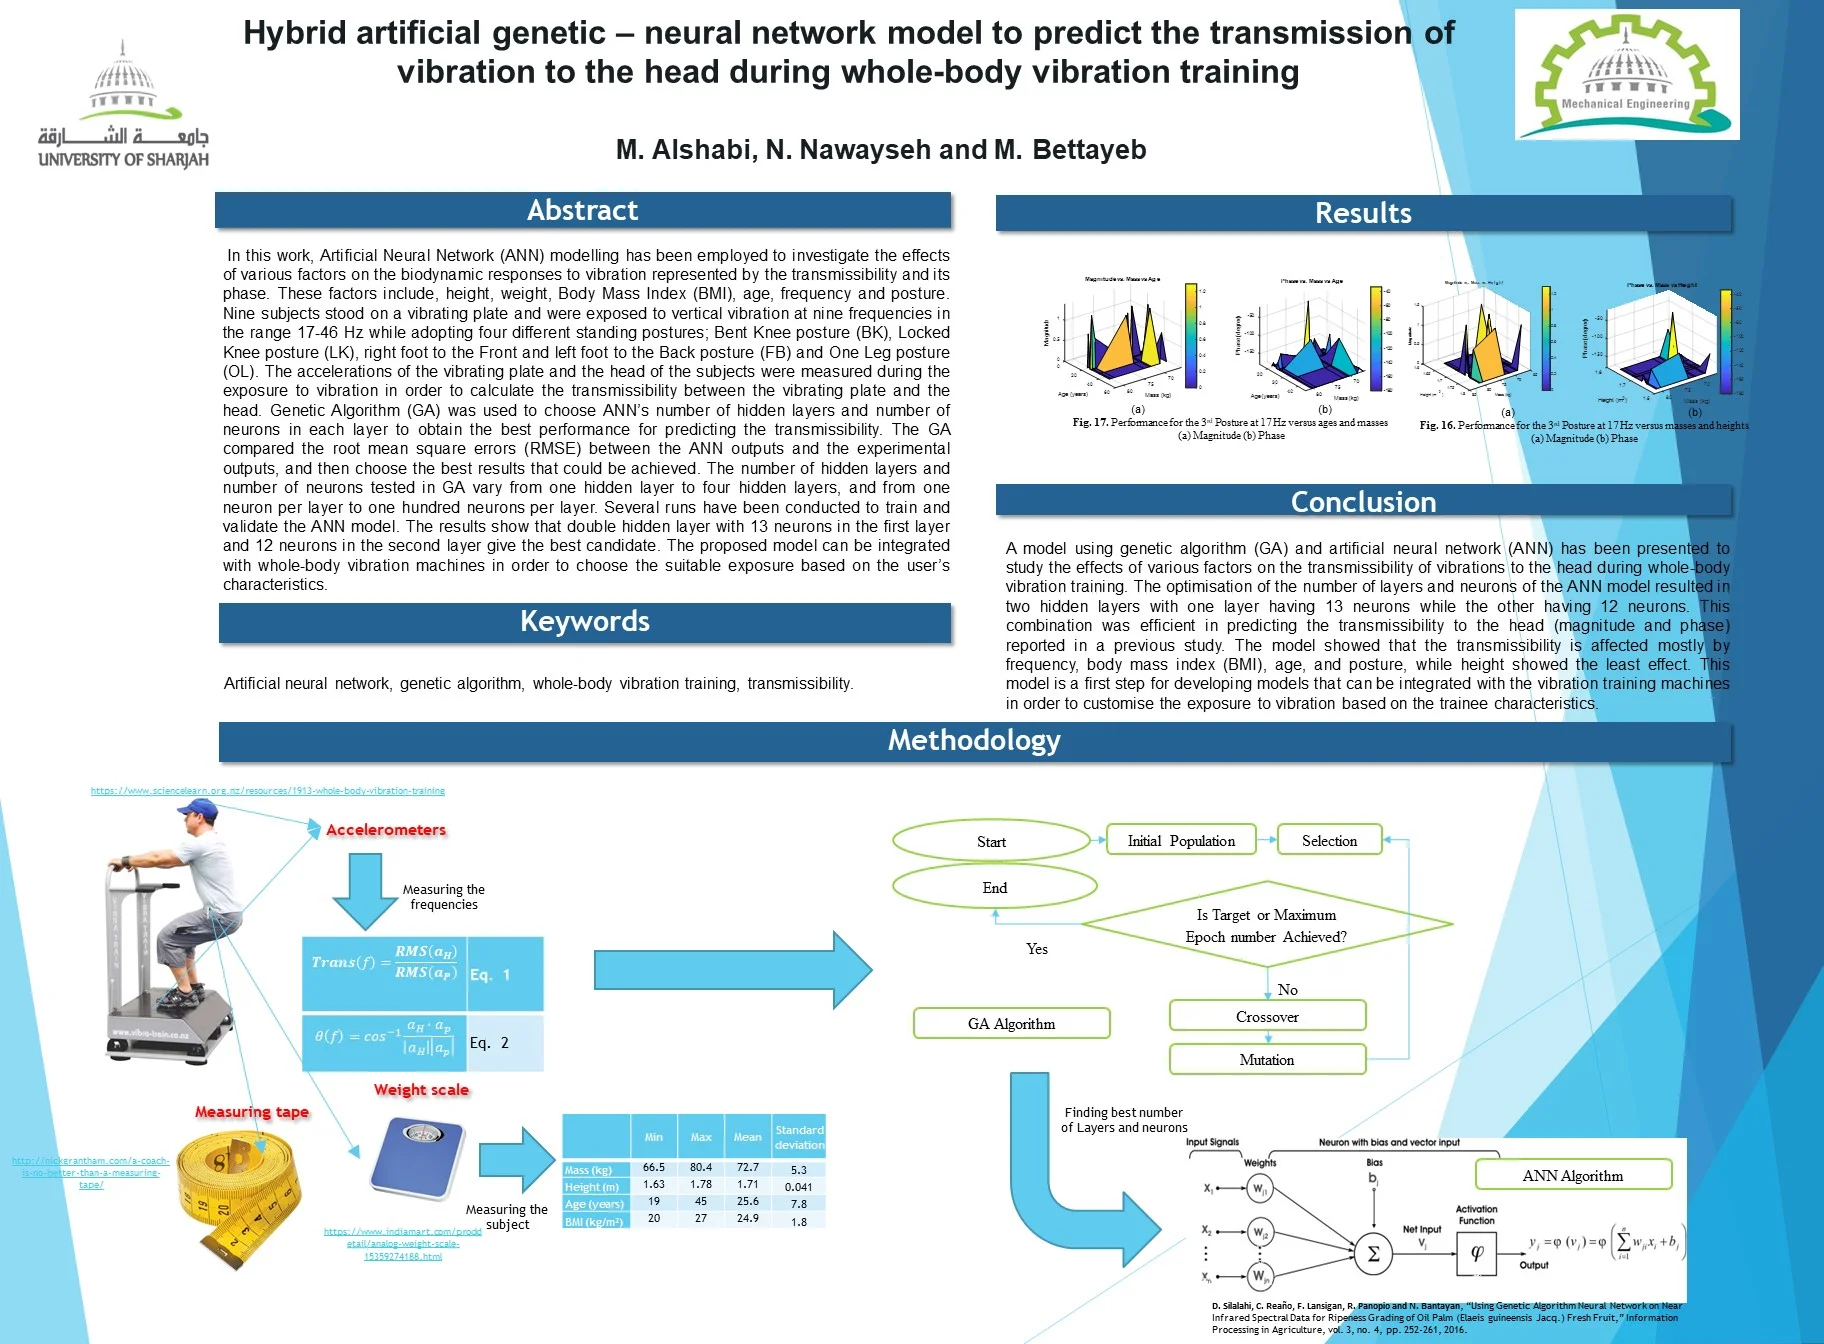
In this work, Artificial Neural Network (ANN) modelling has been employed to investigate the effects of various factors on the biodynamic responses to vibration represented by the transmissibility and its phase. These factors include, height, weight, Body Mass Index (BMI), age, frequency and posture. Nine subjects stood on a vibrating plate and were exposed to vertical vibration at nine frequencies in the range 17-46 Hz while adopting four different standing postures; Bent Knee posture (BK), Locked Knee posture (LK), right foot to the Front and left foot to the Back posture (FB) and One Leg posture (OL). The accelerations of the vibrating plate and the head of the subjects were measured during the exposure to vibration in order to calculate the transmissibility between the vibrating plate and the head. Genetic Algorithm (GA) was used to choose ANN’s number of hidden layers and number of neurons in each layer to obtain the best performance for predicting the transmissibility. The GA compared the root mean square errors (RMSE) between the ANN outputs and the experimental outputs, and then choose the best results that could be achieved. The number of hidden layers and number of neurons tested in GA vary from one hidden layer to four hidden layers, and from one neuron per layer to one hundred neurons per layer. Several runs have been conducted to train and validate the ANN model. The results show that double hidden layer with 13 neurons in the first layer and 12 neurons in the second layer give the best candidate. The proposed model can be integrated with whole-body vibration machines in order to choose the suitable exposure based on the user’s characteristics.
Highlights
- Using ANN to predict the whole-body vibration of a standing body on a vibration training machine.
- Study the effects of weight/height on human bio-response.
- Study the effect of the posture on the human bio-response.
1. Introduction
The use of whole-body vibration training machines in both the medical and sport fields is becoming very popular. Some studies have claimed that the exposure to whole-body vibration helps with some medical conditions or training exercises [1-6]. Other studies, however, have reported either detrimental effects or no beneficial outcomes to using whole-body vibration training machines [7-12]. The discrepancy between the results of the different studies could be attributed to the different vibration conditions used in the different studies. For example, some studies used vertical vibration while others used pivoting vibration. Some studies used only one vibration frequency while others used multiple vibration frequencies. In addition, the exposure duration and subject postures and physical characteristics differed among the different studies. Some vibration condition and body posture might be useful for a certain medical condition/training exercise but not others [13].
Despite the claimed benefits from using whole-body vibration training machines, the machines should be used with care. Previous research has shown possible discomfort and adverse effect of whole-body vibration exposure at magnitudes less than those used with whole-body vibration machines [14]. Therefore, International and local standards have been developed to control the exposure to vibration (e.g. [15]). Those standards are not necessarily applicable to the vibration produced by whole-body vibration training machines due to the different vibration characteristics produced by those machines from those used in the standards. However, there is certainly a need for developing protocols/standards that protect the users’ health from overdose exposure to vibration or wrong use of the machine.
Before developing the standards, it is essential to understand the biodynamic responses to vibration that show how the vibration is transmitted through the human body. This can be done by exposing the body to a controlled vibration and measuring the response (for example in terms of acceleration) at different locations on the body [4, 9, 11, 13, 16]. Those data can then be used to develop the required standards. The biodynamic responses to vibration can also be used to build models that help understand the response to vibration and/or predict any possible risk arising from misusing the whole-body vibration training machines. Although such models have been presented for low frequency and low vibration magnitude cases [17-19], no previous work has attempted to build a model that can predict the response of the human body to vibration under whole-body vibration training conditions.
Using biodynamic models to study the influence of numerous variables on the human Bio-Response has the advantage of reducing cost and time compared to experimental investigations. Elaborative experimental investigations might also be laden with inconsistencies because of unavoidable errors. Two approaches can generally be followed to build biodynamic models. In the first approach, the human body is modelled as a single or a multi-degree of freedom system depending on the objective of the study. This is an analytical approach, in which the body is modelled as rigid bodies connected by springs and dampers to represent the dynamic properties of the body tissue. Lumped parameter models and finite element models fall under this approach. The complexity of this approach depends on the number of segments and the proposed degree of freedom [20-23]. In the second approach, the whole-body is treated as a black box and the goal of the model is to predict the response of some parts of the body given a specific input. Artificial Intelligent techniques fall under this approach. Several algorithms can be used to mimic the model, such as Artificial Neural Network (ANN) [24-27], Autoregressive Moving Average (ARMA) [28, 29], and Fuzzy Logic [30]. The choice between the two approached depend on the application and the objective of the study. In the present work, the second approach, and in particular the artificial neural network, will be used to build the model.
ANN is a well-known modelling tool that is used for prediction, pattern recognition, data fitting, and classifications of complex systems [24]. It possesses the ability to learn and generalize functions from rounds of training as well as extract essential information from data [31-33]. ANN modelling has the building blocks or elements called ‘neurons’ that are interconnected in multiple layers through learned weights. This structure identifies the input-output pattern; the ANN constructs the relations that leads the inputs to the outputs through the weights, then, it uses this relation to predict the output of the missing input data, by using a high nonlinearity interpolation/fitting functions [24, 33, 34]. In the literature, several works used ANN for its simplicity, and its high performance. The training process to obtain the weights is simple, and it does not take long period of time. Usually the match rate of the outputs for these models are above 90 % to the data used for the training [24-27]. Therefore, the ANN offers a useful tool to predict the nonlinear biodynamic response while dealing with holistic problem of numerous variabilities.
The objective of this work is to present an artificial neural network (ANN) model that can predict the transmissibility of the vibration to the head (magnitude and phase) under whole-body vibration training conditions. The experimental data used to train and verify the model have been reported previously in [13]. The model will use the characteristics of the subjects (height, weight, body mass index and age), the vibration frequency and the subject standing posture to predict the magnitude and phase of the transmissibility of the vibration to the head. Since whole-body vibration training machines use a fixed exposure at each frequency for all users regardless of their body characteristics, different vibration will be transmitted through the bodies of users having different body characteristics. Hence, for some subjects, the transmitted vibration could be more or less than required to, for example, train a certain muscle. Models like that proposed in this paper can be integrated with whole-body vibration machines in order to choose the suitable exposure based on the user’s characteristics. Such models not only help in efficient training but also prevent subjects from being exposed to vibration with doses that may lead to injuries due to high transmissibility. The model presented in this work is a first step for building more comprehensive models that can be used to select the vibration input suitable for training specific muscles in different parts of the body. To the best of the authors’ knowledge, the application of ANN to predict the whole-body vibration of a standing body on a vibration training machine has not been attempted previously. The rest of the paper is organized as follows: Section 2 describes the system under study with the factors of the height, weight, body mass index, age, frequency and standing posture are taken in consideration. The methodology is presented in Section 3, where the data, the ANN, and the Genetic Algorithm (GA) are discussed, and their setups are explored. Sections 3 and 4 are dedicated to the results and discussions, and conclusion and future works, respectively.
2. Problem formulation
Studies have shown that biodynamic responses to vibration depend on several factors such as posture and vibration frequency. Moreover, the high inter-subject variability usually found in the biodynamic responses implies that the responses depend on the subject characteristics. This indicates that the exposure to whole-body vibration training has to be customised with respect to the trainee characteristics instead of being fixed at a certain amplitude for all subjects. In this work, Genetic Algorithm (GA) and Artificial Neural Networks (ANN) are used to study the effect of selected body characteristics on the transmissibility to the head (magnitude and phase) of standing subjects under whole-body vibration training conditions. A model is developed to predict the transmissibility to the head using several inputs including the body characteristics, posture and vibration frequency. The ANN model will be trained using experimental data reported previously [13]. This work targets modelling the transmissibility of the human body when standing on a whole-body vibration training machine operated at different frequencies. Subjects, with anthropometric properties summarized in Table 1, were exposed to sinusoidal vertical vibrations. The transmissibility of the head, in term of magnitude and phase, was calculated using acceleration measured on the vibrating plate and the head of the subjects. The safety guidelines were described to each subject, and then each subject signed a consent form approved by the Huma Research Ethics Committee of University of Sharjah.
Table 1Anthropometric details of the subjects
Min | Max | Mean | Standard deviation | |
Mass (kg) | 66.5 | 80.4 | 72.7 | 5.3 |
Height (m) | 1.63 | 1.78 | 1.71 | 0.041 |
Age (years) | 19 | 45 | 25.6 | 7.8 |
BMI (kg/m2) | 20 | 27 | 24.9 | 1.8 |
3. Methodology
Statistical modelling tools are used for quantitative description of the effects of various factors on the whole-body vibration system. In this work, the following factors are considered; frequency, posture, mass, height, age, and body mass index (BMI).
3.1. Data sources and pre-processing
The experimental data used to build and verify the neural network model has been reported previously in [13]. A brief description of the experiment will be given here.
Nine standing male subjects were exposed to whole-body vibration produced by a whole-body vibration training machine [13]. The input vibration stimuli consisted of sinusoidal vertical vibration at 9 different frequencies (17, 20, 24, 28, 31, 35, 38, 42 and 46 Hz). At each frequency, the subjects stood on the vibrating plate of the vibration machine and were exposed to vibration while adopting four different postures one at a time. In the first posture, the subjects stood with their heels lifted up, their backs straight up and their knees slightly bent (bent knee posture, BK). In the second posture, the subjects locked their knees and tilted their upper bodies to the front creating an angle of about 110° between their lower body and upper body (locked knee posture, LK). In the third posture, the subjects stood with their right foot to the front and left foot to the back (foot front/back posture, FB). In the fourth posture, the subjects stood with one leg with a slight bending in the knee (one leg posture, OL). With all postures, the subjects stood barefooted and were instructed to look straight ahead during the exposure to vibration. Each exposure condition lasted 5 seconds followed by a 20-second resting period to minimise the effect of fatigue.
During the exposure to vibration, the vertical acceleration of the vibrating plate () and the vertical acceleration of the head () were measured for each condition using piezo-electric accelerometers (PCB PIEZOTRONICS 352C03). The accelerations were acquired at 256 samples per second via a data acquisition system (DATA TRANSLATION DT9837) and QuickDAQ 2013 software. The transmissibility to the head () at each frequency was calculated as the ratio between the root mean square (r.m.s.) of the acceleration of the head () to the r.m.s. of the acceleration of the platform () as shown in Eq. (1). The phase angle () between the acceleration of the head () and the acceleration of the platform () was calculated using the dot product as shown in Eq. (2):
3.2. ANN modelling
Multilayer perceptron (MLP) network is a feedforward ANN that consists of an input layer, an output layer, and at least one hidden layer between the input and output layers. Each layer has at least one building block called “neuron”. Each neuron combines the outputs of the previous layer after adjusting them with appropriate weight and biases to obtain a single value, . Beside the input neurons, each neuron propagates through a function, referred to as the activation function, as shown in Fig. 1 [33, 35, 36]. The activation function in use as default in Matlab 2017a is the hyperbolic tangent (tanh), also known as Tangent-Sigmoid function (“tansig”), and is expressed in Eq. (3):
Another well-known activation function is the log-sigmoid function (“logsig”), which is expressed in Eq. (4):
The structure of the ANN is designed to accommodate nine subjects, with different body masses, heights, ages, and body mass indices, four standing postures, and nine different frequencies for the sinusoidal vertical vibration. This resulted in 324 datasets. These datasets were divided into three groups of 228, 48, and 48 datasets for training, testing and validation, respectively. The inputs to the ANN are in this order: Posture, frequency, mass, height, age, and body mass index. On the other hand, the outputs of the ANN are in this order: transmissibility magnitude and phase. To improve the convergence speed, and to reduce the numerical instability in obtaining the weights, the inputs and outputs were scaled to the range of {0-1}. The postures were given values of {0.25, 0.5, 0.75 and 1} to represent posture (BK), posture (LK), posture (FB) and posture (OL), respectively. The activation function used here was the “logsig” function as the data were normalized. Once the input and the output layers were set, the hidden layers and their neurons should be selected. This was not an easy task. The selection should be good enough to give a prediction within acceptable Root Mean Squared Error (RMSE), but it should not be overfitted. Therefore, the maximum number of neurons in each layer was set to 25, and the maximum number of hidden layers was set to 4. GA was used to find the best solution of the many different combinations. Results showed that two hidden layers were good enough, and if the number of layers increased, the model become over-fitted without improving the RMSE. GA setup and parameters is discussed in the next section. Back propagation (BP) with the Levenberg Marquardt training algorithm (“trainlm”) is used to train the ANN in order to achieve minimum (RMSE) within 1000 epochs. The training algorithm started by selecting the weights and biases in a random manner, which affected the model performance. To overcome this, each model was trained 20 times, and the best performance was selected. This caused a large computational/time value, but the benefit of having lower RMSE was accomplished.
Fig. 1Single neuron in MLP network [36]
![Single neuron in MLP network [36]](https://static-01.extrica.com/articles/20828/20828-img1.jpg)
The reliability of the neural network was tested based on the coefficient of determination () in the training part Eq. (5). In selecting the best ANN for hidden layer combination, the RMSE value was used Eq. (6). The minimum RMSE for the same setup indicates highest . To compare between different models, several statistical indices were used; the RMSE for each normalized and non-normalized output ( and , Eq. (6, 7)), the RMSE of both normalized outputs (, Eq. (8)), the Maximum Absolute Error for each normalized and non-normalized output ( and , Eq. (9, 10), and the of both normalized outputs Eq. (11):
where , , and are the actual output vector before it was normalized, the output vector obtained from the ANN and after it was scaled, the actual output vector after it was normalized, and the output vector obtained from ANN, respectively. is the average of the normalized output . is the total number of the available data.
3.3. GA for optimization
Increasing the number of the hidden layers generally improves the performance of the model. However, it also makes the optimization problem harder. For example, hidden layers up to and including four layers with each layer having up to 25 neurons, results in about 406,900 models. Bearing in mind that each model needs to be trained 20 times to choose the best model, more than 8 million simulations need to be performed to obtain the best model. This issue was raised in [24], and it was suggested to use meta-heuristics optimization algorithms to solve this problem. In this work, a step has been taking into this path, as Genetic Algorithm (GA) has been used to obtain the number of layers and the number of assigned neurons.
Fig. 2GA Flowchart
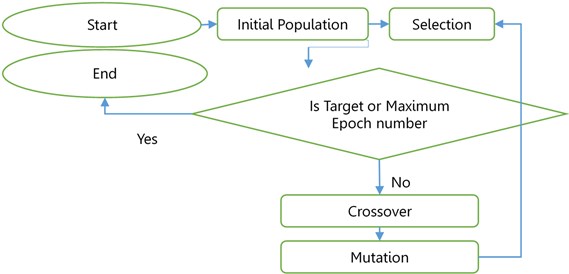
GA is a well-known tool that is used for optimization [37-39]. It is considered as a multi-directional searching method that relies on reproduction (selection), crossover and mutation. The process starts with a number of solutions chosen randomly to create an initial population. Each solution is considered as a candidate that will be used to generate the ANN model and obtain the RMSE. Low values of RMSE indicate that the solution is a good candidate. The solutions are encoded as binary digits to create the chromosomes. The best candidates are kept, and the bad candidates are eliminated. The best candidates are then used to create a new generation by taking parts from their chromosomes to produce new chromosomes (crossover), and then the low probability features/portions are changed (mutation). The method is repeated several times until the performance is achieved or the maximum number of epochs is reached. Fig. 2 summarizes the GA procedure. In this work, a population of 50 solutions were obtained. The solution contains the number of the neurons assigned for each layer as follow:
With minimum and maximum values of Eq. (13) and Eq. (14), respectively:
The solutions contain only integer numbers, which can be achieved by setting the “IntCon” part of the GA Matlab’s function to {1, 4}. Once the solution is assigned, the ANN is trained 20 times and the best RMSE is assigned as the fitting value to that solution. The maximum epoch’s number was set to 5000 epochs. The results were repeated 30 times to reduce the effect of using the random process. The results showed that the best candidates (best populations) for all the simulations in all times are limited to two hidden layers only. Therefore, it was safe to assume that going for third and fourth layer will extensively increase the computational time without improving the results or at least overfitting the data. Therefore, in the results section, the two hidden layers will be considered in more details.
4. Results and discussions
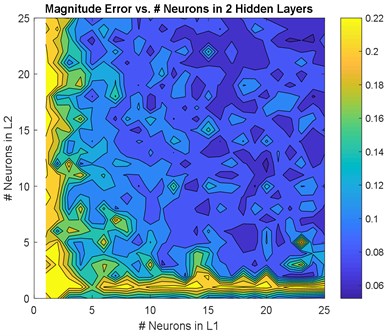
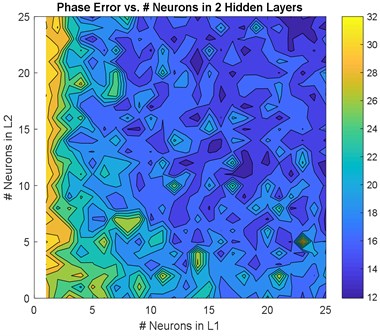
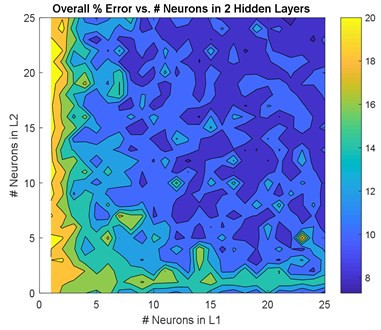
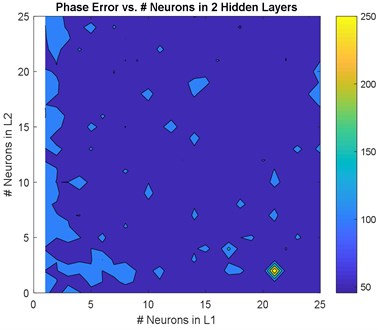
The GA confirmed that choosing two hidden layers is good enough to model the system. Therefore, this section is dedicated to two hidden layers only. Two hidden layers models with neurons between {0-25} in each layer were modelled. The Root Mean Squared Error (RMSE) and the Maximum Absolute Error (MAE) for magnitude and phase were calculated for non-normalized inputs/outputs and are shown in Fig. 3 and Fig. 4, respectively. The average RMSE and MAE were calculated and plotted in Fig. 5.
Fig. 3Non-normalized RMSE versus numbers of neurons in 2-layer: a) magnitude, b) phase
a)
b)
The best solution was found in three scenarios. The first scenario consisted of 22 neurons in the first hidden layer and 25 neurons in the second hidden layer. The second scenario comprised 13 neurons in the first hidden layer and 12 neurons in the second hidden layer. The third scenario consisted of 18 neurons in the first hidden layer and 24 neurons in the second hidden layer. The results of these three models are illustrated in Fig. 6 and Fig. 7. To choose the best candidate, these three models were examined in further details. The RMSE, RMSE %, MA, and MA % were obtained and listed in Table 2, and regression, best validation error, and convergence rate were obtained and listed in Table 3. These comparisons are shown in Fig. 8 to Fig. 11.
Table 2Comparison between best candidates of two-hidden-layer models in terms of RMSE and MA
Layer 1 | Layer 2 | RMSEnon magnitude | RMSEnon phase (degree) | RMSE2 | MAMnon | MAPnon (degree) | MAE2 |
22 | 25 | 0.062 | 11.9 | 7.30 | 0.39 | 66.6 | 0.2 |
13 | 12 | 0.065 | 12.0 | 7.42 | 0.36 | 49.8 | 0.17 |
18 | 24 | 0.061 | 13.5 | 8.11 | 0.31 | 45.7 | 0.15 |
Fig. 4Non-normalized MAE versus numbers of neurons in 2-layer: a) magnitude, b) phase
a)
b)
Fig. 5RMSE2 and MAE2 for the overall performance versus numbers of neurons in 2-layer: a) RMSE2, b) MAE2
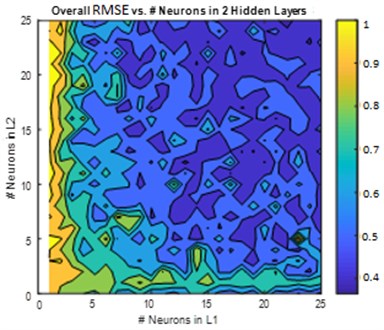
a)
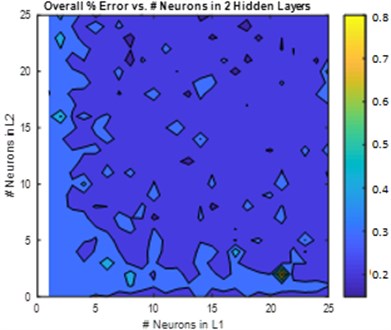
b)
Fig. 6Estimated magnitude of the best candidates in ANN models and their corresponding errors
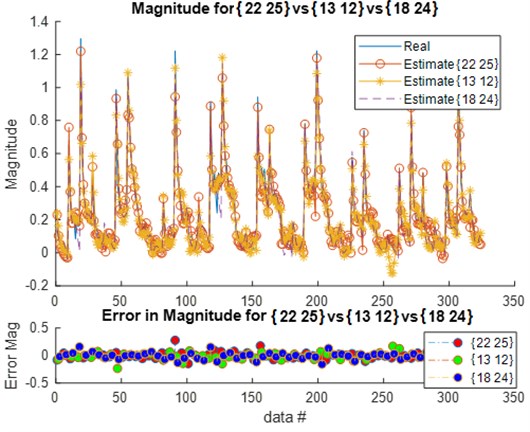
Fig. 7Estimated phase of the best candidates in the ANN models and their corresponding errors
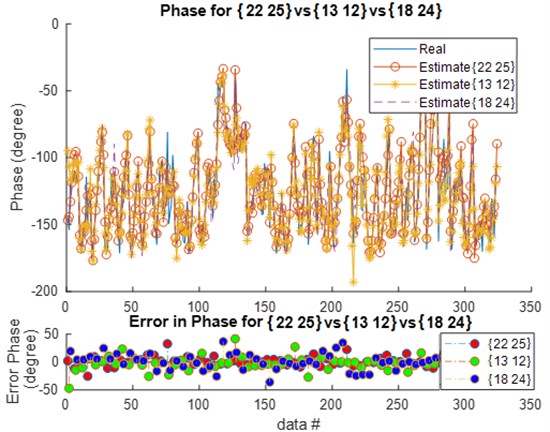
Table 3Comparison between best candidates of two-hidden-layer models in terms of regression and validation
Layer 1 | Layer 2 | magnitude | phase | overall | Epochs | Best validation error |
22 | 25 | 0.965 | 0.9336 | 0.959 | 13 | 0.0050 |
13 | 12 | 0.961 | 0.9299 | 0.956 | 22 | 0.0058 |
18 | 24 | 0.965 | 0.9103 | 0.948 | 8 | 0.0063 |
Fig. 8Regression for 2-hidden layers of {22 25 neurons}
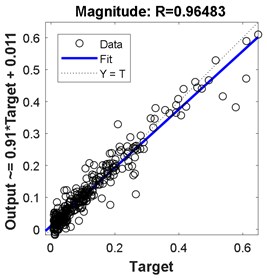
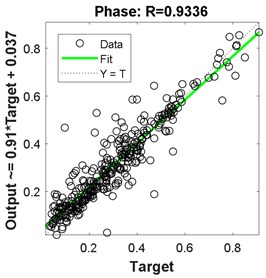
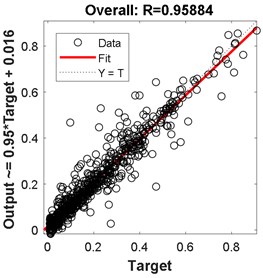
Fig. 9Regression for 2-hidden layers of {13 12 neurons}
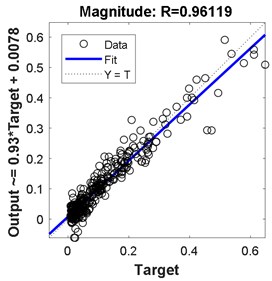
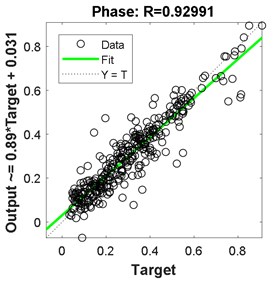
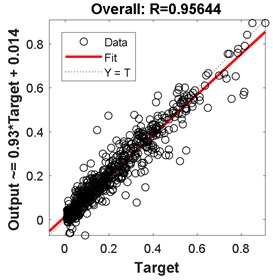
Fig. 10Regression for 2-hidden layers of {18 24 neurons}
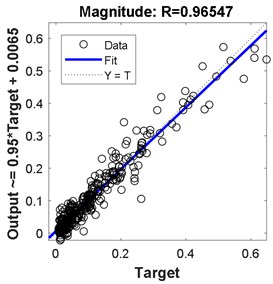
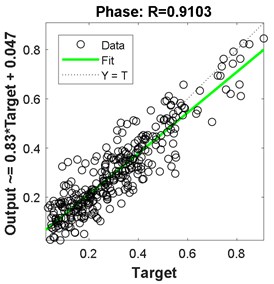
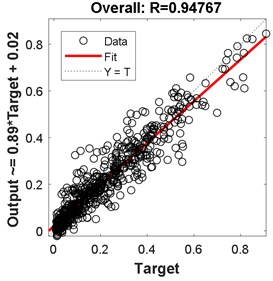
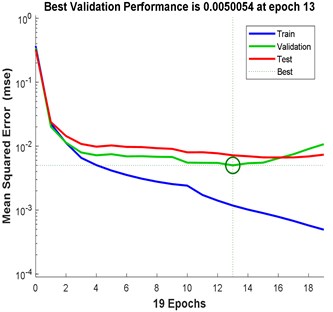
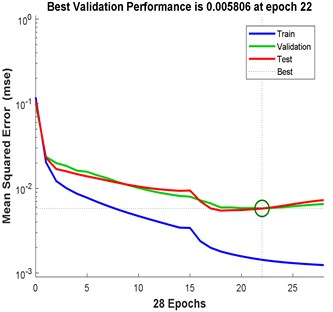
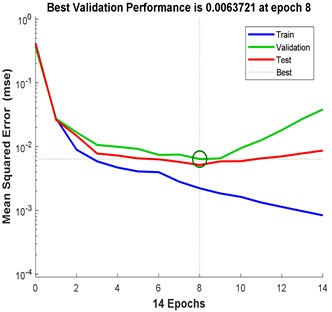
Fig. 11Training results for 2-hidden layers of: a) {22 25 neurons}, b) {13 12 neurons}; c) {18 24 neurons} neurons and their convergence rate
a)
b)
c)
The best results in terms of RMSE, MAE, epochs, validation error, and percentage overall performance, taking into consideration the overfitting phenomenon, is the second solution with 13 and 12 neurons in the first and the second hidden layer, respectively. Once this is set, see Fig. 12, the biodynamic response is examined. The posture effect on the response is illustrated in Fig. 13. To find the other parameters effects, the third posture was considered. The mass effect can be found in Fig. 14, followed by Fig. 15 that shows the effect of the BMI. The height and age effects were found after setting the frequency at 17 Hz, and they both were illustrated in Fig. 16 and Fig. 17, respectively.
Fig. 12Proposed ANN
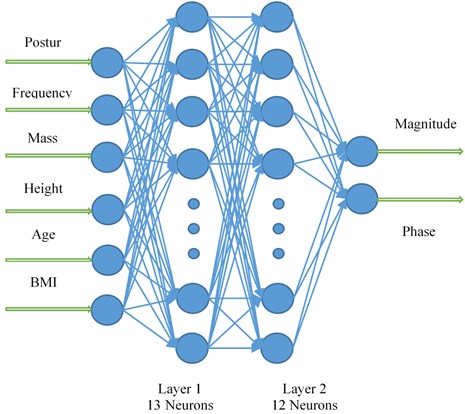
Fig. 13Magnitude and phase for different postures (S is the subject number)
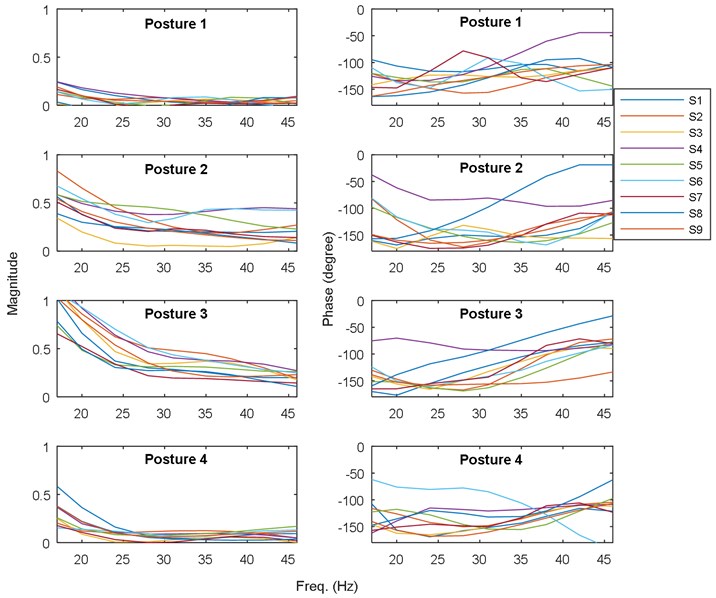
Fig. 3, Fig. 4, and Fig. 5 show a comprehensive study for gradually increasing the number of neurons in the hidden layers. In general, increasing the neurons reduces the RMSE, MAE, and %RMSE, but not in a smooth manner. This is due the instability in the learning process (i.e. the random selection of initial weights). The histograms in these figures show that the majority of models follow the Gaussian (Normal) distribution, with mean values of 0.08, and 17.5 degree for the RMSE of both magnitude and phase, respectively, 0.55, and 75 degree for the MAE of both magnitude and phase, respectively, and 7.5 %, and 50 % for both RMSE of both magnitude and phase, respectively. More than 50 models are in the range of the best candidate using RMSE criteria; < 0.75 and <2 0 % for both magnitude and phase, respectively. Using the MAE criteria, almost 40 models satisfy the magnitude threshold (< 0.35), but no model satisfy the phase threshold (< 20 %). This leads to have almost 50 models that satisfy %RMSE and only few models that satisfy %MAE. Among these models, three models are selected that fall within the 50 models, and have lowest MAE and %MAE. These models are {22 25 neurons}, {13 12 neurons}, and {18 24 neurons} ANN models.
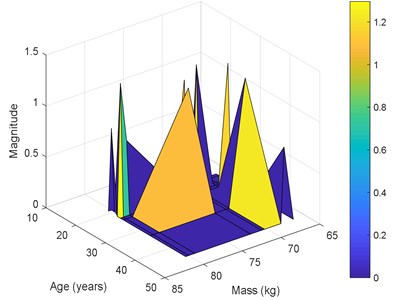
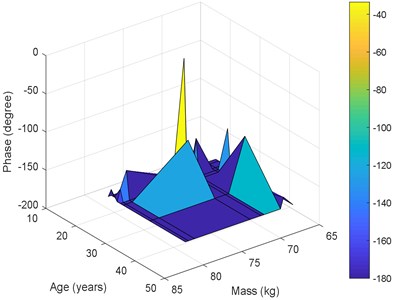
Fig. 14Performance for the 3rd posture versus masses and frequencies: a) magnitude, b) phase
a)

b)
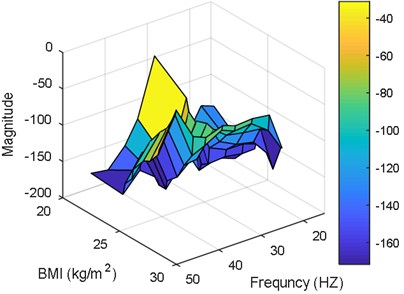
Fig. 15Performance for the 3rd posture versus BMIs and frequencies: a) magnitude, b) phase
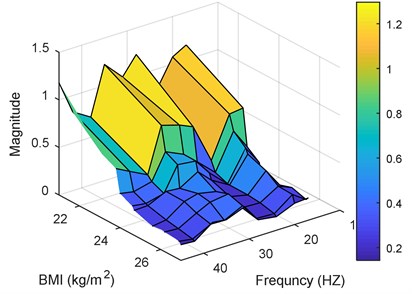
a)

b)
Comparing these models together; Fig. 6 to Fig. 11 and Table 2 to Table 3, the third model; {18 24 neurons}, has the fastest convergence rate; 8 epochs compared to 13 for {22 25 neurons} and 22 for {13 12 neurons}. However, it has the worst RMSE, MAE, %RMSE, , and best validation error. The first model; {22 25 neurons}, has the best RMSE, %RMSE, , and best validation error. However, the large MAE, which reaches 66.6 % for phase calculation, indicates overfitting occurrence. Therefore, the second model, {13 12 neurons} is the best candidate after taking in to consideration all the test mentioned before. It has the second best %RMSE, %MAE, , and best validation error of values 7.4 %, 32 %, 95.6 %, and 0.0058, respectively. The convergence rate is the slowest compared to the other two models; 22 epochs compared to 13 and 8 for the {22 25 neurons} and {18 24 neurons}, respectively. However, the time required to obtain the results is the shortest; 10.05 seconds compared to 53.21 and 29.1 seconds for the {22 25 neurons} and {18 24 neurons}, respectively. The phenomena of overfitting is less likely to occur in this model compared to the others. Therefore, the system contains 13 neurons in the first layer and 12 in the second layer, as shown in Fig. 12. Taking the results of the model {13 12 neurons}, the following observation are obtained from Fig. 13 to Fig. 17:
– Posture 3 has the highest transmissibility magnitude, higher than Posture 2. This is followed by Posture 4, and Posture 1, which has the lowest transmissibility magnitude.
– Phase has no major effect on the bio-response performance.
– In general, the smallest mass values have the highest transmissibility magnitude. This magnitude decays as the mass increases.
– Same observation obtained for transmissibility phase. Small mass values have the largest phase around 30 Hz. Increasing the mass value, shifts the maximum phase value to the highest frequency; around 47 Hz.
– As the mass value is a major factor in obtaining bio-response performance, BMI gives a better understanding and more clear observations, as it takes the mass value compared to the height value. The results show that, for small BMI, the transmissibility magnitude becomes large. This will decrease as the BMI increases.
– BMI has the same effect on transmissibility phase as the mass.
– The height does not have a significant effect on the transmissibility magnitude. It is better for future research to merge the mass and height to one factor; BMI. Taking the factors separately will not improve the results.
– In general, younger subjects have higher transmissibility magnitude compared to older subjects. However, more work is needed to be done in this area.
Fig. 16Performance for the 3rd posture at 17 Hz versus masses and heights: a) magnitude, b) phase
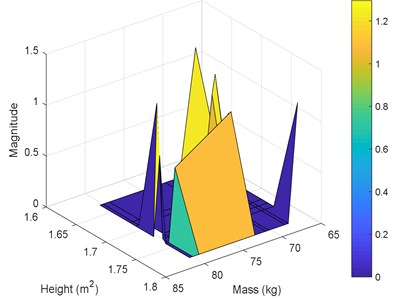
a)
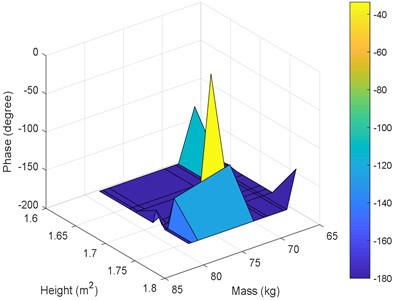
b)
Fig. 17Performance for the 3rd posture at 17 Hz versus ages and masses: a) magnitude, b) phase
a)
b)
5. Conclusions
A model using genetic algorithm (GA) and artificial neural network (ANN) has been presented to study the effects of various factors on the transmissibility of vibrations to the head during whole-body vibration training. The optimisation of the number of layers and neurons of the ANN model resulted in two hidden layers with one layer having 13 neurons while the other having 12 neurons. This combination was efficient in predicting the transmissibility to the head (magnitude and phase) reported in a previous study. The model showed that the transmissibility is affected mostly by frequency, body mass index (BMI), age, and posture, while height showed the least effect. This model is a first step for developing models that can be integrated with the vibration training machines in order to customise the exposure to vibration based on the trainee characteristics.
References
-
Delecluse C., Roelants M., Verschueren S. Strength increase after whole-body vibration compared with resistance training. Medicine and Science in Sports and Exercise, Vol. 35, 2003, p. 1033-1041.
-
Humphries B., Fenning A., Dugan E., Guinane J., Macrae K. Whole-body vibration effects on bone mineral density in women with or without resistance training. Aviation, Space, and Environmental Medicine, Vol. 80, 2009, p. 1025-1031.
-
Lienhard K., Vienneau J., Nigg S., Friesenbichler B., Nigg B. Older adults show higher increases in lower-limb muscle activity during whole-body vibration exercise. Journal of Biomechanics, Vol. 52, 2017, p. 55-60.
-
Schlee G., Reckmann D., Milani T. Whole body vibration training reduces plantar foot sensitivity but improves balance control of healthy subjects. Neuroscience Letters, Vol. 506, 2012, p. 70-73.
-
Verschueren S., Roelants M., Delecluse C., Swinnen S., Vanderschueren D., Boonen S. Effect of 6-month whole body vibration training on hip density, muscle strength, and postural control in postmenopausal women: a randomized controlled pilot study. Journal of Bone and Mineral Research, Vol. 19, 2004, p. 352-359.
-
Yang F., King G., Dillon L., Su X. Controlled whole-body vibration training reduces risk of falls among community-dwelling older adults. Journal of Biomechanics, Vol. 48, 2015, p. 3206-3212.
-
De Ruiter C., Van Raak S., Schilperoort J., Hollander A., De Haan A. The effects of 11 weeks whole body vibration training on jump height, contractile properties and activation of human knee extensors. European Journal of Applied Physiology, Vol. 90, 2003, p. 595-600.
-
Niehoff A., Hamann N., Ratiu O., Lechner P., Reuter S., Brüggemann G., Schönau E., Bloch W., Beccard R. The influence of whole-body vibration and IGF-I on muscle paralysis-induced bone degradation. Journal of Biomechanics, Vol. 45, Issue 5, 2012, p. 109.
-
Pollock R., Provan S., Martin F., Newham D. The effects of whole body vibration on balance, joint position sense and cutaneous sensation. European Journal of Applied Physiology, Vol. 111, 2011, p. 3069-3077.
-
Rees S., Murphy A., Watsford M. Effects of whole-body vibration exercise on lower-extremity muscle strength and power in an older population: a randomized clinical trial. Physical Therapy, Vol. 88, 2008, p. 462-470.
-
Sonza A., Robinson C., Achaval M., Zaro M. Whole body vibration at different exposure frequencies: Infrared thermography and physiological effects. Scientific World Journal, Vol. 2015, 2015, p. 452657.
-
Torvinen S., Kannus P., Sievänen H., Järvinen T., Pasanen M., Kontulainen S., Nenonen A., Järvinen T., Paakkala T., Järvinen M., Vuori I. Effect of 8-month vertical whole body vibration on bone, muscle performance, and body balance: a randomized controlled study. Journal of Bone and Mineral Research, Vol. 18, 2003, p. 876-884.
-
Nawayseh N. Transmission of vibration from a vibrating plate to the head of standing people. Sports Biomechanics, Vol. 18, Issue 5, 2019, p. 482-500.
-
Griffin M. Handbook of Human Vibration. Academic Press, London, 1990.
-
Mechanical Vibration and Shock – Evaluation of Human Exposure to Whole-Body Vibration – Part 1: General Requirements. ISO 2631-1, International Organization for Standardization, Geneva, 1997.
-
Sonza A., Maurer C., Achaval M., Zaro M., Nigg B. Human cutaneous sensors on the sole of the foot: Altered sensitivity and recovery time after whole body vibration. Neuroscience Letters, Vol. 533, 2013, p. 81-85.
-
Gan Z., Hillis A., Darling J. Biodynamic modelling of seated human subjects exposed to uncouples vertical and fore-and-aft whole-body vibration. Journal of Vibration Engineering and Technologies, Vol. 3, 2015, p. 301-314.
-
Nawayseh N. A mathematical model of the apparent mass of the human body under fore-and-aft whole-body vibration. International Journal of Automotive and Mechanical Engineering, Vol. 13, 2016, p. 3613-3627.
-
Subashi G., Matsumoto Y., Griffin M. Modelling resonances of the standing body exposed to vertical whole-body vibration: Effects of posture. Journal of Sound and Vibration, Vol. 317, 2008, p. 400-418.
-
Bai X., Xu S., Cheng W., Qian L. On 4-degree-of-freedom biodynamic models of seated occupants: lumped-parameter modeling. Journal of Sound and Vibration, Vol. 402, 2017, p. 122-141.
-
Zheng G., Qiu Y., Griffin M. An analytic model of the in-line and cross-axis apparent mass of the seated human body exposed to vertical vibration with and without a backrest. Journal of Sound and Vibration, Vol. 330, Issue 26, 2011, p. 6509-6525.
-
Madakashira Pranesh A. Experimental and Analytical study of Transmission of Whole-body Vibration to Segments of the Seated Human Body. Ph.D. Thesis, Concordia University, 2011.
-
Qiao G. Identification of Physical Parameters of Biological and Mechanical Systems under Whole-Body Vibration. Ph.D. Thesis, University of Iowa, 2017.
-
Taghavifar H., Rakheja S. Supervised ANN-assisted modeling of seated body apparent mass under vertical whole body vibration. Measurement, Vol. 127, 2018, p. 78-88.
-
Gohari M., Rahman R., Raja R. New biodynamical model of human body responses to vibration based on artificial neural network. 14th Asia Pacific Vibration Conference, Dynamics for Sustainable Engineering, Hong Kong, 2011.
-
Gohari M., Rahman R., Tahmasebi M., Nejat P. Off-road vehicle seat suspension optimisation, part i: derivation of an artificial neural network model to predict seated human spine acceleration in vertical vibration. Journal of Low Frequency Noise, Vibration and Active Control, Vol. 33, Issue 4, 2014, p. 429-441.
-
Gohari M., Rahman R., Raja R., Tahmasebi M. A novel artificial neural network biodynamic model for prediction seated human body head acceleration in vertical direction. Journal of Low Frequency Noise, Vibration and Active Control, Vol. 31, Issue 3, 2012, p. 205-216.
-
Sövényi S., Gillespie R. Cancellation of biodynamic feedthrough in vehicle control tasks. IEEE Transactions on Control Systems Technology, Vol. 15, Issue 6, 2007, p. 1018-1029.
-
Ippili R., Davies P., Baja A., Hagenmeyer L. Nonlinear multi-body dynamic modeling of seat-occupant system with polyurethane seat and H-point prediction. International Journal of Industrial Ergonomics, Vol. 35, Issues 5-6, 2008, p. 368-383.
-
Liu J., Kubo M., Aoki H., Liu N., Kou P., Suzuki T. A study on the difference of human sensation evaluation to whole-body vibration in sitting and lying postures. Applied Human Science Journal of Physiological Anthropology, Vol. 14, Issue 5, 1995, p. 219-226.
-
Abidoye L. K., Das D. B. Artificial neural network modeling of scale-dependent dynamic capillary pressure effects in two-phase flow in porous media. Journal of Hydroinformatics, Vol. 17, Issue 3, 2015, p. 446-461.
-
Khashei M., Bijari M. Fuzzy artificial neural network (p, d, q) model for incomplete financial time series forecasting. Journal of Intelligent and Fuzzy Systems, Vol. 26, Issue 2, 2014, p. 831-845.
-
Wang L., Fu K. Artificial Neural Networks. Wiley Online Library, 2008.
-
Taghavifar H., Mardani A., Taghavifar L. A hybridized artificial neural network and imperialist competitive algorithm optimization approach for prediction of soil compaction in soil bin facility. Measurement, Vol. 46, Issue 8, 2013, p. 2288-2299.
-
Hristev R. The ANN Book. GNU General Public License, 1998.
-
Silalahi D., Reaño C., Lansigan F., Panopio R., Bantayan N. Using genetic algorithm neural network on near infrared spectral data for ripeness grading of oil palm (elaeis guineensis jacq.) fresh fruit. Information Processing in Agriculture, Vol. 3, Issue 4, 2016, p. 252-261.
-
Valarmathi K., Devaraj D., Radhakrishnan T. Real-coded genetic algorithm for system identification and controller tuning. Applied Mathematical Modelling, Vol. 33, Issue 8, 2009, p. 3392-3401.
-
Chang W. Nonlinear system identification and control using a real-coded genetic algorithm. Applied Mathematical Modelling, Vol. 31, Issue 3, 2007, p. 541-550.
-
Liu Z., Liu A., Wang C., Niu Z. Evolving neural network using real coded genetic algorithm (GA) for multispectral image classification. Future Generation Computer Systems, Vol. 20, Issue 7, 2004, p. 1119-1129.
Cited by
About this article

