Abstract
Accurate judgement of devoid damage information by 3D-Radar is an effective way of repairing damage in nondestructive pavements. In order to systematically analyse the characteristics of devoid damage under nondestructive pavements in 3D-Radar response. In this study, the 3D-Radar response to devoid damage of different sizes, locations and moisture contents was quantified by FDTD orthorectified simulations. Data acquisition of the pre-buried devoid damage on site was carried out using 3D-Radar, compared with the orthorectified simulation results and numerical analysis. The detection effect was also verified by relying on the project. The results show that the radar wave characteristics of the devoid damage are obvious. Different colour and waveform image characteristics in B-Scan in the presence and absence of water at the location; the size of the devoid also has an impact on the image characteristics. It depends on the footprints and size of the devoid. It creates “upward-convex”, “down-concave” and straight features; the presence of the devoid characteristics in the 3D-Radar mapping will enhance the confidence of the devoid identification through field tests and engineering verification.
1. Introduction
Asphalt pavement has advantages such as high stability, fatigue resistance, easy construction and maintenance, and comfortable driving. It has become the main form of pavement for roads worldwide [1]. During the construction of asphalt roads, especially early-built roads, there are often problems. Such as insufficient compaction of the road base pavement, defective quality of the pavement material and construction departures. Even if the materials and construction meet the relevant standards, the cumulative effect of traffic loads can still produce damage. These include rutting, cracking, loosening, subsidence, devoid, and interlayer bond failure [2].
Amongst other things, devoid is the hidden culprit of road structural damage and shortened road service life [3]. Devoid occurs within the road, usually between the surface and subgrade layers. The plastic deformation of the subgrade is caused by repeated traffic loads and uneven temperature distribution [4] causing the slab to buckle. The resulting deaeration can be roughly divided into three types: air-filled devoid, water-filled devoid, and mixed air-water devoid. This hidden damage cannot be observed from the surface layer of the road in the early stages. It is detected when it has caused serious problems, such as potholes and cave-ins. The detection of the part below the surface layer in the investigation and design can only approximate the strength of the surface layer by back extrapolation through testing tools such as drop hammer bending instrument, and it is not possible to get the specific information of the internal damage. This can be inaccurate in terms of causing subterranean conditions. The use of extensive pavement excavation or coring methods is neither practical nor reasonable, and at the same time does not allow for full coverage testing. Therefore, how to quickly and accurately, and to achieve non-destructive detection of pavement internal invisible damage, has become the current stage of pavement testing work in an urgent need to solve the problem.
In pavement non-destructive testing technology, 3D-Radar technology is more mature and widely used than image detection, laser detection, ultrasonic detection and spectrum analysis. It has been increasingly used in the field of engineering surveys in recent years [5]. It has a strong ability to identify anomalies in road subsurface structures [6]. Some research results have also been generated in the area of devoid damage detection [7]. However, although 3D-Radar requires less measurement time, it is still difficult to carry out large-scale measurements. Because the complex subsurface environment distorts the radar response, the analysis of radar patterns still relies heavily on human interpretation. This deficiency seriously reduces the efficiency of decision making for road maintenance and rehabilitation [8]. Therefore, the study of 3D-Radar pattern characterization of devoid damage is of great significance.
In the real world, modelling of the subsurface environment based on 3D-Radar is difficult to construct. This is because the real situation on the ground is often variable and complex. Forward simulation is an effective way of modelling ideal conditions. The orthorectified results of 3D-Radar images can help to discern anomalous areas of the radar map [9].
FDTD orthorectified simulation is a common and effective method to study the characteristics of the delineation [10]-[11]. It can be used to analyse the simulation results of typical geological models. And it deepens the understanding of 3D-Radar propagation law and reflection profile. It provides a reference for the interpretation of 3D-Radar data. The propagation patterns or characteristics of electromagnetic waves in the subsurface medium are simulated by digital means, provided that the distribution of the parameters already known [12]-[13].
In this paper, the radar wave characteristics of different types of devoid damage are proposed by means of forward software simulation, on-site typical damage burial and relying on engineering verification. Technical support is provided for the engineering application of 3D-Radar detection.
2. Experimental methods
2.1. FDTD forward simulation method
2.1.1. GprMax forward simulation parameter settings
GprMax is a simulator developed based on FDTD and ground–penetrating radar [14]-[15]. It is an open source software designed for 3D-Radar orthorectified simulation. In this study, the signal characteristics of 3D-Radar reflections are analysed in detail by the GprMax method. The forward simulation of common devoid damage is carried out.
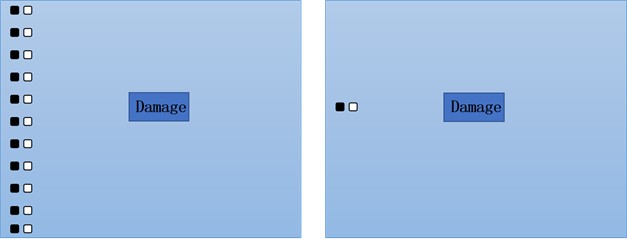
In the GprMax forward simulation, when the model is too large, changes in the location and nature parameters of a single type of damage cannot produce significant changes in the waveform image, and the step size of the grid and antenna movement is limited by the computer’s operating capacity and time. In addition, due to the homogeneity of the damage model material and the regularity of the shape in the simulation, the multi-channel setup has less reference value. The B-Scan scanning results are identical for the damaged channels, and there is no reflection waveform in the B-Scan scanning results for the undamaged channels, as shown in Fig. 1. Not only that, the multi-channel setup would increase the workload by 10 times, so a single-channel transmitter and receiver antenna was set up.
In practical inspection, as the condition of the underground structure is unknown, 3D-Radar transmits a step frequency from 100 MHz to 3 GHz in order to detect information deeper in the highway while maintaining resolution, but there is no such concern in the simulation. Therefore, the transmitting frequency set in the simulation is 800 MHz, which corresponds to an effective detection depth of about 1.0 m. The pulse time window was 20 ns, corresponding to a modelled depth of 1.0 m. The 3D-Radar radiated a Ricker subwave, which had the same pulse shape as that produced by most radar systems, including the GeoScopeTM fourth-generation radar host system used in the actual field inspection.
Fig. 1Top view comparison of multi-channels and single-channel
In order to make the resolution and accuracy of the imaging results from the forward simulation higher than the actual detection, the receiving antenna and the transmitting antenna were moved closer to each other, with a distance of 3 cm, and with a smaller step size of 1 cm in the horizontal direction.
Combining the above factors, in the GprMax forward simulation, the data segment size was selected as 1.0 m×1.0 m×0.5 m; the grid size was 0.3 cm×0.3 cm×0.3 cm; the receiving antenna was 3 cm away from the transmitting antenna, moving in horizontal steps of 1 cm, and the transmitting frequency was 800 MHz.
2.1.2. Forward simulation model design
In 3D-Radar for the detection of media, the main electrical parameter that determines the velocity of electromagnetic field waves is the relative permittivity. The effect of conductivity is generally considered only on the loss and attenuation of the electromagnetic wave, and the effect on velocity is considered only at low frequencies (1 to 3000 Hz), whereas ground-penetrating radar uses high-frequency electromagnetic waves.
Fig. 2Road structure model diagram
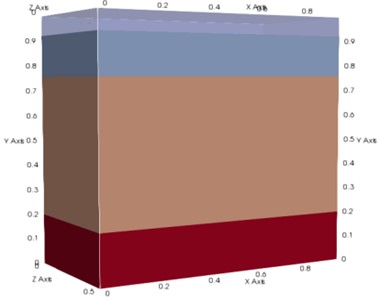
The subsurface medium is inhomogeneous, and the different structural layers of an asphalt road are composed of a variety of materials, although the porosity of each layer varies, and the percentage of air or water within the layer varies accordingly, but the differences are not significant. Therefore, the main differences in the relative dielectric constant of the subsurface medium lie in the differences between the different structural layers. According to the relative dielectric constant information of the road material, combined with the pavement structure form of the dependent project, the parameters of the relative dielectric constant of the asphalt road structure and material are obtained, the details of which are shown in Table 1, and the road structure model diagram is shown in Fig. 2.
Table 1Dielectric constants of road surface construction forms and main materials
Asphalt pavement 1.0 m×1.0 m×0.5 m | Material | Thickness | Dielectric constant |
Air | Air | 8 cm | 1 |
Surface layer | AC-13 asphalt concrete | 16 cm | 6 |
AC-20 asphalt concrete | |||
AC-25 asphalt concrete | |||
Base layer | 5 % cement-stabilised aggregates | 56 cm | 9 |
4 % cement-stabilised aggregates | |||
Bedding layer | graded aggregates | 20 cm | 7 |
2.2. On-site burial methods for devoid damage
Devoid of the damage buried section for the dependence project section. It is a section of the G5511 Erlianhaote to Guangzhou National Expressway. The starting point is located in the village of Anye, Xilin Gol league Baiqi, and the end point to the princess ridge. The total length of the road is 178.851 km, with a total testing mileage of about 48 km, with four lanes in both directions.
Table 2Information table on burial of damage
Material | Location | Volume (cm3) | Mass (g) | Moisture content (%) |
Plastic pack | Surface layer, basal layer | 10×10×1 | 360 | 0,15 |
Plastic pack | Surface layer, basal layer | 10×10×1 | 720 | 0,15 |
The specific process for damage burial is as follows:
1) Produce a damage model. The types of damage burial are interstratified with and without water devoid. The damage is modelled using a sandy soil with a relative dielectric constant closer to that of air. This has the advantage that it is not easily deformed after wrapping and can better control the water content of the buried area; the wrapping material is a non–polar plastic package with a relative dielectric constant closer to that of sand.
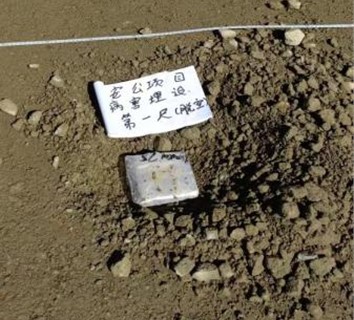
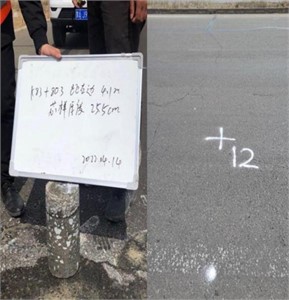
2) Damage model burial. The model was buried and marked in the traffic aids, as shown in Table 2. The test was repeated three times for each group. The burial site is shown in Fig. 3.
Fig. 3Burial site of devoid damage
3) Buried damage detection. After the construction of the road base and surface layers, the road was inspected by a 3D-Radar inspection vehicle. The vehicle speed was set at 20 km/h, the dwell time at 2 μs, the sampling interval at 6.5 cm and the acquisition mode at common midpoint.
3. Experimental results and analysis
3.1. FDTD forward simulation
3.1.1. Forward simulation of air-filled devoid
In the forward simulation of the air-filled devoid in different volumes and locations, with dimensions of 10 cm×10 cm×1 cm and 10 cm×20 cm×1 cm in length × width × height were placed in the underground environment of the road. The information and results of the forward simulation are shown in Table 3.
Table 3Forward simulation of air–filling devoid for different volumes and positions
Name | Damage A | Damage B | Damage C | Damage D |
Layer | Surface layer | Surface layer | Basal layer | Basal layer |
Volume (cm3) | 10×10×1 | 10×20×1 | 10×10×1 | 10×20×1 |
Depth (cm) | 16 | 16 | 72 | 72 |
Simulation Models | 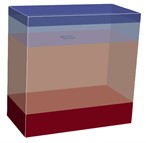 | 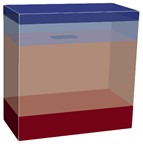 | 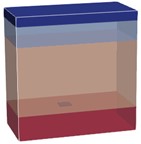 | 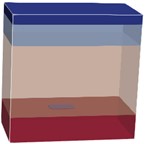 |
FDTD Simulation (B-Scan) | 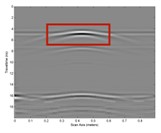 | 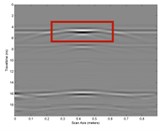 | 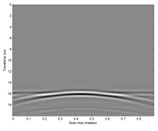 | 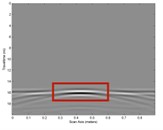 |
FDTD Simulation (A-Scan) | 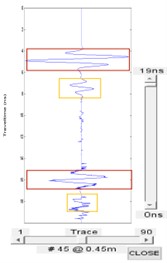 | 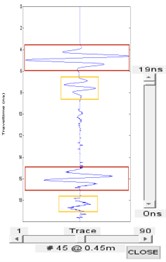 | 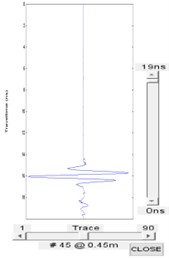 |  |
Note: The red boxes show reflections of radar signals with higher intensity, and the orange boxes show bypassed waves with lower intensity | ||||
The A-Scan in Table 3 shows that the radar signal is reflected in a continuous isotropic wave at the top of the devoid damage. At the bottom of the devoid damage, an inverse reflection wave is formed. A bypass wave appears below the devoid damage. A second reflection occurs further down when the relative permittivity of the medium changes. From the B-Scan, the reflected wave at the top has the same polarity as the incident wave. The reflected wave at the bottom has the opposite polarity to the incident wave. On the radar image it appears as a black, then white, then black striped pattern.
A comparison of the radar images of devoid damage at different locations of damage A and B with those of damage C and D shows that when the devoid is deeper, its character is weakened and the bypass waves no longer appear; a comparison of the B-Scan of damage A and C with those of damage B and D at different volumes shows that when the volume becomes larger (or when the length of debris increases), the radar images change from “upward-convex” to “down-concave”.
3.1.2. Forward simulation of water-filled devoid
Before studying the mixed air-water devoid, it is important to distinguish the waveform characteristics formed by water and air in the radar image. It was determined whether water or air was responsible for the change in the reflected waveform. The first step was to carry out a forward simulation of a fully water-filled devoid. In this simulation, water-filled voids with dimensions of 10 cm×10 cm×1 cm and 10 cm×20 cm×1 cm were placed in the subsurface environment of the road. The information and results of the forward simulation are shown in Table 4.
Table 4Forward simulation of water-filling devoid for different volumes and positions
Name | Damage A | Damage B | Damage C | Damage D |
Layer | Surface layer | Surface layer | Basal layer | Basal layer |
Volume (cm3) | 10×10×1 | 10×20×1 | 10×10×1 | 10×20×1 |
Depth (cm) | 16 | 16 | 72 | 72 |
Simulation models | 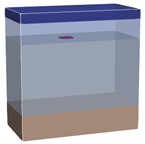 | 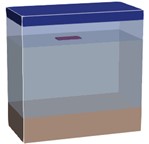 | 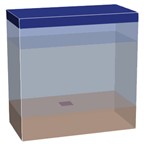 | 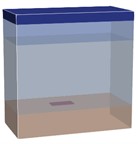 |
FDTD simulation (B-Scan) | 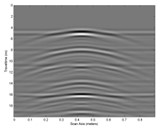 | 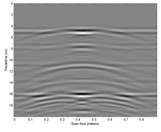 | 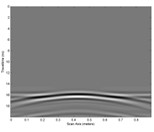 | 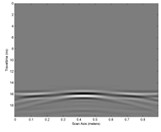 |
FDTD simulation (A-Scan) | 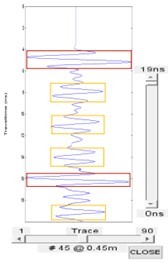 | 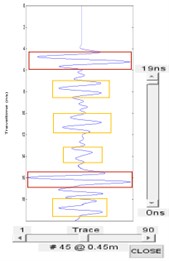 |  |  |
The A-Scan in Table 4 shows that the radar signal forms a continuous reflective wave of inverse direction at the top of the water-filled devoid. At the bottom it forms isotropic reflected waves. and three bypass waves appear below. A second reflection occurs when the medium (relative dielectric constant) changes at greater depths. From the B-Scan, the reflected wave at the top has the opposite polarity to the incident wave. The reflected wave at the bottom has the same polarity as the incident wave. This appears on the radar image as a white, then black, then white striped pattern.
A comparison of the radar images of the different locations of water-filled devoid of damage A and B with those of damage C and D shows that the characteristic features are weakened when the devoid are deeper. The wave bypass is no longer present. A comparison of the radar images of the different volumes of the water-filled devoid in damage A and C with those of damage B and D shows that the radar images change from an “upward-convex” to a “down-concave” pattern when the volume becomes larger (or when the length of the devoid increases).
Compared to the air-filling devoid, the relative permittivity of water is much greater than the relative permittivity of any subsurface medium on the road and air . Therefore, when moisture is present in the devoid, the relative permittivity of the region increases dramatically, and when the radar signal penetrates the region it produces a high-intensity reflection that distinguishes it from the water-free devoid region. This shows that water is the biggest factor affecting the radar image of a road subsurface structure. If the water content of a road subsurface structure increases, this will result in a huge increase in the overall reflected wave intensity of the radar image. This weakens the prominence of damage features and ultimately leads to an exponential increase in the difficulty of discriminating the images.
3.1.3. Forward simulation of mixed air-water devoid
The water content of the soil base was measured at 2.3 %, the water content of the subgrade at 5 % and the water content of the subbase at 4.8 % in the subsurface structure of the highway of the dependent project. In this simulation, the water content of the air-water devoid was set at 15 %. The 10 cm×10 cm×1 cm and 10 cm×20 cm×1 cm voids were placed in the subsurface environment of the road. The information and results of the forward simulation are shown in Table 5.
Table 5Forward simulation of air-water devoid for different volumes and positions
Name | Damage A | Damage B | Damage C | Damage D |
Layer | Surface layer | Surface layer | Basal layer | Basal layer |
Volume (cm3) | 10×10×1 | 10×20×1 | 10×10×1 | 10×20×1 |
Depth (cm) | 16 | 16 | 72 | 72 |
Simulation Models | 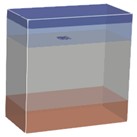 | 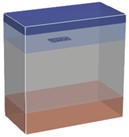 | 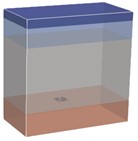 | 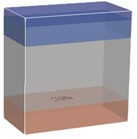 |
FDTD Simulation (B-Scan) | 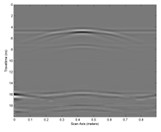 | 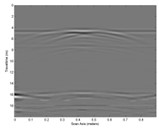 | 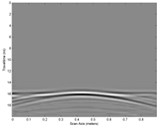 | 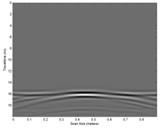 |
FDTD Simulation (A-Scan) | 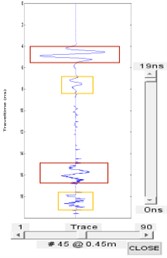 | 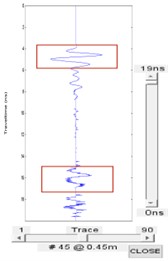 | 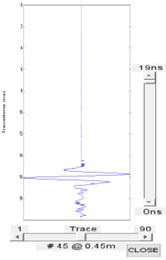 | 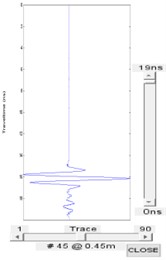 |
As can be seen from Table 5, the radar image characteristics of the 15 % water content air-water devoid are similar to those of the air-filled devoid. The difference is that in the A-Scan the intensity of the first reflected wave of the radar image is weaker. The number of bypass waves is reduced from three to one. In the B-Scan, the clarity of the bar pattern is reduced.
In summary, the orthorectified simulations of the devoid damage revealed that the main characteristic of the devoid damage is the appearance of black and white striped patterns. The intensity of the reflections and the number of waves bypassing them increase with increasing water content. As the horizontal size of the devoid increases, the reflective feature changes from an “upward-convex” to a “down-concave” shape.
3.2. On-site burial for devoid damage
3.2.1. Burial experiment of air-filling devoid
The clearer 3D-Radar images were selected for processing in the repeat tests of the devoid damage burial. The specific parameters and test results are shown in Table 6.
Table 6Results of air-filling devoid test surveys
Name | Damage A | Damage B | Damage C | Damage D |
Layer | Surface layer | Surface layer | Basal layer | Basal layer |
Volume (cm3) | 10×10×1 | 10×20×1 | 10×10×1 | 10×20×1 |
On-site detection (B-Scan) | 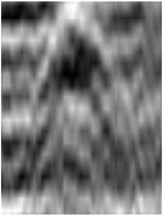 | 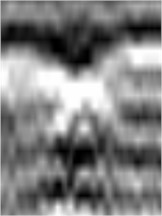 | 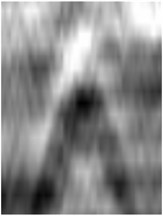 |  |
On-site detection (A-Scan) | 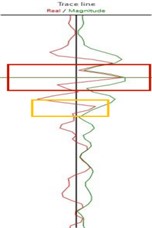 | 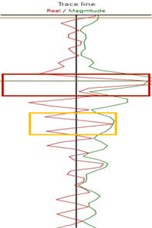 | 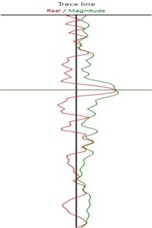 | 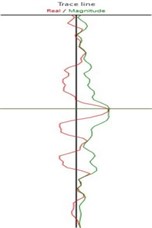 |
On-site detection (Cross-section) | 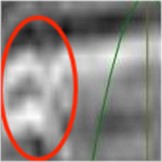 | 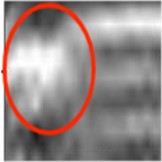 | 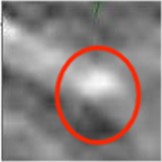 | 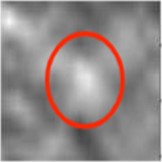 |
On-site detection (Horizontal section) | 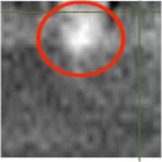 | 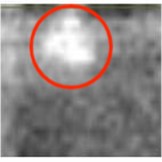 |  | 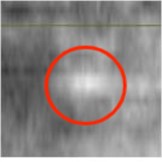 |
As can be seen from the A-Scan images in Table 6, isotropic reflected waves were generated at the location of the devoid disease. There is also one bypass wave. The field test results are consistent with the orthorectified simulation results. In addition, it can be clearly observed from the comparison between the two groups of damage A and B and damage C and D that the reflected wave intensity of the surface layer is greater than that of the basal layer; it can be seen from the B-Scan images that the image clarity of damage C and D is lower. It can be seen that depth is a major factor affecting the clarity of the radar. However, the radar images of both the basal and surface layers show a pattern that is consistent with the orthorectified simulation. As the volume of the devoid increases, the reflective feature changes from an “upward-convex” to a “down-concave” shape.
A cross-sectional image of the On-site detection reveals the presence of a highlighted anomalous area but no prominent features; a circular highlighted area can be clearly observed in the horizontal section.
3.2.2. Burial experiment of air-water devoid
The specific parameters and test results in the replicated tests for the burial of the air–water damage are shown in Table 7.
Table 7Results of the air-water devoid test surveys
Name | Damage A | Damage B | Damage C | Damage D |
Layer | Surface layer | Surface layer | Basal layer | Basal layer |
Volume (cm3) | 10×10×1 | 10×20×1 | 10×10×1 | 10×20×1 |
On-site detection (B-Scan) |  |  | 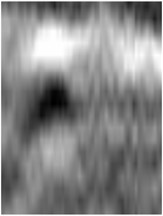 | 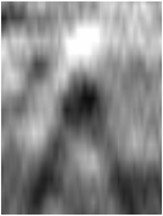 |
On-site detection (A-Scan) | 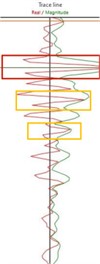 | 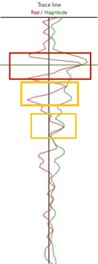 | 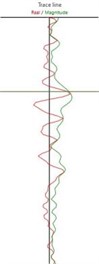 | 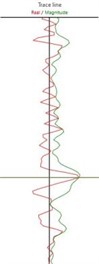 |
On-site detection (Cross-section) | 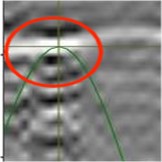 | 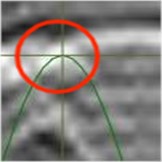 | 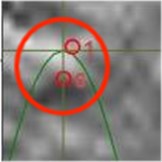 | 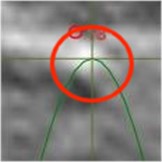 |
On-site detection (Horizontal section) | 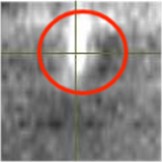 |  |  |  |
As can be seen from Table 7, the characteristics of the B-Scan, A-Scan, cross section and horizontal section of the air-water devoid are basically the same as those of the air-filled devoid. The difference is that in the B-Scan, there is an additional reflected wave. This is consistent with the results of the FDTD forward simulation of air–water devoid.
3.3. Devoid characteristics analysis
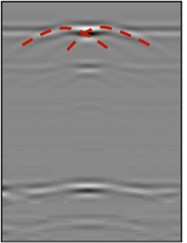
In the devoid characterization, two typical devoid patterns “upward-convex” and “down-concave” were identified in the FDTD simulation and the B-Scan test. From ground-penetrating radar theory, it is clear that when the radar signal reaches an interface with a difference in relative permittivity, part of the electromagnetic wave is reflected. Only then do anomalous areas appear on the radar image. It follows that the radar signal is not only reflected at the upper and lower edges of the decoupling, but is also emitted at the left and right edges. When the two hyperbolas on the left and right edges are too close together and overlap, an “upward-convex” pattern appears, as shown in Fig. 4.
Fig. 4a) Simulated and b) surveyed “upward-convex” type devoid waveform
a)
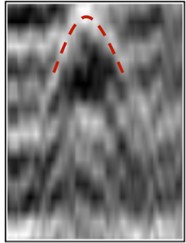
b)
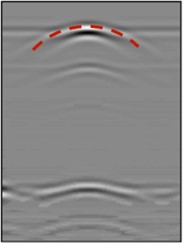
As the horizontal size of the debris increases, the double curves from the left and right edges of the debris become farther apart and the two double curves no longer overlap, forming a “down-concave” graphic feature, as shown in Fig. 5.
Fig. 5a) Simulated and b) surveyed “down-concave” type devoid waveform
a)
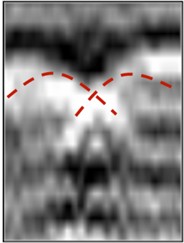
b)
The ability to distinguish between the two signals at the left and right edges of the devoid depends on the resolution of the ground–penetrating radar. The horizontal resolution of the ground-penetrating radar depends on the extent to which the beam is scanned over the target. Narrower bandwidths and smaller step sizes provide better spatial resolution. A simplified model developed by Annan & Cosway was used to calculate the scanning range of ground–penetrating radar with respect to the first fresnel zone (FFZ) [16], please refer to Eq. (1):
where is the FFZ radius, is the depth and is the wavelength.
The wavelength equation please refer to Eq. (2):
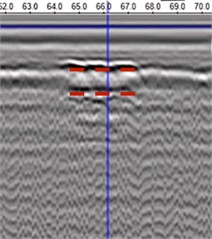
From Eqs. (1) and (2), it can be concluded that the waveform characteristics of a devoid in a 3D-Radar pattern depend on its horizontal size. When the horizontal size of the devoid is about 6 times , the reflection shows an “upward-convex” waveform. When the horizontal size of the devoid is greater than 11 times , the waveform is “down-concave”. It can also be predicted that when the level of the devoid is much larger than the ground-penetrating radar sweep, the reflections from the two edges will be completely separated, giving a “straight” waveform, as shown in Fig. 6.
Fig. 6Straight type devoid waveform
4. Engineering verifications of pattern recognition methods
The object of the inspection is the highway of the relying project. Among the large number of ground-penetrating radar images collected, after locating the abnormal area, two different types of damage images were selected for analysis and processing, and the specific information is shown in Table 8.
As can be observed from the actual B-Scan image, there is an inverse reflected wave at the top of the damage A and an isotropic reflected wave at the bottom. There are also multiple bypass waves below the damage. In the A-Scan image, it can be seen that the polarity of the electromagnetic waves at the location of the damage is negative. This indicates that the relative permittivity at this location is much higher than that of the road subsurface medium and is a water-rich damage. Combined with the cross-sectional and the horizontal section performance of the test, it is inferred that the damage type is water-filled devoid.
Fig. 7 shows the condition of the road surface and the results of the drill core sampling for damage A. After locating the condition of damage A, no abnormalities were found on the road surface and the pavement was intact and healthy. Drill cores were taken to verify that there was interlayer debonding and a high moisture content, which was fully consistent with the presumed results.
Damage B formed isotropic reflection waves at the top and bypass waves at the bottom, which appear on the radar image as a black, then white, then black striped pattern. In the A-Scan image, it can be seen that isotropic reflective waves were generated at the location of the damage and that no bypass waves were present, indicating that the damage does not contain water. In addition, it can be clearly observed that the intensity of the reflected waves at the surface layer is greater than that of the basal layer. It can be seen that in the application, a circular highlighted area can be clearly observed in the test horizontal section, inferring the type of the damage to be an air-filled devoid.
Table 8Results of the air-water devoid test surveys
Name | Damage A | Damage B |
Actual detection (B-Scan) | 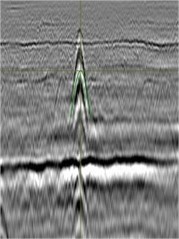 | 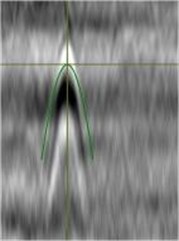 |
Actual detection (A-Scan) | 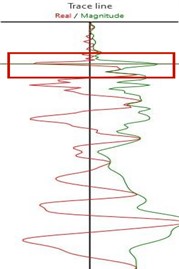 | 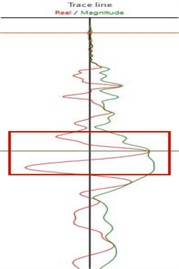 |
Actual detection (Cross-section) | 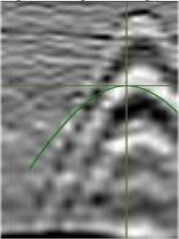 | 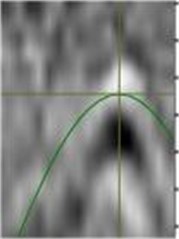 |
Actual detection (Horizontal section) | 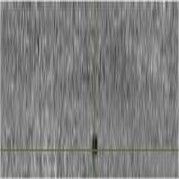 |  |
Fig. 8 shows the condition of the road surface and the results of the drill core sampling for damage B. Damage B also showed no abnormalities on the road surface. Drill core sampling was carried out to verify the presence of interlayer devoid, which is fully consistent with the presumed results.
After the engineering verification of the above two damages, it is found that when the surface layer of the road is not abnormal, and it is difficult to detect the damages in time according to the traditional detection methods, the 3D-Radar has a certain sensitivity to the identification of non-destructive deconstructive damages on the road surface. The proposed waveform characteristics of the devoid damage are also feasible and accurate for identifying devoid damage in radar mapping.
Fig. 7Drill core sampling results of damage A
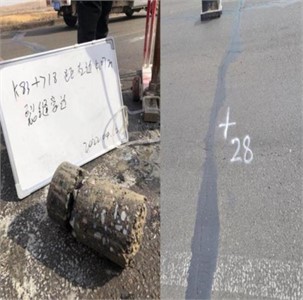
Fig. 8Drill core sampling results of damage B
5. Conclusions
In this paper, we quantitatively investigated the undamaged deconstructed pavement damage, including different sizes, locations, and types, through 3D-Radar's orthorectified simulation, damage burial test and engineering validation methods. The main conclusions drawn are as follows:
1) The main image characteristics of the air-filled devoid are: isotropic reflections at the top of the devoid in the A-Scan image. The bottom part of the image shows an inverse reflection wave. In the B-Scan image, a black-white-black stripe pattern can be seen. A circular highlighted area can be clearly observed in the horizontal section.
2) The main image characteristics of water-filled devoid are: Inverse reflective waves at the top of the devoid in the A-Scan image. At the bottom, there is an isotropic reflection wave. There are also multiple bypass waves. In the B-Scan image, the pattern is white-black-white stripes.
3) The waveform characteristics of a devoid depend on its horizontal dimensions. When the horizontal size of the devoid is approximately 6 times the radius of the FFZ, the reflections show an “up-convex” waveform. When the horizontal size of the devoid is greater than 11 times the radius of the FFZ, the waveform appears “down-concave'”. When the horizontal size of the devoid is much larger than the scanning range of the ground-penetrating radar, the reflections of the two edges will be completely separated, showing a “straight” waveform.
4) Through forward simulations, on-site tests and engineering verification, the appearance of the devoid features in the 3D–Radar mapping will enhance the confidence of devoid identification.
References
-
L. B. Wang, H. X. Wang, Q. Zhao, and H. L. Yang, “Development and prospects of intelligent pavement,” (in Chinese), Journal of Chinese Highways, Vol. 32, No. 4, pp. 50–72, 2019, https://doi.org/10.19721/j.cnki.1001
-
X. L. Liu and S. D. Wu, “Research on road asphalt pavement diseases and detection technology,” (in Chinese), Science and Technology Innovation and Application, Vol. 12, No. 30, pp. 169–172, 2022, https://doi.org/10.19981/j.cn23
-
L. Zhang, T. Xia, J. Tian, L. Jiao, and X. Cao, “Study of GPR signal propagation and imaging of multilayer rebar mesh structure,” Nondestructive Characterization and Monitoring of Advanced Materials, Aerospace, Civil Infrastructure, and Transportation XII, Vol. 10599, p. 105991A, Mar. 2018, https://doi.org/10.1117/12.2296457
-
Y. M. Zhang, F. Bao, and Z. Tong, “Radar wave response of the bottom debonding of cement pavement panels in non-homogeneous machine fields,” (in Chinese), Journal of Southeast University (Natural Science Edition), Vol. 53, No. 1, pp. 137–148, 2022, https://doi.org/10.3969/j.issn.1001
-
O. Apaydın, T. Işseven, Y. Çıtır, S. Paker, I. Erer, and N. G. Aydın, “Extracting tomographic images of interior structures of cylindrical objects and trees using Ground Penetrating Radar method,” Results in Engineering, Vol. 14, p. 100410, Jun. 2022, https://doi.org/10.1016/j.rineng.2022.100410
-
H. Liu, C. Lin, J. Cui, L. Fan, X. Xie, and B. F. Spencer, “Detection and localization of rebar in concrete by deep learning using ground penetrating radar,” Automation in Construction, Vol. 118, p. 103279, Oct. 2020, https://doi.org/10.1016/j.autcon.2020.103279
-
T. X. H. Luo and W. W. L. Lai, “GPR pattern recognition of shallow subsurface air voids,” Tunnelling and Underground Space Technology, Vol. 99, p. 103355, May 2020, https://doi.org/10.1016/j.tust.2020.103355
-
Y. Wang, G. Cui, and J. Xu, “Semi-automatic detection of buried rebar in GPR data using a genetic algorithm,” Automation in Construction, Vol. 114, p. 103186, Jun. 2020, https://doi.org/10.1016/j.autcon.2020.103186
-
S. H. Zhong, Ground Penetrating Radar Geological Exploration and Detection Technology. Shanghai Science and Technology Press, 2016.
-
U. Ozkaya, F. Melgani, M. Belete Bejiga, L. Seyfi, and M. Donelli, “GPR B scan image analysis with deep learning methods,” Measurement, Vol. 165, p. 107770, Dec. 2020, https://doi.org/10.1016/j.measurement.2020.107770
-
T. B. Kelly, M. N. Angel, D. E. O. ’Connor, C. C. Huff, L. E. Morris, and G. D. Wach, “A novel approach to 3D modelling ground-penetrating radar (GPR) data – A case study of a cemetery and applications for criminal investigation,” Forensic Science International, Vol. 325, p. 110882, Aug. 2021, https://doi.org/10.1016/j.forsciint.2021.110882
-
A. M. Mohamed Mostapha, G. Alsharahi, and A. Driouach, “2D FDTD Simulation of ground penetrating radar imaging under subsurface with two different antenna types,” Procedia Manufacturing, Vol. 22, pp. 420–427, 2018, https://doi.org/10.1016/j.promfg.2018.03.066
-
Y. Li, Z. Zhao, W. Xu, Z. Liu, and X. Wang, “An effective FDTD model for GPR to detect the material of hard objects buried in tillage soil layer,” Soil and Tillage Research, Vol. 195, p. 104353, Dec. 2019, https://doi.org/10.1016/j.still.2019.104353
-
D. B. Davidson, Computational Electromagnetics for RF and Microwave Engineering. Cambridge University Press, 2010, https://doi.org/10.1017/cbo9780511778117
-
A. Giannopoulos, “Modelling ground penetrating radar by GprMax,” Construction and Building Materials, Vol. 19, No. 10, pp. 755–762, Dec. 2005, https://doi.org/10.1016/j.conbuildmat.2005.06.007
-
T. X. H. Luo, W. W. L. Lai, and A. Giannopoulos, “Forward modelling on GPR responses of subsurface air voids,” Tunnelling and Underground Space Technology, Vol. 103, p. 103521, Sep. 2020, https://doi.org/10.1016/j.tust.2020.103521
Cited by
About this article

The authors have not disclosed any funding.
The datasets generated during and/or analyzed during the current study are available from the corresponding author on reasonable request.
Yongxiang Li: conceptualization, formal analysis, funding acquisition, supervision, validation, writing-review and editing. Xiatong Kang: investigation, methodology, software, visualization, writing-original draft preparation. Shaomeng Sheng: resources. Changjiang Fu: project administration.
The authors declare that they have no conflict of interest.
