Abstract
The destabilizing motion characteristics of the hyperbolic cooling tower in demolition blasting are thoroughly investigated through the establishment of a numerical simulation calculation model, leading to the following conclusions regarding its destabilizing motion. The tensile-compression elastic-plastic model, which possesses the characteristics of parameter modification function and independence from unit size, can more effectively capture the mechanical properties of concrete materials and find better application in the simulation and calculation research of reinforced concrete structures. The self-oscillation frequency check and collapse morphological analysis are employed to validate the accuracy of the simulation calculation model for hyperbolic cooling towers, as well as to assess the rationality of parameters in the tensile-compression elastic-plastic model. The collapse of a cooling tower induces flexural deformation in the lateral wall, tensile disturbance in the upper and middle sections of the cylinder, and compressive disturbance in the vertical cross-section. The cylinder body has incurred damage as a result of the tower wall’s front end striking the ground at the directional window position on the front side of the throat, leading to a significant extrusion deformation issue. The buckling deformation in the central and lower sections of the rear wall propagated towards the back side of the tower wall upon reaching the ground, ultimately resulting in an “inverted V-shaped” damage along the buckling deformation line. The research findings hold significant relevance for future endeavors.
Highlights
- The tensile-compression elastic-plastic model, which possesses the characteristics of parameter modification function and independence from unit size, can more effectively capture the mechanical properties of concrete materials and find better application in the simulation and calculation research of reinforced concrete structures.
- The self-oscillation frequency check and collapse morphological analysis are employed to validate the accuracy of the simulation calculation model for hyperbolic cooling towers, as well as to assess the rationality of parameters in the tensile-compression elastic-plastic model.
- During the collapse of the cooling tower, bending deformation occurs in the side wall, tensile disturbance mainly occurs in the upper and middle part of the cylinder, and compression disturbance mainly occurs in the vertical section. the directional window will further aggravate the disturbance and deformation of the barrel.
1. Introduction
The national “green low-carbon” and “energy saving and emission reduction” policy necessitates the dismantling of numerous substandard hyperbolic cooling towers in power plants through controlled demolition. Due to the typical urban location of cooling towers, limited demolition sites, and stringent safety requirements, the field of demolition and blasting engineering faces significant challenges in demolishing cooling towers. Consequently, numerous scholars have conducted research on methods for cooling tower demolition. Luo Weitao et al. [1] successfully dismantled a hyperbolic cooling tower through a one-time blasting approach targeting the bottom herringbone column with lower blast height. The findings suggest that the “in situ collapse, mechanical wall breaking” method is feasible and reliable for demolishing hyperbolic cooling towers under challenging conditions where the collapse range is limited. The study conducted by Fu Tianjie et al. [2] examined the characteristics of a hyperbolic cooling tower with a large volume, low center of gravity, and a significant height-to-diameter ratio. They concluded that implementing a blasting and demolition design scheme involving a substantial incision and pre-opened directional window can result in the violent collapse, crushing, and disintegration of the hyperbolic cooling tower. Zhang Jichun et al. [3] employed mechanical dismantling to create a series of vertical slits with a specific height on the cooling tower wall in the direction of its potential collapse. This technique transforms the tower wall between two adjacent vertical slits into an independent thin-walled column, effectively reducing the overall stiffness of the hyperbolic cooling tower while ensuring its stability against collapse. Gao Wenle et al. [4] utilized blasting techniques to demolish a 62 m hyperbolic cooling tower at Dachang Textile Factory and observed that the tower gradually tilted forward after the formation of a notch. Upon closure of the notch, the front half of the tower wall ceased tilting forward while the back half continued to move forward. During collapse, a flattened extrusion deformation occurred first followed by seated disintegration. The study conducted by Zhang Jianhua et al. [5] involved the controlled demolition of a 105 m hyperbolic cooling tower in Qianbei power plant using a triangular notch and revealed that, upon formation of the notch, the cooling tower exhibited flexion and tilting motion during descent. Subsequently, closure of the notch resulted in noticeable flexion deformation along the sidewalls of the cooling tower, ultimately leading to its fragmentation and disintegration during continued descent. Li Yong et al. [6] employed a trapezoidal blasting notch to demolish a 105-meter hyperbolic cooling tower within a power plant. They observed that upon formation of the notch, the stability of the cooling tower was compromised, resulting in an intentional downward tilt as planned. Subsequently, closure of the notch led to initial cracking and crushing of the lower and middle sides of the front wall through buckling, ultimately causing collapse and disintegration of the cooling tower in their intended direction. The study conducted by Zhang Peiping et al. [7] utilized an inverted trapezoidal blasting notch to demolish a 60 m hyperbolic cooling tower at Xinyuan Power Plant. It was observed that the support herringbone column failed immediately after the formation of the notch, resulting in vertical displacement and an inclination towards collapse of the tower wall. Subsequently, upon closure of the notch, destabilization occurred in the tower wall leading to its collapse along the intended design direction, while simultaneously experiencing flexural deformation, disintegration, and crushing of the sidewalls. Xia Weiguo et al. [8] utilized a composite blasting notch to initiate controlled demolition of a 90 m hyperbolic cooling tower at the Laiwu power plant, and observed that subsequent to the formation of the notch, the cooling tower underwent progressive settlement. Upon closure of the notch, initial flexural deformation was evident in the sidewall; subsequently, this flexural deformation exacerbated leading to structural collapse and disintegration of the cooling tower. Xie Chunming et al. [9] utilized the separable co-nodal modeling approach and employed the MAT_003 material to conduct numerical calculations for slit design in the blast demolition of a double-curved cooling tower. The findings demonstrate that the separated model enables independent analysis of mechanical properties pertaining to both reinforcement and concrete components. Moreover, employing the cut-seam design technique can effectively reduce downtime of cooling towers while enhancing the degree of flexural deformation exhibited by their walls. Gao Wenle et al. [10] employed the MAT_096 material and an integral modeling approach to numerically simulate the blast demolition of Shiliquan Power Plant’s 92 m double-curve cooling tower. A comparison between numerical findings and actual explosion effects reveals that the numerical calculations closely align with the real destruction caused by blasting procedures, albeit without accounting for mechanical changes in the concrete and reinforcing elements. Xu Pengfei et al. [11] utilized MAT_096 material and a comprehensive modeling approach to simulate the blasting and demolition process of Guodian Shuangyashan’s 90 m cooling tower. The results demonstrate that the presence of high unloading slot composite notches can modify the stress distribution along the tower wall, enhance flexural deformation, restrict the extent of blasting effects, and reduce ground vibration caused by blasting impacts. The blast demolition project of a hyperbolic cooling tower was numerically computed by Zhan Zhenchan et al. [12] using the MAT_003 material and employing a separated common-node modeling technique. The motion pattern of the tower collapse was examined, revealing that the separated common-node model accurately represents the mechanical properties of the cooling tower during its collapse. The MAT_096 material and the integral modeling approach were employed by Liu Wei et al. [13] to calculate the blast demolition of an 84.8 m hyperbolic cooling tower at the Luoyang Power Plant. The calculation time essentially represents the cooling tower collapse process, including incision development, closure, tower wall buckling deformation, collapse, and disintegration. However, there is a delay of approximately 1.0 s compared to the actual collapse time. The delay in modeling the collapse time can be attributed to numerous simplifications made during the simulation process, which have resulted in a lack of accuracy and precision.
In conclusion, despite the extensive investigation conducted by numerous experts and academics on the collapse phenomenon of hyperbolic cooling towers, there are limitations in the research methods employed and insufficient depth in studying the unstable motion during the process of cooling tower collapse. To provide guidance for comparable engineering practices, this study introduces the tensile-compression elastic-plastic material model to simulate and analyze the unstable motion of cooling towers based on an actual hyperbolic cooling tower demolition project.
2. Tensile-compression elastic-plastic constitutive model
2.1. Theory of tensile-compression elastic-plastic constitutive model
The tensile-compression elastic-plastic model, which possesses the characteristics of element size independence and offers the advantages of customizable principal models, demonstrates a superior ability to accurately depict the mechanical properties of concrete materials when compared with other concrete material models in the DYNA material library [14]. The Von-Mises yield criterion serves as the assessment standard for material failure within this model:
where: is the second bias stress tensor invariant; is the yield stress; is the effective plastic strain; is the plastic hardening modulus.
The yield stress and effective plastic strain in the two states of tensile and compressive are represented by the two load curves defined by this model, and , respectively. It is chosen whether to follow the compression curve or the tensile curve when these two pressure values, pt and pc, are exceeded. The weighted average of the two curves is utilized if the pressure is in the range between these two values. This can be said in the following way:
where: is the tensile yield stress and effective plastic strain curve; is the compressive yield stress and effective plastic strain curve; is the tensile stress cut-off value; is the compressive stress cut-off value; is the weighted average; is the damage variable related to plastic strain; is the damage variable related to pressure.
2.2. Parameters of the tensile-compression elastic-plastic constitutive model
The tensile-compression elastic-plastic model has 22 parameters, as shown in Table 1.
Table 1Parameters of the tensile-compression elastic-plastic material model
Card1 | MID | RO | E | PR | C | P | FAIL | TDEL |
Card2 | LCIDC | LCIDT | LCSRC | LCSRT | SRFLAG | LCFAIL | EC | RPCT |
Card3 | PC | PT | PCUTC | PCUTT | PCUTF | |||
Card4 | K |
In the table: MID is the material number; RO is the material density; E is the material modulus of elasticity; PR is the Poisson’s ratio; C and P are the strain rate parameters; FAIL is the material failure parameter; TDEL is the minimum time step parameter; LCIDC is the compressive load curve; LCIDT is the tensile load curve; LCSRC is the compressive strain rate curve; LCSRT is the tensile strain rate curve. SRFLAG is the rate effect algorithm; LCFAIL is the material failure curve; EC is the material compressive modulus of elasticity; RPCT is the mean stress parameter; PC is the compressive mean stress; PT is the tensile mean stress; PCUTC is the compressive stress truncation; PCUTT is the tensile stress truncation; PCUTF is the stress truncation activation parameter; K is the bulk modulus.
For using the model for numerical simulation computations, a minimum of eight parameters (RO, E, PR, FAIL, LCID, LCIDT, LCSRC, LCSRT) must be established, with the system default values being utilized for the remaining parameters.
2.3. Verification of the applicability of the tensile-compression elastic-plastic model
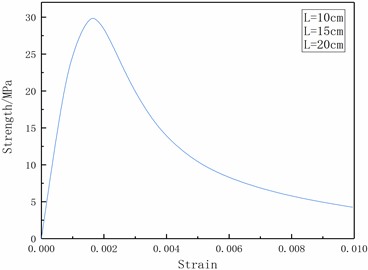
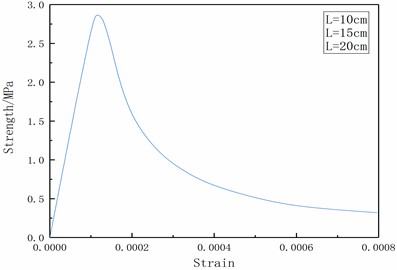
For the numerical calculations of the reliability research, the displacement controlled element loading method is utilized with the C30 concrete model and a positive hexahedral solid element with a side length of 150 mm. The Reinforced Concrete Code is used to determine the material characteristics. Uniaxial tensile, uniaxial compression, triaxial compression, and element size effect tests were done on the single element, respectively. In addition, the element was subjected to strain rate testing for uniaxial compression and tensile at strain rates of 10-5S-1 and 10-2S-1, respectively. Fig. 2 displays the model testing' outcomes.
Fig. 1Test element geometry model and finite element model
As seen in Fig. 2, the tensile-compression elastic-plastic material model can simulate the mechanical properties of concrete materials under a variety of circumferential pressure conditions, including uniaxial tension, uniaxial compression, triaxial compression, and different circumferential pressure conditions. It also has the advantage of being independent of the unit size effect, which can make it better applied to the numerical calculation of demolition of concrete-like building structures.
Fig. 2tensile-compression elastic-plastic model test
a) Uniaxial tensile stress-strain curve
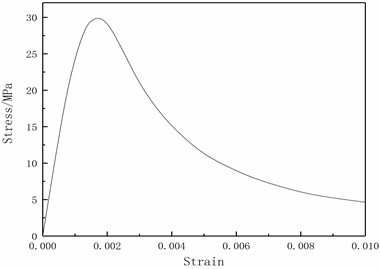
b) Uniaxial compression stress-strain curve
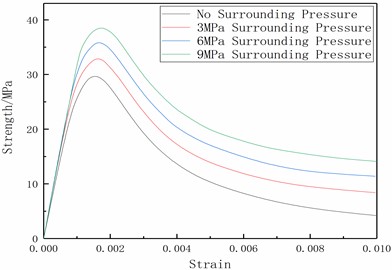
c) Triaxial compression stress-strain curve
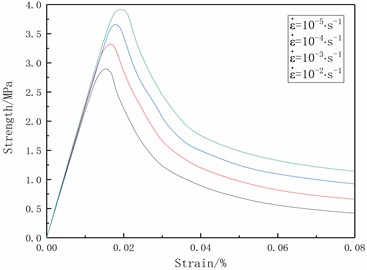
d) Strain rate effect under tension
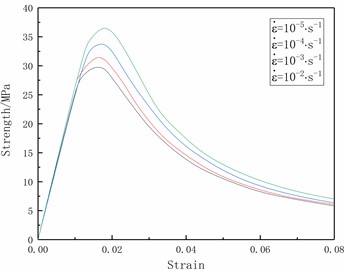
e) Strain rate effect under compression
f) Compression dimensional effect on the element
g) Tensile dimensional effect on the element
Table 2Mechanical parameters of C30 concrete
RO | E | PR | FAIL |
2500 kg/m3 | 30 GPa | 0.255 | 0.016 |
LCIDC | LCIDT | ||
0.00 | 0.00 MPa | 0.00 | 0.00 MPa |
9.18×10⁻⁶ | 12.90 MPa | 2.14×10⁻⁷ | 1.49 MPa |
8.58×10⁻⁵ | 22.60 MPa | 1.05×10⁻⁶ | 2.07 MPa |
1.71×10⁻⁴ | 26.00 MPa | 4.33×10⁻⁶ | 2.57 MPa |
2.93×10⁻⁴ | 28.40 MPa | 1.41×10⁻⁵ | 2.88 MPa |
4.50×10⁻⁴ | 29.70 MPa | 1.67×10⁻⁴ | 2.02 MPa |
6.37×10⁻⁴ | 30.00 MPa | 2.01×10⁻⁴ | 1.48 MPa |
2.99×10⁻³ | 16.30 MPa | 2.46×10⁻⁴ | 1.16 MPa |
5.22×10⁻³ | 9.21 MPa | 3.06×10⁻⁴ | 0.87 MPa |
7.30×10⁻³ | 6.26 MPa | 3.76×10⁻⁴ | 0.69 MPa |
9.34×10⁻³ | 4.71 MPa | 5.54×10⁻⁴ | 0.47 MPa |
3. Simulation modeling for numerical calculation of hyperbolic cooling tower
3.1. Numerical modeling
3.1.1. Project overview
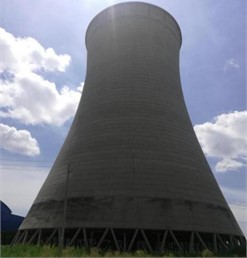
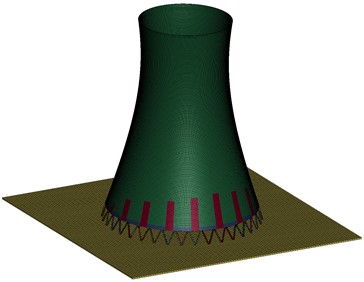
A power plant's double-curved cooling tower required to be destroyed by blasting in order to comply with the national “low carbon emission reduction” development policy. The cooling tower has a total of 36 pairs of herringbone columns with a height of 4.8 m, spacing of 5.36 m, and cross-sectional dimensions of 0.4 m×0.4 m. It is a double-curved, thin-walled reinforced concrete structure with a height of 75 m, concrete grade C30, a top radius of 18.38 m, and a bottom radius of 30.76 m. Herringbone columns are reinforced at a rate of 0.48 %, and tower walls at a rate of 0.63 %. Fig. 3 depicts the double-curved cooling tower that needs to be dismantled.
Fig. 3Double curve cooling tower to be dismantled
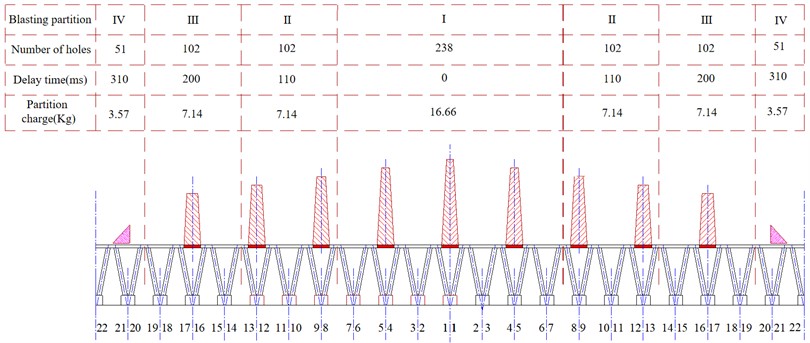
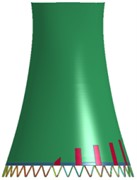
3.1.2. Blasting design program
The double curve cooling tower blasting demolition program was created in accordance with the cooling tower design drawings, the cooling tower blasting demolition location, and the surrounding environment. Table 3 lists the relevant parameters.
Table 3Incision design parameters
Incision elements | Incision parameters |
Incision shape | Composite incision |
Incision angle | 220° |
Incision height | 17.3 m |
Time Difference Settings | 8 explosive areas 4 segments |
Table 4Cooling tower herringbone column blasting parameters
Geometric size / m | Hole depth / m | Hole distance / m | Hole layout | Single hole dosage / g | Number of holes | Total Explosives / kg |
0.40×0.40 | 0.27 | 0.3 | Single row | 70 | 748 | 52.36 |
Fig. 4Cooling tower cutout time difference parameters
3.1.3. Numerical model building
In order to establish a reasonable numerical model of double-curved cooling tower demolition, herringbone column, and tower wall models are established respectively, and the keyword *CONSTRAINED- NODAL-RIGID-BODY is used to treat the nodes of the connection surface as nodal rigid bodies at the interface between the herringbone column and the ring beam, and the transfer of forces and displacements in the two regions is achieved by controlling the coordination of the displacements and corners of these nodal rigid bodies.
The literature [15] is cited to consider the role of reinforcement rate, and the parameters of the herringbone column and tower wall are finally determined as shown in Table 5 and Table 6, respectively. The density of the herringbone column, ring beam, and tower wall is 2400 kg/m3 and Poisson’s ratio is 0.2. A rigid body model is used for the ground. Automatic single-sided contact is used between the herringbone column and the tower wall and the ground.
Table 5Concrete material parameters for herringbone columns
RO | E | PR | FAIL |
2400 kg/m3 | 31.02GPa | 0.20 | 0.02 |
LCIDC | LCIDT | ||
0.0000 | 3.03MPa | 0.00 | 1.20 MPa |
1.47×10⁻³ | 33.73 MPa | 9.00×10⁻⁵ | 2.57 MPa |
3.69×10⁻³ | 30.02 MPa | 1.16×10⁻⁴ | 2.90 MPa |
6.35×10⁻³ | 24.65 MPa | 1.86×10⁻⁴ | 1.71 MPa |
8.96×10⁻³ | 20.75 MPa | 2.36×10⁻⁴ | 1.23 MPa |
1.15×10⁻² | 17.97 MPa | 2.86×10⁻⁴ | 0.96 MPa |
1.41×10⁻² | 15.90 MPa | 3.36×10⁻⁴ | 0.79 MPa |
1.66×10⁻² | 14.31 MPa | 3.86×10⁻⁴ | 0.67 MPa |
1.91×10⁻² | 13.05 MPa | 4.36×10⁻⁴ | 0.59 MPa |
2.16×10⁻² | 12.03 MPa | 4.86×10⁻⁴ | 0.53 MPa |
2.40×10⁻² | 11.17 MPa | 5.36×10⁻⁴ | 0.48 MPa |
2.65×10⁻² | 10.45 MPa | 9.86×10⁻⁴ | 0.28 MPa |
Table 6Concrete material parameters of tower wall
RO | E | PR | FAIL |
2400 kg/m3 | 31.22 GPa | 0.20 | 0.02 |
LCIDC | LCIDT | ||
0.00 | 2.97 MPa | 0.00 | 0.30 MPa |
5.18×10⁻⁴ | 13.82 MPa | 2.14×10⁻⁷ | 1.49 MPa |
8.58×10⁻⁴ | 22.35 MPa | 1.05×10⁻⁶ | 2.07 MPa |
1.21×10⁻³ | 26.92 MPa | 4.33×10⁻⁶ | 2.57 MPa |
1.43×10⁻³ | 29.21 MPa | 1.41×10⁻⁵ | 2.88 MPa |
2.80×10⁻³ | 34.70 MPa | 1.67×10⁻⁴ | 2.02 MPa |
3.77×10⁻³ | 33.62 MPa | 2.01×10⁻⁴ | 1.48 MPa |
5.99×10⁻³ | 31.12 MPa | 2.46×10⁻⁴ | 1.16 MPa |
6.72×10⁻³ | 27.54 MPa | 3.06×10⁻⁴ | 0.87 MPa |
1.04×10⁻² | 21.74 MPa | 3.76×10⁻⁴ | 0.69 MPa |
1.99×10⁻² | 14.39 MPa | 5.54×10⁻⁴ | 0.47 MPa |
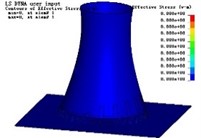
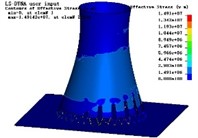
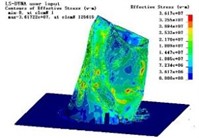
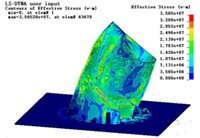
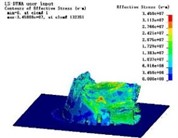
According to the above modeling ideas and parameter selection to establish the numerical simulation calculation model of the hyperbolic cooling tower, as shown in Fig. 5.
Fig. 5Calculation model of hyperbolic cooling tower
3.2. Verification of natural vibration frequency of the cooling tower
In order to verify the reasonableness of the numerical simulation model, the modal analysis of the established numerical simulation model is carried out implicitly using the solver, and the first 5 orders of modalities of the model are extracted as shown in Table 7, and the three views of the 1st order vibration pattern are shown in Fig. 6.
Table 7The first 5 orders of the cooling tower structural vibration model
Vibration type | Frequency (Hz) | Vibration description |
1 | 1.44 | Structure 1st order vertical vibration |
2 | 1.44 | Structure 2nd order vertical vibration |
3 | 1.47 | Structure 3rd order vertical vibration |
4 | 1.47 | Structure 4th order vertical vibration |
5 | 1.75 | Structure 5th order vertical vibration |
The minimum natural vibration frequency of a hyperbolic cooling tower can be calculated using the following empirical formula [15]:
where: is the minimum cylinder wall thickness; is the minimum cylinder body diameter.
According to the design parameters of the double-curved cooling tower, the natural vibration frequency of the cooling tower can be calculated from the empirical formula as 1.31 Hz. Literature [16] found that if only the effect of the minimum natural vibration frequency of the cooling tower is considered, the increase in the calculated natural vibration frequency should be less than 10 %, and the natural vibration frequency calculated in this model meets this requirement, and it can be approximated that this calculation model can better reflect the mass distribution and stiffness characteristics of the cooling tower.
Fig. 6Three views of the 1st-order vibration pattern of the hyperbolic cooling tower

a) Three views of 1st order vibration pattern
b) 1st order vibration axis view

c) 1st order vibration axis view

d) 1st order vibration type axis view
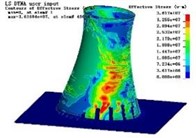
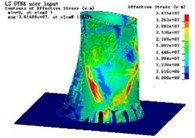
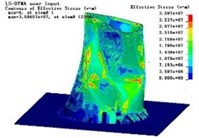
3.3. Calculation simulation verification
According to the actual blasting construction plan for the double-curved cooling tower calculation model for incision setting and gravity loading, double-curved cooling tower blasting and demolition of the actual collapse process and numerical calculation of the collapse process are shown in Fig. 7.
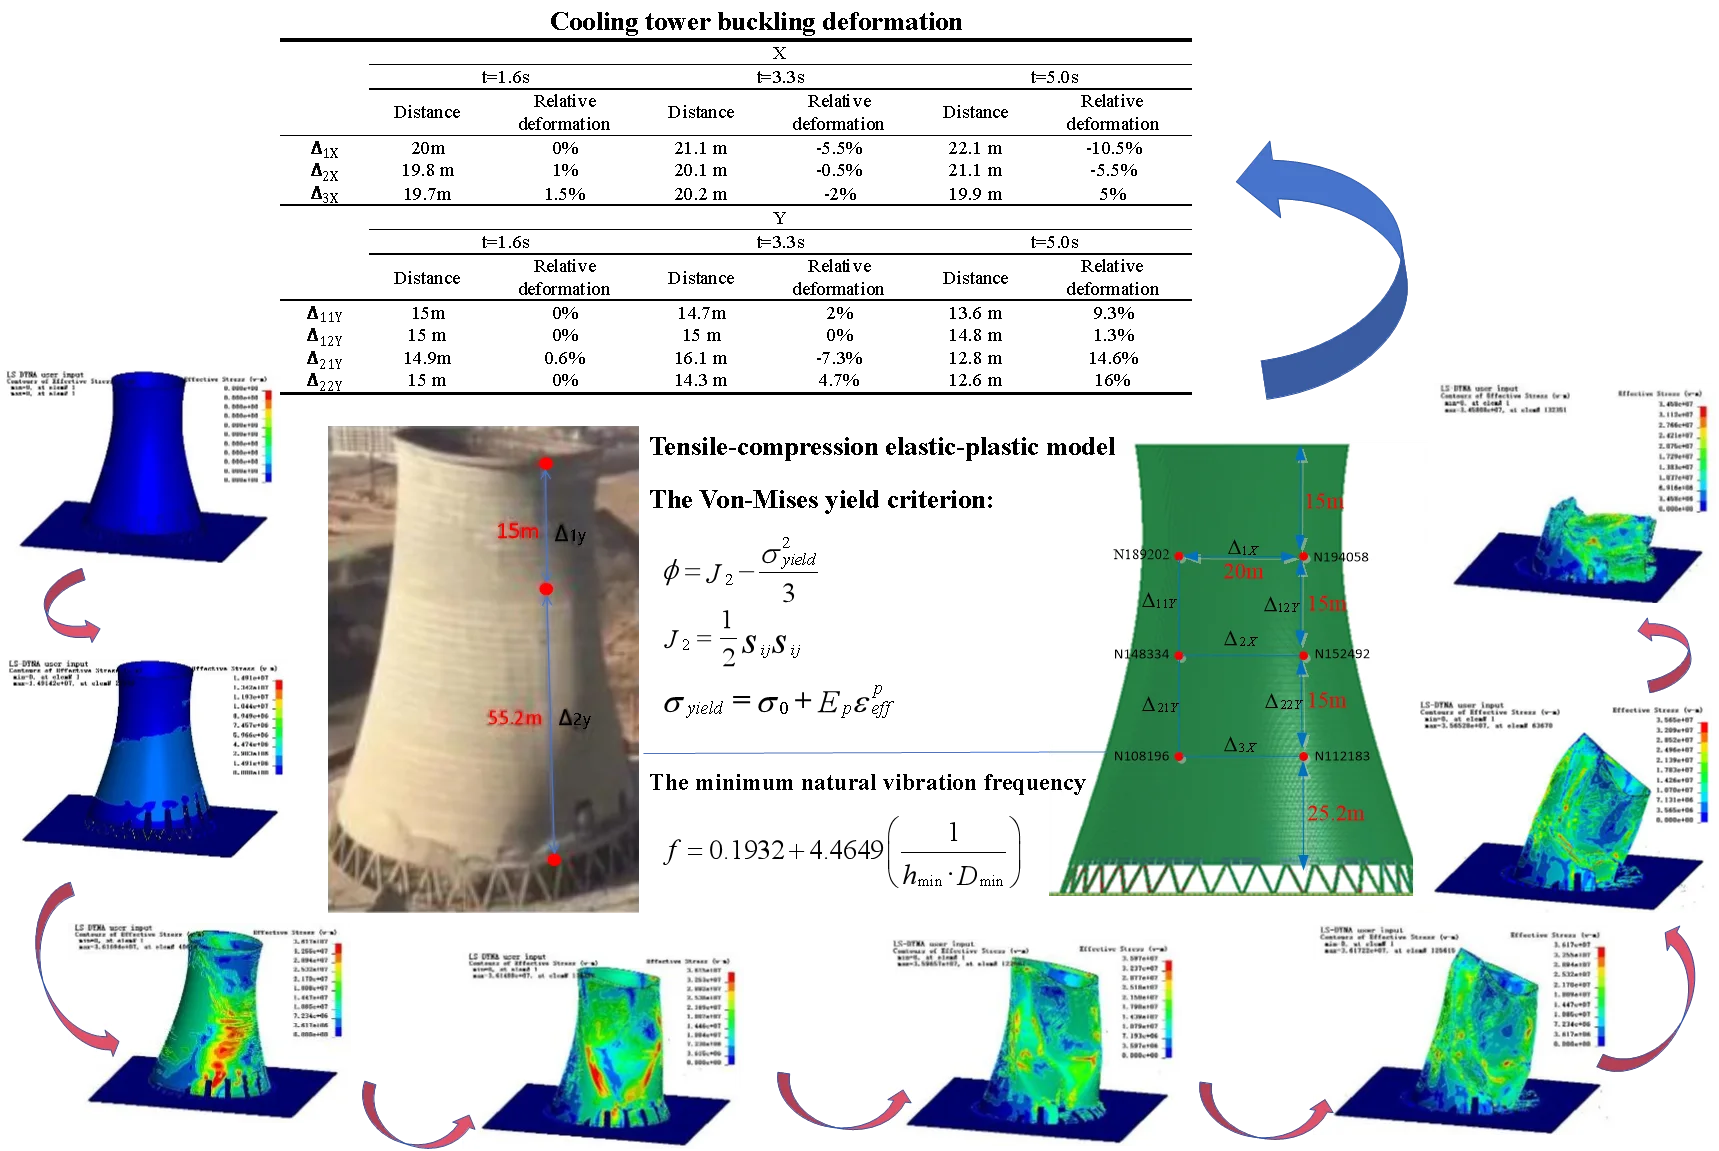
To quantitatively reflect the destabilization motion of the double-curved cooling tower in the demolition and blasting, the distances and relative deformations of the actual collapse process and the numerical calculation process of the cooling tower at 1.6 s, 3.3 s, and 5.0 s, respectively, are shown in the following table.
Table 8Relative deformation of observation points
Actual collapse process | Numerical calculation process | |||||
1.6 s | 3.3 s | 5.0 s | 1.6 s | 3.3 s | 5.0 s | |
14.6 m | 14.5 m | 14.5 m | 14.6 m | 14.6 m | 14.5 m | |
Relative deformation | 2.7 % | 3.3 % | 3.3 % | 2.7 % | 2.7 % | 3.3 % |
55 m | 54.1 m | 49 m | 54.8 m | 53.2 m | 46.1 m | |
Relative deformation | 0.36 % | 2 % | 11.23 % | 7.2 % | 3.6 % | 16.5 % |
Fig. 7 and Table 8 can be used to analyze the actual collapse process and numerically calculate the collapse process of the demolition of the double-curve cooling tower. The reserved herringbone column begins to falter at 1.6 s because it is unable to support the weight of the top construction. The cooling tower's real collapse process had a vertical relative deformation of 2.7 % for the higher displacement observation point, while the numerical computation process had a vertical relative deformation of 3.3 %.
The real vertical relative deformation of the cooling tower collapse process for the lower displacement observation point is 0.36 %, whereas the vertical relative deformation of the numerical calculation process is 7.2 %. At 2.0 s, following the incision’s closure, the tower wall exhibits plastic deformation, the tops of the tower wall columns on either side of the unloading tank show damage, and under the influence of the touchdown reaction force, there is a loss of bearing capacity due to in-plane deformation. As a result, the obvious phenomenon of flexural deformation occurs in the middle of the sidewall, and the stable structure of the double curve is damaged. The cooling tower is still collapsing at time 3.3 s. Both the vertical relative deformation of the actual collapse process and the vertical relative deformation of the cooling tower’s numerical computation process are 2.7 % for the upper displacement observation point. The actual cooling tower collapse process vertical relative deformation for the lower displacement observation point is 2 %, while the numerical calculation process vertical relative deformation is 3.6 %. At time 4.0 seconds, the cooling tower’s flexural deformation line extends to the top of the tower, and the tower wall starts to exhibit the initial folding phenomenon. Both the vertical relative deformation of the cooling tower’s actual collapse and the vertical relative deformation of the numerical computation process are 3.3 % at time 5.0 s for the highest displacement observation point. The cooling tower’s real collapse process had a vertical relative deformation of 11.23 % for the lowest displacement observation point, while the numerical computation process had a vertical relative deformation of 16.5 %. During time 6.0 s, the rear wall’s centre and the directional window’s location experienced fracture damage, leading to the formation of a “inverted V-shaped” retained part. At time 8.0 s, the cooling tower’s fracture and decomposition during the collapse process are complete, resulting in the formation of a burst pile that is only a little bit larger than the bottom diameter.
Fig. 7Actual collapse process and numerical calculation process of double-curved cooling tower


a) 0 s
b)1.6 s
c)2 s
d)3.3 s


e)4 s
f)5 s
g)6 s
h)8 s
Due to the incision formation process of the numerical calculation model using the element deletion method, which completely eliminated the support of the incision area, in addition, did not consider the air resistance, cooling tower construction quality and weathering degree of influence, the collapse process of the cooling tower numerical calculation is slightly faster than the actual collapse process, from the incision formation, incision closure, tower wall deflection touching the ground, the deformation of the tower wall flexion, to the crushing and disintegration of the tower wall, The numerical calculation process of the cooling tower and the actual collapse process did not achieve complete morphological similarity, but the actual collapse process of the cooling tower exhibited a high level of agreement with the numerical calculation results in terms of both collapse time and collapse morphology. This serves as validation for the applicability of the model in simulating concrete-type building structures.
4. The study focuses on the investigation of motion instability in cooling tower
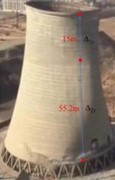
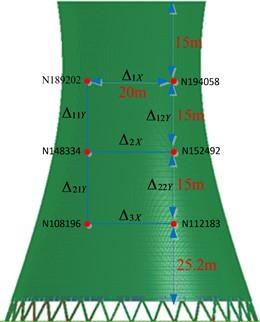
4.1. Layout of measurement points
The height direction of the cooling tower is divided into 15 m intervals, where a profile with two nodes is captured. The horizontal distance between these nodes is set at 20 m to ensure a comprehensive and systematic analysis of the buckling deformation during the collapse process. The upper profile consists of nodes N189202 and N194058, the middle profile includes nodes N148334 and N152492, while the lower profile is composed of nodes N108196 and N112183. The horizontal distances are assigned values of , , and for the node pairs N189202-N194058, N148334-N152492, and N108196-N112183 respectively. The vertical distance between nodes N189202 and N148334 is denoted as ,, the vertical distance between nodes N194058 and N152492 is denoted as , the vertical distance between nodes N108196 and N148334 is denoted as , and the vertical distance between nodes N112183 and N152492 is denoted as . The schematic representation in Fig. 9 illustrates the observation locations on the tower, enabling analysis of variations in horizontal distance at the same height and vertical distance at different heights over time.
Fig. 8Cooling tower displacement observation point schematic diagram
4.2. The study of deformation in hyperbolic cooling tower
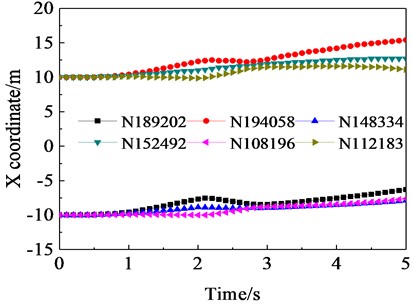
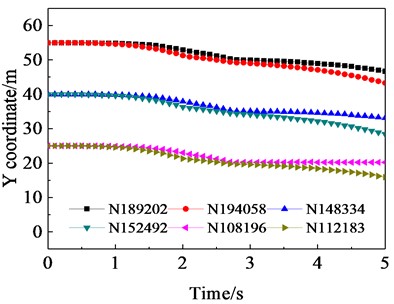
The flexural deformation in the cylinder during the cooling tower collapse process is appropriately induced by the out-of-plane disturbance. The Fig. 9 illustrates the temporal evolution of - coordinates for each measurement point in accordance with the collapse movement of hyperbolic cooling tower.
The distance and relative deformation in the -direction and -direction of each measurement point at the times of 1.6 s, 3.3 s, and 5.0 s were computed as shown in Table 9 to quantitatively analyze the destabilizing motion of the hyperbolic cooling tower during demolition blasting.
The data presented in Table 9 demonstrates the gradual inclination of the cylinder due to gravitational forces. At 1.6 s, it is observed that there is no relative deformation in the upper section, while the middle and lower sections experience a compression deformation of 1 % and 1.5 % respectively. In the direction, there was no comparable deformation observed in the upper left or right cross-sections. The lower right cross-section exhibited negligible relative -direction deformation, whereas the lower left cross-section experienced a compressive deformation of 0.6 %. At 3.3 s, the upper cross-section experiences a 5.5 % deformation in the -direction, while the middle cross-section undergoes a 0.5 % deformation in the same direction. The lower cross-section also deforms by 2 % in the -direction. In terms of -direction deformations, the top left section exhibits a compressive deformation of 2 %, whereas there is no relative deformation observed in the upper right section. On the other hand, the bottom left cross-section experiences a tensile deformation of 7.3 %, and finally, the lower right cross-section shows a compressive deformation of 4.7 % in the Y direction. At 5 s, the upper section exhibits a tensile deformation of 10.5 % in the direction, while the middle segment experiences a 5.5 % tensile deformation in the same direction. Conversely, the lower section undergoes a compressive deformation of 5 % in the direction. The upper left cross-section is subjected to a compression of 9.3 % in the direction, whereas the upper right cross-section experiences a compression of 1.3 % in that same direction. Similarly, the bottom left area is compressed by 14.6 % in the direction, while the lower right section is compressed by 16 %.
Table 9Cooling tower buckling deformation statistics
1.6 s | 3.3 s | 5.0 s | ||||
Distance | Relative deformation | Distance | Relative deformation | Distance | Relative deformation | |
20 m | 0 % | 21.1 m | –5.5 % | 22.1 m | –10.5 % | |
19.8 m | 1 % | 20.1 m | –0.5 % | 21.1 m | –5.5 % | |
19.7m | 1.5 % | 20.2 m | –2 % | 19.9 m | 5 % | |
1.6 s | 3.3 s | 5.0 s | ||||
Distance | Relative deformation | Distance | Relative deformation | Distance | Relative deformation | |
15m | 0 % | 14.7m | 2 % | 13.6 m | 9.3 % | |
15 m | 0 % | 15 m | 0 % | 14.8 m | 1.3 % | |
14.9 m | 0.6 % | 16.1 m | –7.3 % | 12.8 m | 14.6 % | |
15 m | 0 % | 14.3 m | 4.7 % | 12.6 m | 16 % | |
Fig. 9Cooling tower measurement point X-Y direction coordinate time curve
b) direction coordinate time curve
a) direction coordinate time curve
The instability and collapse of the cooling tower indicate that the in-plane deformation caused by out-of-plane perturbation destabilizes both the horizontal and vertical directions of the side wall. Additionally, it can be observed that tensile perturbations primarily affect the upper and middle sections of the cylinder, while compressive perturbations mainly impact the vertical section. The upper section is undergoing tensile deformation in the horizontal direction, with the intensity of deformation gradually increasing. The middle section initially experiences compression and then transitions to tensile deformation. Lastly, the lower section undergoes a process of compression-tension-compression deformation. The upper left section underwent compression, with the deformation gradually intensifying in the vertical direction. The upper right section experienced a smaller compression deformation. The lower left section went through compression-extension-compression deformation. Lastly, the compression process of the lower right section gradually intensified. The upper part experienced the most severe deformation, followed by the middle section, and the lower section had the least severe deformation. The bottom right section exhibited the most serious distortion, while the lower left section showed the second most serious deformation. The upper left section displayed a smaller degree of deformation, and finally, the upper right section had the smallest amount of deformation.
5. Conclusions
The simulated calculation of the blast demolition of a hyperbolic cooling tower can provide the following findings based on the actual project.
1) The tensile-compression elastic-plastic model exhibits unit size independence while also accurately representing the uniaxial, multiaxial, and rate-dependent mechanical properties of concrete materials. This lays a solid foundation for the development of high-efficiency numerical models applicable to large-scale structures.
2) Developed a numerical calculation model for hyperbolic cooling towers, which accurately calculates the self-oscillation frequency, verifies the accuracy of mass distribution and stiffness characteristics, and further validates the model through comparative analysis of actual collapse processes and numerical calculations in terms of collapse time and morphology. Moreover, it serves to validate the scientific and effective nature of the principal model and material parameters utilized in this research, thereby providing a valuable point of reference for similar projects.
3) When a cooling tower collapses, it induces flexural deformation in the lateral wall, tensile perturbation in the upper and middle sections of the cylinder, and compressive perturbation in the vertical segment. Upon contact of the leading edge of the tower wall with the ground, a severe extrusion deformation phenomenon occurs from the position of orientation window to the frontal side of throat. The buckling deformation caused in the center and lower section of the rear wall continued to the back side of the tower wall when the rear wall impacted the ground, and finally “inverted V-shaped” damage occurred along the buckling deformation line.
References
-
S. X. Xu and Z. Chen, “Blasting demolition technology and vibration monitoring of two 90m-high cooling towers in complex environment,” Advanced Materials Research, Vol. 591-593, No. 2, pp. 2095–2099, Nov. 2012, https://doi.org/10.4028/www.scientific.net/amr.591-593.2095
-
T.-J. Fu, Q.-J. Wang, and G. Liu, “Controlled explosive demolition of 123 m hyperbolic cooling tower,” Blasting, Vol. 29, No. 3, pp. 83–85, 2012.
-
J.-C. Zhang et al., “Controlled explosive demolition of 106.6m reinforced concrete cooling tower in Chengdu Huaneng Plan,” Blasting, Vol. 27, No. 1, pp. 58–63, 2010.
-
W.-L. Gao et al., “Fast demolition of a 62m high cooling tower by simplifying the blasting cuts,” Engineering Blasting, Vol. 3, pp. 57–59, 2008.
-
J.-H. Zhang et al., “Numerical research on effect of small-notch blasting technology on explosion demolition of cooling tower,” Blasting, Vol. 36, No. 2, pp. 85–91, 2019.
-
Y. Li, “Numerical simulation and application of demolition blasting collapse process of high rise building,” Guizhou University, Guiyang, 2016.
-
P. Zhang, “Numerical simulation study on blast induced collapse of thin wall tubular structures using LS-DYNA,” Shandong University of Science and Technology, Qingdao, 2008.
-
W. Xia, S. Wu, and C. Shi, “Five cooling towers of Huaneng Laiwu Power plant were demolished by blasting,” Explosive Materials, Vol. 40, No. 1, pp. 38–40, 2011.
-
C. Xie, J. Yang, and L. Xue, “Numerical simulation of blasting demolition of tall tubular structures,” Exploitation and Shock Waves, Vol. 32, No. 5, pp. 73–78, 2012.
-
W. Gao et al., “Directional blasting demolition of hyperbolic cooling tower in power plant and numerical analysis of blasting outcome,” Explosive Materials, Vol. 49, No. 4, pp. 52–57, 2020.
-
Xu, Pengfei, Chu, Huaibao, Zhang, and Yingcai, “Vibration numerical analysis of cooling tower blasting at high unloading slot incision,” Engineering Blasting, Vol. 20, No. 4, pp. 11–14, 2014.
-
Z.-Q. Zhan et al., “Application of numerical simulation in blasting of cooling tower,” Blasting, Vol. 29, No. 1, pp. 73–76, 2012.
-
W. Liu, “Finite element analysis and simulation for demolition of constructions due to controlled blasting,” 2006.
-
“LS-DYNA keyword user’s manual volume II material models,” LS-DYNA R7.1, Livermore Software Technology Corporation (LSCT), 2016.
-
H. Jia and S. Tian, “Research and application of a reinforced concrete simplified model,” Advances in Civil Engineering, Vol. 2021, pp. 1–12, Feb. 2021, https://doi.org/10.1155/2021/8861831
-
K. Bao, “Theoretical analysis and experimental research on wind loads and wind-induced response of large hyperbolic cooling towers,” Zhejiang University, 2009.
About this article

This work was supported by the National Science Foundation of China (Grant Nos. 50474040 and 50674078) and the National High Technology Research and Development Program of China (Grant No. 2012AA061201).
The datasets generated during and/or analyzed during the current study are available from the corresponding author on reasonable request.
Haipeng Jia: conceptualization, formal analysis, investigation, methodology, project administration, resources, supervision, validation, visualization, writing – original draft preparation, writing – review and editing. Qianqian Song: formal analysis, methodology, project administration, validation, writing – original draft preparation, writing – review and editing.
The authors declare that they have no conflict of interest.
