Abstract
Irregular-shaped bridge is an important component of urban overpass and is prone to damage due to severe overloading and material deterioration. Structural damage detection is necessary to prevent bridge failure and guarantee the safe operation of urban traffic. For vibration-based damage detection methods, mode shape of full-scale structure is difficult to be measured with the limited number of sensors, while modal frequency can be obtained accurately and conveniently. This paper aims to propose a two-stage scheme for damage identification using the ratios of modal frequency changes and uniform load surface curvature difference (ULSCD) in damage region. FCM algorithm improved by PSO algorithm (FCM-PSO) is employed to locate damage and predict the damage extent. Firstly, the ratios of modal frequency changes from training cases are classified into several clusters based on FCM-PSO analysis. And the cluster centers for damage locations are constructed. Damage location can be identified by calculating the fuzzy memberships between identification indicator vector and cluster centers of damage locations. After obtaining the damage location, ULSCD values in damage region are established to assess damage severity based on the memberships in damage grades. Damage identification results for typical irregular-shaped bridge demonstrate that the two-stage damage identification method is efficient and accurate to identify the occurrence, location and extent of structural damage
1. Introduction
In general, bridge structures are prone to damage due to long-term deterioration under external environment factors and service load [1, 2]. Since bridge failure can cause severe economic loss and threaten people's lives and safety, damage detection is becoming one of the most important aspects of bridge health monitoring [3]. Bridge damage identification attempts to determine whether structural damage has occurred and also the location and extent of damage. During the past few decades, vibration-based damage detection (VBDD) techniques are widely used for damage detection due to their ease of practical implementation. It is based on the fact that modal parameters (natural frequency, mode shape and modal damping) are the functions of physical parameters (mass, stiffness and damping). Local damages usually cause the decrease in the structural stiffness, which produces changes in the global vibration characteristics of structure. Researchers have tried to detect and locate damages through comparing the dynamic properties from damaged bridge with that from undamaged one, or from a finite element model in undamaged state [4].
Various damage identification methods based on modal parameters have been proposed and applied including natural frequencies, modal assurance criteria (MAC), mode shape curvatures (MSC), modal strain energies, frequency response functions (FRF), modal stiffness, flexibility curvatures, uniform load surface curvatures and so on. Although the dynamic identification algorithms have been highly developed, many difficulties inherent in the current methods should be overcome. In these damage identification indices, the vast majority of them are constructed by mode shape. However, it is difficult to measure the whole modal shape of large and complex structures due to the limited number of sensors [5]. A large number of sensors will increase the cost of bridge damage detection and restrict the practical application of VBDD technology. In addition, these incomplete measurements will make the damage identification indices derived from mode shape inaccurate or useless [6]. This increases the difficulty of damage identification for large and complex structures.
In order to overcome the disadvantages of existing structural damage identification approaches in full-scale structures, sub-structural identification techniques have been proposed [7]. It can efficiently reduce the measuring points by isolating the estimation region within an internal substructure. Weng et al. [8] proposed a forward substructure approach for damage detection of structures, which analyzed the substructures independently and assembled to recover the solutions of global structure using constraints at the interfaces. Yun and Lee [9] adopted the ARMAX model in a time domain for substructures to identify damages in frame structures. Koh and Shankar [10] proposed a sub-structural identification method without the measurements at the interfaces. Sub-structural damage identification technique provides a method to achieve the damage detection for complex structure. But, it needs to carry out repeated tests to narrow down the damaged region or determine the approximate range by means of other nondestructive testing methods.
The typical irregular-shaped bridge is a five-span continuous beam structure. As complex bridge structure, it is difficult to measure mode shape of full-scale structure. Selecting the modal parameter measured conveniently and accurately to identify structural damage has an important practical significance [11]. Modal frequency is an indicator reflecting global dynamic property of bridge structure. It is easy to be obtained with high precision in structural vibration testing, especially in the structure which is not suitable to arrange a lot of sensors. For a practical structure, they can be measured at a few locations or even at one frequency measurement point. With improvement of signal processing and analyzing, the identification precision of frequency becomes more favorable. In addition, changes in the modal frequencies may not be the same for each mode since the changes depend on location and severity of the damage. This offers the possibility of using modal frequency to detect structural damage. Hearn and Tesla [12], Wang et al. [13] and Patil et al. [14] presented various methods that exploit the modal frequencies of full-scale structure to detect damage. The ratio of frequency changes in every two modes is a function of the damage location only, which can be adopted to locate damage [15].
However, the use of natural frequencies for damage detection is limited for following reasons [16]. Firstly, natural frequency is a global parameter which is insensitive to local damage of structure. Damage identification result is unreliable based on only one or few order modal frequencies. Secondly, the changes of modal frequencies are equal with each other when the damages locate at the symmetrical position. Therefore, damage location is not identified accurately in symmetrical structure. These difficulties of damage identification based on modal frequency can be overcome to some extent in irregular-shaped bridge. Because of the unique geometry of irregular-shaped bridge, the damages at symmetrical positions are nonexistent. Moreover, the identification indicator vector consisted of the ratios of frequency changes in sufficient number of modes can make up the shortcomings of damage detection based on only one or few modal frequencies. The improvement of damage detection method makes it possible to locate damage for irregular-shaped bridge using modal frequency.
Although the modal frequency shows the capability of damage detection for irregular-shaped bridge, uncertainties involved cannot be ignored. In general, measured modal parameters including modal frequency and mode shape are affected by enormous uncertainties resulting from either measurement noises or environmental variations, such as changing temperature, moisture and load condition [17, 18]. Structural damage identification is unavoidably conducted for cases where the measurement data containing uncertainties, which greatly impede accurate and reliable damage detection. In order to overcome these defects, neural networks have been used for this purpose. However, neural network is a black box that are difficult to understand and can also require enormous computer time when the back-propagation algorithm is used [19]. It is not feasible to achieve the accurate damage detection using modal parameters with measurement noise. Due to the incapability of conventional damage identification methods under the influence of uncertainties, fuzzy theory is utilized to handle the uncertainties and imprecision involved [20]. Sawyer and Rao [21] adopted fuzzy logic and continuum damage mechanics to process the uncertainties and complexities of damaged structure considering measurement noise. Chandrashekhar and Ganguli [22] alleviated the geometric and measurement uncertainties by using a fuzzy logic-based approach for damage detection. Pawar and Ganguli [23] proposed a genetic fuzzy system for structural health monitoring representing uncertainties with equivalent measurement noise. Existing researches indicate the validity and feasibility of fuzzy computation approaches in handing the uncertainties in structural damage detection.
Considering that various damages would result in different ratios of frequency changes, the clustering recognition of damages provides a novel damage localization method for irregular-shaped bridge. Fuzzy clustering algorithm is an unsupervised learning method of data automatic classification. It is able to explore the potential structural information of data and decompose a given set of objects into subgroups or clusters based on similarity. In fuzzy clustering, objects belonging to the same cluster are as similar as possible, whereas objects belonging to different clusters are dissimilar. In recent years, the damage identification based on fuzzy clustering attracts the interests of researchers. Palomino et al. [24] proposed a method combining probabilistic neural network and fuzzy cluster analysis methods to identify, locate, and classify two types of damage, namely, cracks and rivet losses in aluminum aircraft window. Ling et al. [25] presented a novel methodology based on fuzzy c-means (FCM) clustering algorithm and measured FRF data to deal with vibration-based damage detection in a truss bridge model.
FCM clustering algorithm proposed by Bezdek [26] is becoming the most popular method of fuzzy clustering analysis by virtue of its unique advantages. However, FCM algorithm is a local search algorithm evolved from conventional c-means algorithm. It is prone to fall into local minima when the initial cluster center is near the local optimal position [27]. In order to overcome the shortage of FCM algorithm in practical application, a hybrid clustering method combining FCM algorithm and particle swarm optimization (PSO) algorithm is introduced, which can be called FCM-PSO. This method adopts PSO to globally explore and FCM to accelerate convergence, which maintains the merits of both PSO and FCM algorithms to improve the validity of data clustering.
In this paper, a two-stage damage identification approach for irregular-shaped bridge is presented by employing FCM-PSO algorithm. Since the first several natural frequencies and mode shape in local region can be obtained accurately and conveniently, the ratios of modal frequency changes and uniform load surface curvature difference (ULSCD) are selected to construct damage identification indices. Firstly, the ratios of modal frequency changes from training cases are classified into optimal number of clusters determined by Xie-Beni validity evaluation index. And the cluster centers and fuzzy memberships are also obtained based on FCM-PSO analysis. The damage location identification is achieved by calculating the memberships between damage location identification (DL) indicator vector and cluster centers of damage locations. On the basis of damage localization, damage extent identification (DE) indicator vector in damage region is established to identify the severity of damage based on the memberships in damage grades. An important advantage of the method is that the damage identification can be realized by few sensors. Numerical simulation for the typical irregular-shaped bridge is used to verify the effectiveness and accuracy of proposed algorithm. Damage identification results indicate that the two-stage damage identification method is favorable to identify the damage for irregular-shaped bridge.
2. Theoretical background
2.1. The ratio of modal frequency changes
The free vibration equation for an undamped structure is described as follows [12]:
where , , are the stiffness matrix and mass matrix of structure, respectively; is the normalized mode shape; and is the natural frequency. Small changes in stiffness and mass (, ) caused by damage will produce small changes in and . For the perturbed system, Eq. (1) becomes:
Structural damages often have a significant effect on stiffness, but not on mass. Therefore, the change of mass can be neglected (). Due to the insignificant change of mode shape corresponding to minor damage, is deleted in Eq. (2). For a single vibration mode , Eq. (2) is changed into:
The structure is divided into elements. The global stiffness is decomposed into individual element stiffness matrices and element deformation is computed from the mode shape . It can be obtained that:
where, represents the change of stiffness in th element; is the deformation of th element computed from th mode shape.
When th element is damaged, Eq. (4) can be rewritten as:
is related to the damage location and damage extent, which indicates the change of frequency contains the information of damage. For the th mode, change of natural frequency caused by damage is the function of damage location vector and stiffness reduction of . It may be expressed as:
Conducting first-order Taylor series expansion for Eq. (6) within the field of undamaged structure (). Eq. (6) is changed into:
When the structure is undamaged, and . Therefore, :
is only the function of damage location vector . For the th mode:
The ratio of modal frequency changes in th mode and th mode is:
As can be seen from Eq. (10), this ratio is a function of damage location only. Therefore, the damage location identification may be achieved by using the ratio of modal frequency changes [12].
2.2. Uniform load surface curvature difference
The transformation from the natural frequencies and mode shapes to modal flexibility matrix is given by the expression [28]:
where the element of modal flexibility matrix represents the deformation at the th point under the unit load at the point ; is the normalized mode shape; , are node numbers; is modal frequency; represents mode order and is the number of modes.
Uniform load surface (ULS) is the deformation vector under uniform load [29]. It is defined as:
with:
Uniform load surface curvature (ULSC) is defined as the second order difference of uniform load surface vector [30]:
where is the length of element.
The difference of uniform load surface curvature (ULSCD) before damage and after damage (, ) can be defined by Eq. (15), which is able to reflect the extent of damage:
2.3. Hybrid clustering algorithm (FCM-PSO)
2.3.1. FCM clustering algorithm
In order to determine the clusters of damages, the FCM clustering has been applied to structural health monitoring (SHM) problems. It is employed to make a fuzzy decision by using the membership of damage index in a cluster. FCM clustering algorithm uses a certain objective function described in Eq. (16) to determine the local minima iteratively [26]:
where is the total number of objects and is the number of clusters; is the cluster center vectors; is the center for th cluster; is fuzzy membership matrix; is an element of and represents the membership associated with the th object and th cluster; is the Euclidean distance between data point and cluster center ; (normally ) is fuzzy coefficient which controls the fuzziness of membership matrix; For the membership value , following requirements are required:
and are updated by Eqs. (18) and (19) at each iteration step, respectively. The iterative equations calculated by solving the derivative of objective function using Langrange multiplication are defined as follows:
Even though the objective function is improved at each iteration, it is not sure to obtain the optimal value. Therefore, the improvement of traditional FCM method is necessary for practical application [31].
2.3.2. PSO algorithm
PSO algorithm is proposed by J. Kennedy and R. C. Eberhart [32]. At each iteration, the positions and velocities of particles are constantly updated to search the optimal solutions. Velocity and position of th particle are updated by:
and:
where is inertia weight; the number of particles is 1, 2,…, ; , are acceleration coefficients (normally ); , are two independently random variables uniformly distributed in [0,1]; and represent the position and velocity of th particle, respectively. is the personal best position and is the global best position.
Inertia weight is linearly decremented as the number of iterations increasing from the maximum value to the minimun value [33]:
where , ; and denote the current iteration and maximum number of iterations, respectively.
2.3.3. FCM clustering improved by PSO algorithm (FCM-PSO)
In this paper, an advanced fuzzy clustering algorithm called FCM-PSO is established through FCM algorithm integrated with PSO algorithm. It takes advantage of the excellent features of PSO in the aspect of global exploration and FCM in the aspect of speeding up convergence.
Vectors of cluster centers in FCM algorithm are adopted as position of each particle in PSO algorithm. Each particle is composed of cluster centers and represents the th cluster center in th clustering manner. In order to evaluate the particle solution, the fitness function is established by:
The smaller is, the better clustering effect will be. The personal best position of particle and global best position are updated according to the Eqs. (24) and (25):
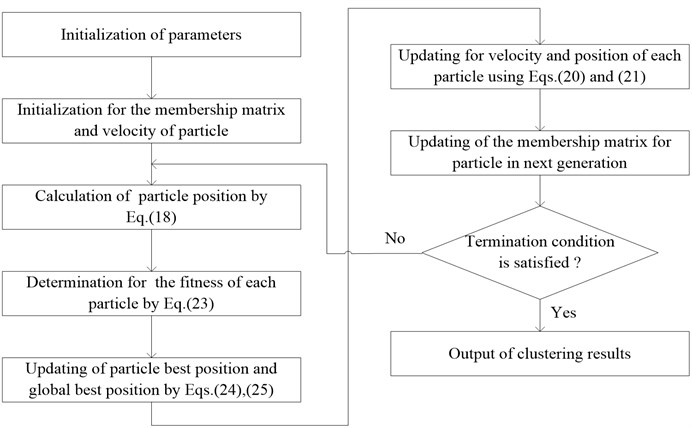
The calculation procedure for FCM-PSO is demonstrated in Fig. 1.
2.3.4. Clustering validity evaluation
In the clustering process, the number of clusters must be pre-defined. However, in general, the number of clusters is impossible to be obtained in advance. Xie-Beni () index proposed by Xie is adopted to evaluate the clustering validity and determine the cluster number in this paper [34]. It is given by:
The smaller numerator and greater denominator indicate the better partition. Therefore, the minimum of determines the optimal cluster number .
Fig. 1Calculation process of FCM-PSO
3. Numerical simulation
A typical concrete irregular-shaped bridge is selected as the research object, which is firstly established by Lu [35], as shown in Fig. 2. The spans of main bridge are 25 m+30 m+25 m and ramps are 25 m+25 m. The ramp radius is 50 m. Bifurcation diaphragm thickness is 2.0 m while the thickness of diaphragms at other locations are 0.6 m. The height of box girder adopts 2.0 m. Supporting conditions are listed in Table 1.
Fig. 2Plan view of irregular-shaped bridge
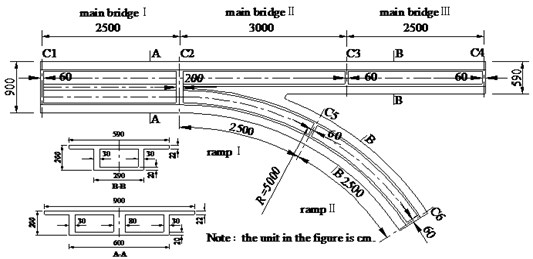
Table 1Support conditions
Support position | Support condition |
C1 | Double movable support |
C2 | Double fixed support |
C3 | Single vertical support |
C4 | Double movable support |
C5 | Vertical eccentric support (eccentric distance is 0.4 m) |
C6 | Double movable support |
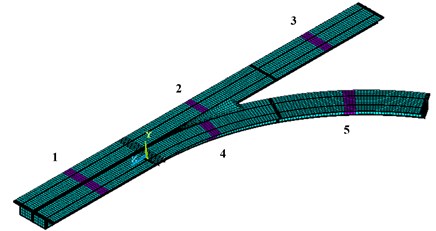
Finite element model (FEM) of typical irregular-shaped bridge is established in ANSYS, as shown in Fig. 3. It is partitioned through mapped meshing technique using element of solid65. Material properties of elements are modulus of elasticity3.5×1010 Pa, density 2500 kg/m3, Poisson’s ratio 0.2. There are totally 37744 elements generated in the FEM after mesh dividing. The size of elements is 0.5 m in most of parts, while web plates of box girder, diaphragms and bifurcation location are subtly partitioned. In consideration of the complexity of model, the damage may occur in every span. It is unpractical to identify damage in all sections of structure. The middle sections of spans are chosen as research objects in order to verify the efficiency and accuracy of proposed method. Length of damaged locations is 2 m, and there are four damaged elements located at sections 1, 3, 4 and 5, while three elements in section 2 at the longitudinal direction. Specific damage situation is illustrated in Fig. 3. Damage of element is simulated through the reduction of elastic modulus. The damage percentage () is defined by:
where is Young’s modulus of material; Superscripts and represent the undamaged and damaged states, respectively.
Fig. 3FEM and damaged sections of irregular-shaped bridge
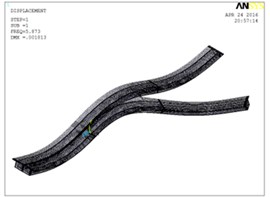
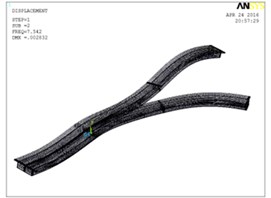
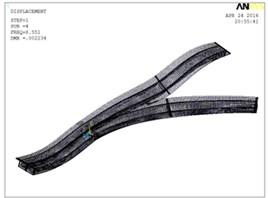
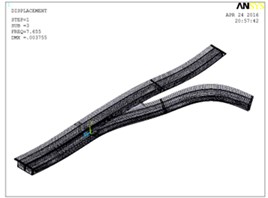
Block Lanczos method is adopted to perform the modal analysis for the FEM of irregular-shaped bridge. The first six order modes are calculated and extracted. Modal frequencies and mode shapes of undamaged bridge are illustrated in Fig. 4.
Fig. 4First six order mode shapes of the FEM for irregular-shaped bridge
a) First order
b) Second order

c) Third order
d) Fourth order

e) Fifth order
f) Sixth order
4. Damage identification indicator
4.1. Damage location
The ratio of modal frequency changes of bridge is the function of damage location and unrelated to the damage extent. The ratio of modal frequency changes in th and th modes can be calculated by:
where, , are the changes of modal frequencies in th and th modes of damage structure.
Ratios of frequency changes in first six order modes are chosen as objects for FCM-PSO clustering to identify damage location. The damage location identification indicator vector constructed for clustering analysis is defined as:
where is the ratio of modal frequency changes in th and th modes.
4.2. Damage severity
The ULSCD index reflects the flexibility characteristic and increases with the reduction of structural stiffness. It can be used to identify the extent of damage. ULSCD values in damaged region are constructed by natural frequency and mode shape measured in the center line of bridge section. The identification indicator vector for damage severity is expressed by:
where is the ULSCD value of th node in damage region.
5. Damage location identification based on FCM-PSO algorithm
5.1. Determination of cluster centers
Taking damage identification of sections 1, 2, 3, 4 and 5 for example, 36 damage cases shown in Table 2 are investigated and used as training cases. The levels of damage are 5 %, 10 %, 15 % and 20 %, respectively.
Table 2Training cases for clustering analysis
Damage case | Damage location | Damage extent | Damage case | Damage location | Damage extent | Damage case | Damage location | Damage extent |
1 | 1 | 5 % | 13 | 4 | 5 % | 25 | 2-4 | 5 %-5 % |
2 | 1 | 10 % | 14 | 4 | 10 % | 26 | 2-4 | 10 %-10 % |
3 | 1 | 15 % | 15 | 4 | 15 % | 27 | 2-4 | 15 %-15 % |
4 | 1 | 20 % | 16 | 4 | 20 % | 28 | 2-4 | 20 %-20 % |
5 | 2 | 5 % | 17 | 5 | 5 % | 29 | 4-5 | 5 %-5 % |
6 | 2 | 10 % | 18 | 5 | 10 % | 30 | 4-5 | 10 %-10 % |
7 | 2 | 15 % | 19 | 5 | 15 % | 31 | 4-5 | 15 %-15 % |
8 | 2 | 20 % | 20 | 5 | 20 % | 32 | 4-5 | 20 %-20 % |
9 | 3 | 5 % | 21 | 2-3 | 5 %-5 % | 33 | 1-2-3-4-5 | all 5 % |
10 | 3 | 10 % | 22 | 2-3 | 10 %-10 % | 34 | 1-2-3-4-5 | all 10 % |
11 | 3 | 15 % | 23 | 2-3 | 15 %-15 % | 35 | 1-2-3-4-5 | all 15 % |
12 | 3 | 20 % | 24 | 2-3 | 20 %-20 % | 36 | 1-2-3-4-5 | all 20 % |
The damage location identification indicator constructed by the first six order modal frequencies in each training case is adopted as training sample. Considering that the data for fuzzy clustering are largely different from each other, the ratios of modal frequency changes in training samples are normalized in advance before further calculation. It can be calculated by:
where is the normalized value of th ratio in th sample, and is the value of th ratio in th sample.
Through the clustering analysis for normalized samples, Xie-Beni validity evaluation values () under different cluster numbers are shown in Fig. 5.
Fig. 5Xie-Beni value under different cluster number
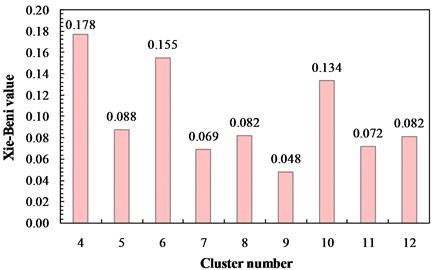
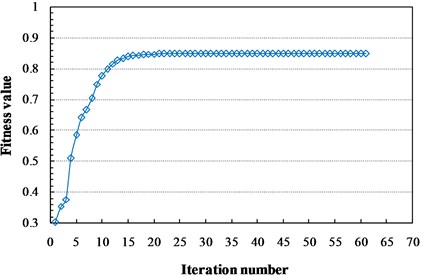
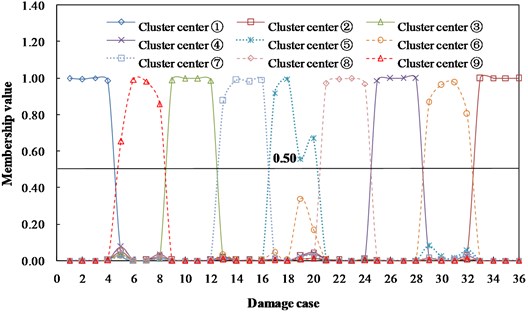
As can be seen from Fig. 5, reaches to the minimum when the cluster number is 9. Therefore, dividing the training samples into nine clusters can receive the best clustering effect. The training samples are divided into nine categories based on FCM-PSO algorithm after 62 iterations. Fitness curve of optimal particles is shown in Fig. 6. The cluster centers are listed in Table 3 and membership values are shown in Fig. 7.
Fig. 6Fitness curve of optimal particle
The training case can be assigned to the category with maximum membership. As can be seen from Fig. 7, damage cases with same damage location are classified as the same cluster, which indicates the damage location identification indicator can express the difference of damage location. For example, damage cases {1, 2, 3, 4} are assigned to the cluster (1) and they are all damaged in section 1. The other cases have the same phenomenon. Because of the damage location identification indicators in cases with the same damage locations are similar with each others, the damages can be located by calculating the membership of damage location identification indicator vectors and cluster centers of damage locations. Based on the cluster centers and membership values in Table 3 and Fig. 7, the cluster centers corresponding to damage locations are calculated and listed in Table 4.
Table 3Cluster centers of training samples
Cluster center | Normalized ratio of modal frequency change | |||||
(1) | 0.0968 | 0.0165 | 0.5312 | 0.2118 | 0.0004 | 0.9471 |
(2) | 0.1803 | 0.0676 | 0.0721 | 0.2984 | 0.0754 | 0.0620 |
(3) | 0.9856 | 0.0035 | 0.2458 | 0.3958 | 0.0334 | 0.0307 |
(4) | 0.0186 | 0.0342 | 0.2990 | 0.3954 | 0.1950 | 0.0302 |
(5) | 0.0571 | 0.9079 | 0.0004 | 0.1342 | 0.3545 | 0.0016 |
(6) | 0.0376 | 0.5937 | 0.0095 | 0.0967 | 0.4771 | 0.0069 |
(7) | 0.0011 | 0.0850 | 0.2283 | 0.0211 | 0.8587 | 0.0114 |
(8) | 0.4961 | 0.0036 | 0.2806 | 0.4934 | 0.0421 | 0.0494 |
(9) | 0.0442 | 0.0038 | 0.6920 | 0.9682 | 0.0620 | 0.0745 |
Table 4Cluster centers for damage location identification
Damage location | Normalized ratio of modal frequency change | |||||
1 | 0.0968 | 0.0165 | 0.5312 | 0.2118 | 0.0004 | 0.9471 |
2 | 0.0442 | 0.0038 | 0.6920 | 0.9682 | 0.0620 | 0.0745 |
3 | 0.9856 | 0.0035 | 0.2458 | 0.3958 | 0.0334 | 0.0307 |
4 | 0.0011 | 0.0850 | 0.2283 | 0.0211 | 0.8587 | 0.0114 |
5 | 0.0571 | 0.9079 | 0.0004 | 0.1342 | 0.3545 | 0.0016 |
2-3 | 0.4961 | 0.0036 | 0.2806 | 0.4934 | 0.0421 | 0.0494 |
2-4 | 0.0186 | 0.0342 | 0.2990 | 0.3954 | 0.1950 | 0.0302 |
4-5 | 0.0376 | 0.5937 | 0.0095 | 0.0967 | 0.4771 | 0.0069 |
1-2-3-4-5 | 0.1803 | 0.0676 | 0.0721 | 0.2984 | 0.0754 | 0.0620 |
Fig. 7Membership of training case in each cluster center
5.2. Damage location identification
The testing cases used to check the damage location identification performance are listed in Table 5.
Membership values between the damage location identification indicators of testing cases and cluster centers corresponding to damage locations are listed in Table 6.
As can be seen from Table 6, the membership value of testing case A to damage location 2 is 0.9544. Similarly, the maximum membership values of testing cases (B, C, D and E) corresponding to damage locations (5, 2-3, 2-4 and 1-2-3-4-5) are 0.9940, 0.6977, 0.6207 and 0.8272, respectively. Based on the principle of maximum membership value for determining category, results of damage location identification are consistent with actual damage. It indicates that FCM-PSO algorithm can successfully identify the location of damage, and it has favorable applicability and accuracy.
Table 5Testing cases for damage location identification
Testing case | Damage location | Damage extent |
A | 2 | 12 % |
B | 5 | 9 % |
C | 2-3 | 10 %-17 % |
D | 2-4 | 8 %-15 % |
E | 1-2-3-4-5 | 8 %-15 %-10 %-22 %-17 % |
Table 6Memberships of testing cases
Damage location | Testing case | ||||
A | B | C | D | E | |
1 | 0.0040 | 0.0002 | 0.0133 | 0.0178 | 0.0070 |
2 | 0.9544 | 0.0002 | 0.0207 | 0.0243 | 0.0083 |
3 | 0.0040 | 0.0002 | 0.1342 | 0.0175 | 0.0094 |
4 | 0.0032 | 0.0004 | 0.0128 | 0.0470 | 0.0117 |
5 | 0.0028 | 0.9940 | 0.0113 | 0.0217 | 0.0106 |
2-3 | 0.0098 | 0.0003 | 0.6977 | 0.0511 | 0.0296 |
2-4 | 0.0116 | 0.0005 | 0.0390 | 0.6207 | 0.0771 |
4-5 | 0.0033 | 0.0035 | 0.0147 | 0.0424 | 0.0191 |
1-2-3-4-5 | 0.0069 | 0.0005 | 0.0563 | 0.1576 | 0.8272 |
6. Damage severity identification based on fuzzy membership
6.1. Determination of damage grades
Taking section 2 as example, the structural damages are simulated by stiffness reduction (D) of 5 %, 10 %, 15 % and 20 %, respectively. The changes of ULSCD values are depicted in Fig. 8.
Fig. 8ULSCD values in section 2 under different damage extents
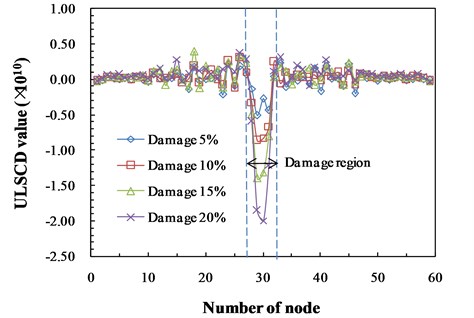
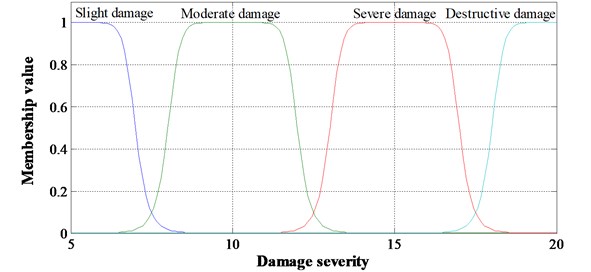
As can be seen from Fig. 8, ULSCD values increase with the severity of damage in damage region. Therefore, the ULSCD values of nodes in damage segment can be adopted to evaluate the extent of damage. In practical structural damage identification, the accurate quantitative identification for damage severity is unnecessary [36]. These damages can be classified as four damage grades. A corresponding set of linguistic variables is expressed as {slight damage, moderate damage, severe damage, destructive damage}, where each term is characterized by a fuzzy set in the universe of discourse (5, 20) corresponding to the damage extent. Considering the satisfactory performance of generalized bell-shaped membership function in fuzzy description [37], it is used for the input variable of damage extent and defined as below:
where , and are the parameters which govern the generalized bell-shaped membership functions. Moreover, parameter is usually positive, and parameter locates the center of curve. Linguistic measure and midpoint associated with each fuzzy set for damage grade are listed in Table 7. Fig. 9 illustrates the membership function for each of the four input fuzzy sets. As can be seen, damage levels of 5 %, 10 %, 15 % and 20 % are classified into the damage grades of “slight damage”, “moderate damage”, “severe damage” and “destructive damage” with the membership of “1”, respectively. Therefore, damage severities of 5 %, 10 %, 15 % and 20 % are selected as the criterion to determine the damage grades of testing cases. Based on the damage grades, appropriate maintenance and reinforcement program can be developed, which is favorable to guarantee the safe operation of bridge structure.
Table 7Linguistic variables and midpoint of fuzzy sets
Linguistic variable | Slight damage | Moderate damage | Severe damage | Destructive damage |
Midpoint (damage extent) | 5 | 10 | 15 | 20 |
Fig. 9Damage grades corresponding to damage severities
6.2. Damage grade identification
On the basis of identifying damage location, DE indicators in damage region corresponding to damage levels of 5 %, 10 %, 15 % and 20 % are defined as the cluster centers of “slight damage”, “moderate damage”, “severe damage” and “destructive damage”, respectively. Damage grades of testing cases can be determined by the memberships between DE indicators of testing cases and cluster centers.
6.2.1. Damage severity identification with single damage location
Three elements of section 2 at the longitudinal direction are damaged. ULSCD values of relevant four nodes are used to construct the cluster centers for damage grades, as listed in Table 8.
Testing cases with damage extents of 6 %, 12 % and 22 % are adopted to verify the identification approach. Membership values between testing cases and cluster centers for damage grades are listed in Table 9.
The membership of 6 % damage to “slight damage” is 0.8570, which indicates the damage grade of 6 % is “slight damage”. Similarly, the damage grade of 22 % damage is “destructive damage” with the membership of 0.8880 to this grade. Specifically, the membership of 12 % damage to “moderate damage” is 0.5825, which is the maximum one. And “severe damage” is 0.2754. The results reveal that the damage condition of 12 % is “moderate damage” and it has the tendency towards “severe damage”. Identification results are consistent with the actual situation, which indicates the accuracy of this method in damage severity identification with single damage location.
Table 8Cluster centers for damage grades in section 2 (×10-11)
Damage grade (severity) | Node number | |||
1 | 2 | 3 | 4 | |
Slight damage (5 %) | –1.2685 | –5.0391 | –2.7395 | –4.3427 |
Moderate damage (10 %) | –3.1934 | –8.5994 | –8.2441 | –6.6218 |
Severe damage (15 %) | –4.9608 | –13.956 | –13.148 | –8.0667 |
Destructive damage (20 %) | –5.9574 | –18.520 | –19.961 | –12.096 |
Table 9Membership values of testing cases
Damage grade | Testing case | ||
6% | 12% | 22% | |
Slight damage | 0.8570 | 0.0923 | 0.0148 |
Moderate damage | 0.1121 | 0.5825 | 0.0274 |
Severe damage | 0.0226 | 0,2754 | 0.0698 |
Destructive damage | 0.0083 | 0.0498 | 0.8880 |
6.2.2. Damage severity identification with multiple damage locations
Cluster centers for damage grades when sections 2 and 4 are simultaneously damaged by 5 %, 10 %, 15 % and 20 % are listed in Table 10. There are four elements to be damaged in section 4 and five relative nodes to be selected in this region.
Table 10Cluster centers for damage grades in sections 2 and 4 (×10-11)
Damage grade (severity) | Section 2 | Section 4 | |||||||
1 | 2 | 3 | 4 | 1 | 2 | 3 | 4 | 5 | |
Slight damage (5 %) | –2.3402 | –4.1495 | –3.7790 | –3.1756 | –2.5998 | –1.1851 | –4.8766 | –3.9145 | –1.0360 |
Moderate damage (10 %) | –3.8447 | –9.0953 | –8.5224 | –5.3690 | –3.1460 | –5.0785 | –8.5621 | –8.3942 | –3.3744 |
Severe damage (15 %) | –4.5189 | –14.390 | –12.647 | –9.8746 | –3.7057 | –9.1262 | –13.315 | –12.221 | –6.6621 |
Destructive damage (20 %) | –7.9475 | –18.512 | –21.056 | –10.740 | –5.1106 | –14.337 | –17.858 | –16.912 | –8.4727 |
Testing cases for damage severity identification with multiple damage locations are listed in Table 11. And membership values of testing cases in damage grades are listed in Table 12.
Table 11Testing cases with multiple damage locations
Testing case | Damage location | Damage extent |
A | 2-4 | 8 %-15 % |
B | 2-4 | 17 %-10 % |
C | 2-4 | 10 %-22 % |
D | 2-4 | 10 %-5 % |
As can be seen from Table 12, the damage grades of testing cases determined by maximum membership are consistent with actual damage conditions. Additionally, the damage case (17 %-10 %) indicates that the damage grade in section 2 is “severe damage” with the tendency towards “destructive damage” and the damage grade in section 4 is “moderate damage”. By comparing the evaluation results and actual situations, the proposed damage severity identification method is effective to identify damage with multiple locations.
For the damages in sections 1-2-3-4-5, the identification results for damage grades are listed in Table 13. The membership values of each section in cluster centers for damage grades can be able to reflect structural damage extent and forecast the deterioration trend.
Table 12Membership values of testing cases
Damage grade | Testing case in section 2 | Testing case in section 4 | ||||||
8 % | 17 % | 10 % | 10 % | 15 % | 10 % | 22 % | 5 % | |
Slight damage | 0.1866 | 0.0313 | 0.1310 | 0.0925 | 0.0219 | 0.0503 | 0.0181 | 0.9407 |
Moderate damage | 0.7561 | 0.0851 | 0.7156 | 0.8196 | 0.0832 | 0.8856 | 0.0339 | 0.0448 |
Severe damage | 0.0446 | 0.6379 | 0.1187 | 0.0716 | 0.8348 | 0.0518 | 0.0902 | 0.0103 |
Destructive damage | 0.0127 | 0.2456 | 0.0348 | 0.0164 | 0.0600 | 0.0123 | 0.8578 | 0.0043 |
Table 13Membership values of damages in sections 1-2-3-4-5
Damage grade | Damage location and extent | ||||
Section 1 (8 %) | Section 2 (15 %) | Section 3 (10 %) | Section 4 (22 %) | Section 5 (17 %) | |
Slight damage | 0.3531 | 0.0269 | 0.0042 | 0.0228 | 0.0244 |
Moderate damage | 0.5723 | 0.0933 | 0.9921 | 0.0402 | 0.0640 |
Severe damage | 0.0573 | 0.8140 | 0.0030 | 0.1085 | 0.6272 |
Destructive damage | 0.0173 | 0.0659 | 0.0007 | 0.8285 | 0.2844 |
7. Conclusions
In this paper, an efficient two-stage damage identification approach is proposed, which employs the ratios of modal frequency changes and ULSCD values combining with FCM-PSO algorithm. In the process of damage localization using FCM-PSO, the ratios of modal frequency changes from training cases are classified into nine categories and the cluster centers for damage locations identification are constructed. Damage location is identified based on the memberships between testing case and cluster centers. Identification results for a typical irregular-shaped bridge indicate that PSO-FCM algorithm can successfully locate the single and multiple damages in irregular-shaped bridge. Additionally, after obtaining the damage location, ULSCD values in damage region are adopted to identify the severity of damage based on the memberships of testing case in damage grades. Identification of damage grades for single and multiple damage locations has verified the applicability and accuracy. Considering the performance of two-stage damage identification technology in damage localization and damage severity assessment, the proposed approach is efficient and accurate to identify damage for irregular-shaped bridge.
References
-
Bayissa W. L., Haritos N., Sofi M. Comparative study of broadband damage localization methods applied to test data. Ocean Engineering, Vol. 38, Issue 2, 2011, p. 329-340.
-
Jeyasehar C. A., Sumangala K. Damage assessment of prestressed concrete beams using artificial neural network (ANN) approach. Computers and Structures, Vol. 84, Issue 26, 2006, p. 1709-1718.
-
Montalvao D., Maia N. M. M., Ribeiro A. M. R. A review of vibration-based structural health monitoring with special emphasis on composite materials. Shock and Vibration Digest, Vol. 38, Issue 4, 2006, p. 295-326.
-
Zhan J. W., Xia H., Chen S. Y., Roeck G. D. Structural damage identification for railway bridges based on train-induced bridge responses and sensitivity analysis. Journal of Sound and Vibration, Vol. 330, Issue 4, 2011, p. 757-770.
-
Weng S., Zhu H. P., Xia Y., Mao L. Damage detection using the eigenparameter decomposition of substructural flexibility matrix. Mechanical Systems and Signal Processing, Vol. 34, Issue 1, 2013, p. 19-38.
-
Su W. C., Huang C. S., Hung S. L., Chen L. J., Lin W. J. Locating damaged storeys in a shear building based on its sub-structural natural frequencies. Engineering Structures, Vol. 39, 2012, p. 126-138.
-
Li J., Law S. S., Ding Y. Substructure damage identification based on response reconstruction in frequency domain and model updating. Engineering Structures, Vol. 41, 2012, p. 270-284.
-
Weng S., Xia Y., Xu Y. L., Zhu H. P. An iterative substructuring approach to the calculation of eigensolution and eigensensitivity. Journal of Sound and Vibration, Vol. 330, Issue 14, 2011, p. 3368-3380.
-
Yun C. B., Lee H. J. Substructural identification for damage estimation of structures. Structural Safety, Vol. 19, Issue 1, 1997, p. 121-140.
-
Koh C. G., Shankar K. Substructural identification method without interface measurement. Journal of Engineering Mechanics, Vol. 129, Issue 7, 2003, p. 769-776.
-
Mohan V., Parivallal S., Kesavan K., Arunsundaram B., Ahmed A. F., Ravisankar K. Studies on damage detection using frequency change correlation approach for health assessment. Procedia Engineering, Vol. 86, 2014, p. 503-510.
-
Hearn G., Testa R. B. Modal analysis for damage detection in structures. Journal of Structural Engineering, Vol. 117, Issue 10, 1991, p. 3042-3063.
-
Wang X., Hu N., Fukunaga H., Yao Z. H. Structural damage identification using static test data and changes in frequencies. Engineering Structures, Vol. 23, Issue 6, 2001, p. 610-621.
-
Patil D. P., Maiti S. K. Experimental verification of a method of detection of multiple cracks in beams based on frequency measurements. Journal of Sound and Vibration, Vol. 281, Issue 1, 2005, p. 439-451.
-
Ewins D. J. Modal Testing: Theory, Practice and Application. Second Edition, Research Studies Press, Hertfordshire, 2000.
-
Hassiotis S. Identification of damage using natural frequencies and Markov parameters. Computers and Structures, Vol. 74, Issue 3, 2000, p. 365-373.
-
Degrauwe D., De Roeck G., Lombaert G. Uncertainty quantification in the damage assessment of a cable-stayed bridge by means of fuzzy numbers. Computers and Structures, Vol. 87, Issue 17, 2009, p. 1077-1084.
-
Jiang S. F., Zhang C. M., Zhang S. Two-stage structural damage detection using fuzzy neural networks and data fusion techniques. Expert Systems with Applications, Vol. 38, Issue 1, 2011, p. 511-519.
-
Chandrashekhar M., Ganguli R. Uncertainty handling in structural damage detection using fuzzy logic and probabilistic simulation. Mechanical Systems and Signal Processing, Vol. 23, Issue 2, 2009, p. 384-404.
-
Zhao Z., Chen C. A fuzzy system for concrete bridge damage diagnosis. Computers and Structures, Vol. 80, Issue 7, 2002, p. 629-641.
-
Sawyer J. P., Rao S. S. Structural damage detection and identification using fuzzy logic. American Institute of Aeronautics and Astronautics Journal, Vol. 38, Issue 12, 2000, p. 2328-2335.
-
Chandrashekhar M., Ganguli R. Damage assessment of structures with uncertainty by using mode-shape curvatures and fuzzy logic. Journal of Sound and Vibration, Vol. 326, Issue 3, 2009, p. 939-957.
-
Pawar P. M., Ganguli R. Genetic fuzzy system for online structural health monitoring of composite helicopter rotor blades. Mechanical Systems and Signal Processing, Vol. 21, Issue 5, 2007, p. 2212-2236.
-
Palomino L. V., Steffen V., Finzi Neto R. M. Probabilistic neural network and fuzzy cluster analysis methods applied to impedance-based SHM for damage classification. Shock and Vibration, 2014.
-
Ling Y., Zhu J. H., Yu L. L. Structural damage detection in a truss bridge model using fuzzy clustering and measured FRF data reduced by principal component projection. Advances in Structural Engineering, Vol. 16, Issue 1, 2013, p. 207-218.
-
Bezdek J. C. Pattern Recognition with Fuzzy Objective Function Algorithms. Kluwer Academic Publishers, Dordrecht, 1981.
-
Berget I., Mevik B. H., Næs T. New modifications and applications of fuzzy C-means methodology. Computational Statistics and Data Analysis, Vol. 52, Issue 5, 2008, p. 2403-2418.
-
Patjawit A. Structural Identification of Concrete Girder Bridge for Strength Evaluation. Asian Institute of Technology, Bangkok, 2005.
-
Zhang Z., Aktan A. E. Application of modal flexibility and its derivatives in structural identification. Journal of Research in Nondestructive Evaluation, Vol. 10, Issue 1, 1998, p. 43-61.
-
Wu D., Law S. S. Damage localization in plate structures from uniform load surface curvature. Journal of Sound and Vibration, Vol. 276, Issue 1, 2004, p. 227-244.
-
Niknam T., Olamaei J., Amiri B. A Hybrid evolutionary algorithm based on ACO and SA for Cluster analysis. Journal of Applied Sciences, Vol. 8, Issue 15, 2008, p. 2695-2702.
-
Kennedy J. Particle Swarm Optimization. Encyclopedia of Machine Learning, Washington, 2010.
-
Shi Y., Eberhart R. A modified particle swarm optimizer. Evolutionary Computation Proceedings, IEEE World Congress on Computational Intelligence, 1998, p. 69-73.
-
Xie X. L., Beni G. A validity measure for fuzzy clustering. IEEE Transactions on Pattern Analysis and Machine Intelligence, Vol. 13, Issue 8, 1991, p. 841-847.
-
Lu P. Z., Xie X., Shao C. Y. Experimental study and numerical analysis of a composite bridge structure. Construction and Building Materials, Vol. 30, 2012, p. 695-705.
-
Taha M. R., Lucero J. Damage identification for structural health monitoring using fuzzy pattern recognition. Engineering Structures, Vol. 27, Issue 12, 2005, p. 1774-1783.
-
Liu H., Jiao Y., Gong Y. A fuzzy logic-based damage identification method for simply-supported bridge using modal shape ratios. International Journal of Computational Intelligence Systems, Vol. 5, Issue 4, 2012, p. 627-638.
Cited by
About this article

The authors express their appreciation for the financial supports of National Natural Science Foundation of China (Nos. 51378236, 51408258); China Postdoctoral Science Foundation funded Project (2014M560237, 2015T80305); Fundamental Research Funds for the Central Universities (JCKY-QKJC06); Science and Technology Development Program of Jilin Province.
