Abstract
With the upgrading of aviation space technology, the amount of information contained in remote sensing images in the aviation is gradually increasing, and the detection technology based on small targets has developed. For lightweight small targets, pixels per unit area contain more information than large targets, and their area is too small, which is easily overlooked by conventional detection models. To enhance the attention of such algorithms, this study first introduces a Control Bus Attention Mechanism (CBAM) in the fifth generation You Only Look Once (YOLOv5) algorithm to increase the algorithm’s attention to small targets and generate optimization algorithms. Then convolutional neural network is used to mark feature pixels of the optimization algorithm, eliminate redundant information, and generate fusion algorithm, which is used to generate redundant information with high similarity when the optimization algorithm surveys pixel blocks. The novelty of this study lies in using CBAM to improve YOLOv5 algorithm. CBAM module can extract important features from images by adaptively learning the channel and spatial attention of feature maps. By weighting the channel and spatial attention of the feature map, the network can pay more attention to important features and suppress irrelevant background information. This attention mechanism can help the network better capture the characteristics of small targets and improve the accuracy and robustness of detection. Embedding CBAM module into YOLOv5 detection network can enhance the network's perception of small targets. CBAM module can improve the expressive ability and feature extraction ability of the network without increasing the complexity of the network. By introducing CBAM module, YOLOv5 can better capture the characteristics of small targets in aerial remote sensing images, and improve the detection accuracy and recall rate. Finally, the proposed fusion algorithm is used for experiments on the Tiny-Person dataset and compared with the fifth, sixth, and seventh generations of You Only Look Once. When the fusion algorithm tests the target, the classification accuracy of Sea-person is 39 %, the classification accuracy of Earth-person is 31 %, and the probability of being predicted as the background is 56 % and 67 %, respectively. And the overall accuracy of this algorithm is 0.987, which is the best among the four algorithms. The experimental results show that the fusion algorithm proposed in the study has precise positioning for lightweight small targets and can achieve good application results in aerial remote sensing images.
1. Introduction
Against the backdrop of the rapid upgrading of computer vision technology, the application of automated scanning of lightweight targets in rescuing people in distress and predicting natural disasters has been developed [1, 2]. However, most of these types of targets are lightweight, and target capture algorithms are prone to generating duplicate pixels during operation, reducing the algorithm’s speed by generating redundant information. When applying conventional algorithms, the method adopted is to increase the number of convolutional layers and reduce errors through multiple iterations. However, this method is limited by the size of the target volume and may encounter issues such as insufficient attention to small targets during operation [3]. Recently, the You Only Look Once (YOLO) series of algorithms have been able to generate more attention to Lightweight Small Targets (LSTs) due to their fine-grained ability. However, this algorithm has the problem that the receptive field is too small, which will lead to the missed detection of the target. To solve these problems, this study is the first to improve the fifth generation You Only Look Once (YOLOv5) algorithm in Convolutional Neural Network (CNN). The selection, modeling and simulation of input parameters are very important steps in the LST detection in aerial remote sensing images (ARSIs). Before the input image, some preprocessing operations, such as image scaling, cropping and normalization, are studied. Then choose the network architecture suitable for ARSIs. YOLOv5 is a lightweight target detection algorithm, which can realize real-time detection in ARSIs. This paper studies how to embed Control Bus Attention Mechanism (CBAM) module into YOLOv5 network to enhance the perception ability of the network. The CBAM module includes two parts: channel attention and spatial attention. Channel attention extracts important features by learning channel weights, while spatial attention suppresses background information by learning spatial weights. To model and simulate, the data set of ARSI is studied and prepared. The prepared data set is utilized to study and train the model. Finally, the model is simulated and tested by using ARSI data set. The performance and effect of the model in practical application are evaluated by simulating detection tasks in real scenes. The research is mainly divided into four parts. The first part mainly analyzes and summarizes the target detection and attention analysis of the current YOLOv5 algorithm. The second part introduces the shortcomings of the YOLOv5 algorithm and introduces CBAM and CNN to optimize it. The third part analyzes and compares the performance of the optimized model with traditional models. The last part conducts simulation experiments on the Tiny-Person dataset, and proposes the shortcomings that still exist in the research. The actual contribution of this study is its ability to effectively monitor and rescue populations at risk. The research is intended to upgrade the detection ability of algorithms for LSTs, thereby achieving modernization of computer vision technology. The novelty of this study lies in network design and optimization. This study is devoted to designing a lighter network structure to reduce the computational complexity of aerial remote sensing model, so as to improve the detection speed of small targets while maintaining accuracy.
2. Related works
In the family of deep learning algorithms for target detection, the YOLO series of algorithms occupy an important position. As a newly added member, YOLOv5 has attracted the attention of many experts and scholars internationally. Jun et al. proposed a reuse algorithm for circuit boards based on the YOLOv5 algorithm, which is used for automatic recycling of electronic components. They collected images of these components into a dataset, reorganized the output of YOLOv5, and conducted experiments. The data results denoted that their proposed algorithm had strong ability to identify circuit components and could effectively save the cost of circuit board development and preparation [4]. Yi et al. proposed a model for insulator leakage detection based on the YOLOv5 algorithm and used it in a two-dimensional joint gamma transform to correct the brightness component of the image. The main mechanism of this method was to improve image brightness, which could be applied to increase the attention of nighttime billboards. They conducted on-site inspections of the method, and the outcomes indicated that their method could guarantee practicality in practice and also enable businesses to gain competitiveness [5]. With the development of aircraft technology, target detection algorithms are gradually being applied to the detection of ARSIs. Konen et al. conducted inspections on ground vehicles during spaceflight and proposed a neural network-based model based on this. They found that synthetic and real images had stronger utility in model iteration, so they used synthetic data to train the network. They conducted targeted explorations in appropriate scenarios, and the experimental findings denoted that their neural network had value [6]. Hammed et al. proposed parameters that could be used to detect human objects based on the different brightness of ground target points during spaceflight. They determined the shape, size, and density of elements based on the contours of objects in areas with the same brightness. Finally, they compared the proposed target search algorithm with other algorithms. The research findings indicated that their algorithm could effectively avoid mistaking people for objects [7]. Small target detection technology is an important research direction in the field of computer vision, aiming at accurately detecting and identifying small targets in images or videos. In the history and research status of small target detection technology, the early small target detection methods were mainly based on hand-designed features and traditional machine learning algorithms, such as Haar features and AdaBoost classifiers.
As the refinement of objects, detection algorithms based on small targets have been developed. With the rise of deep learning, the method based on CNN has gradually become the mainstream. Some classic CNN architectures, such as Faster R-CNN, YOLO and SSD, are applied to small target detection tasks. To cope with the size change of small targets, researchers proposed a series of multi-scale feature representation methods, such as pyramid structure, Feature Pyramid Network (FPN) and multi-scale attention mechanism. To improve the accuracy of small target detection, researchers began to pay attention to the use of contextual information, such as spatial attention mechanism, contextual awareness module and image semantic segmentation. Zhu et al. proposed a fusion algorithm with YOLOv3 based on CNN to detect LSTs. They achieved target locking of an object by monitoring its operational status. Finally, they conducted experiments using the MDR105 dataset. The experiment outcomes showed that their proposed algorithm had site adaptability and could perform good target detection [8]. Ma et al. also proposed a small target recognition algorithm based on CNN to monitor the development of corn leaf pests. They conducted experiments on the Plant Village dataset using the algorithm they studied, achieving a pest detection rate of 99.11 %. The experimental outcomes indicated that their proposed algorithm could accurately identify pests on corn leaves, making a huge contribution to agricultural research [9]. Because it is difficult to label small target data sets, researchers have proposed some weak supervised learning methods, such as unsupervised target generation and self-supervised learning, to reduce the dependence on a large number of labeled data. To solve the generalization problem of small target detection in different scenes and data sets, researchers began to explore cross-domain and transfer learning methods, such as domain adaptation and model compression. Small target detection technology has a wide application prospect in practical applications, such as video surveillance, autonomous driving, unmanned aerial vehicles and other fields. Future research directions include further improving the accuracy and robustness of small target detection, improving the efficiency and real-time performance of the model, and solving the challenges of small target detection in complex scenes and extreme conditions. To achieve automated reconnaissance and attack of drones, Liu et al. introduced the camouflaged human detection module into the drone through a semi supervised design method. They outlined the edges of the disguised person based on their disguise method. Finally, they conducted experiments on the COD10K dataset. The experiment findings illustrated that their algorithm had higher accuracy in detecting disguised individuals [10]. The Tran team simulated parameters such as geometric distance of castings based on flat panel detectors for monitoring small and medium-sized castings in cone beam computers. They explored the construction of small-sized castings on the CBCT dataset and conducted experimental investigations based on it. The data results indicated that their model has been validated and could achieve industrial grade small component casting [11]. Du et al. believed that the target detection is a big challenge for extremely small infrared images, so they proposed a feature-based detection algorithm for the target, which points out the direction for the target detection of CNNs. To ensure that small target instances can be used correctly in the network, they designed small anchor points according to shallow layers. According to the real area of the ground, the misjudgment was effectively avoided. Their experimental results showed that the simulation data set could detect point targets and had the advantage of small target detection [12]. Yang et al. used sparse regularized principal component tracking method to solve the problems of residual error or missed target in small target detection, and made the patch lighter based on non-overlapping patches. The adoption of norm not only enhanced the sparsity of the target, but also enhanced the robustness of the algorithm under clutter. Their method realized the stable separation of sparse components, which could effectively suppress the background. The experimental results of the final product of their method showed that they were competitive in real target detection. In addition, their methods also had a positive effect on reducing background inhibition [13]. On the basis of the limitations of the existing methods of small target detection technology, Qiu et al. proposed a local contrast method of small targets at pixel level, which subdivided small targets and backgrounds at pixel level. They designed multi-scale windows to extract target pixels and segmented the target based on the wandering windows. Then, they combined probability weights to suppress various types of background interference. Finally, they applied adaptive threshold operation to separate targets. The experimental results showed that their method had low false alarm rate and high speed [14].
Multiple research experts and scholars have found that there is a lot of research based on detection algorithms such as YOLOv5, and their research in ARSIs and small object monitoring is very popular. However, so far, there are few improved YOLOv5 algorithms for detecting small targets in aviation process. To fill this gap, this study innovatively improves YOLOv5 and applies it to detect LSTs in ARSIs.
3. Construction of a LST detection model in ARSIs
YOLOv5 algorithm is a popular algorithm for LST detection. This research combines CNN and YOLOv5 algorithm. First, it introduces the method of improving YOLOv5 algorithm and fuses it with CNN. Finally, it builds a detection model for LSTs in ARSIs based on fusion algorithm.
3.1. LST detection system combining improved YOLOv5 algorithm and CNN
Compared with YOLOv4 algorithm, YOLOv5 algorithm is optimized in terms of processor, input method, and other aspects. When the algorithm runs, it generates an adaptive anchor box. The image is first input into the main part (Head) of the algorithm, and the feature extraction module marks the image features. During this process, there may be a loss of image information, which can be calculated using Eq. (1):
where, the loss of anchor frame area is recorded as ; represents the reduction of picture confidence; denotes the loss of pixels in the image; and any adjacent pixel blocks are recorded as , , which are collectively referred to as the loss function of the algorithm. In the detection box output by the YOLOv5 algorithm, based on the calculation results of and , the information box is filtered according to the threshold until the value is below the threshold. This process is shown in Fig. 1 [15].
Fig. 1 shows the filtering of image information boxes in the YOLOv5 algorithm, which are at different scales. Through the FPN filtering in Fig. 1, the Head module of this algorithm can perform lossless image extraction. As the extraction process progresses from bottom up, the pixel classification of the image is processed by the Neck module of the YOLOv5 algorithm. Due to the focus of this study on LSTs, CBAM is introduced into the Neck module. Through the refinement of the target, its attention to small targets is increased. The calculation method for attention is shown in Eq. (2):
where, represents the attention of the Neck module to small targets. The YOLOv5 algorithm optimized by CBAM (CBAMYOLOv5) can simultaneously increase the attention of space and channels, thereby reducing the operational error of the algorithm. As the size of the target decreases, the amount of information in the regional space gradually increases, which is prone to computational errors. To address this issue, this study introduces multiple input nodes into the CBAMYOLOv5 algorithm, and the optimized flowchart is shown in Fig. 2.
Fig. 1Threshold information box screening flow chart
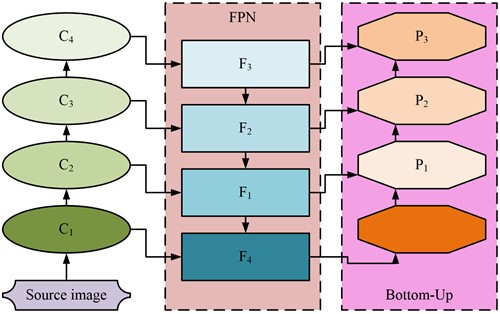
Fig. 2Structure diagram of CBAMYOLOv5 algorithm with multiple input nodes
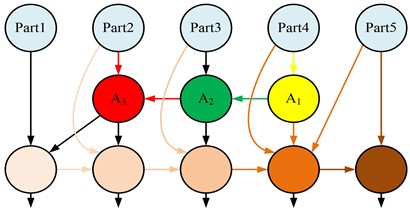
After optimization in Fig. 2, the connection mode of CBAMYOLOv5 algorithm has changed, allowing it to connect more features in a skip connection mode. After feature extraction, it enters A1~3 for feature classification, and the refined working characteristics will effectively reduce various errors of the algorithm [16]. The optimized algorithm has strengthened its ability to focus on small targets, but its weight in the feature selection stage needs to be recalculated, as shown in Eq. (3):
where, is the input weight; , , are the three learning values obtained by the CBAMYOLOv5 algorithm during training; the output and input of the third node are recorded as , ; the processing values and parameters of the fourth layer are labeled by , [15]. By using them, the input values for the fifth layer can be calculated, as shown in Eq. (4):
where, the critical input of the CBAMYOLOv5 algorithm is denoted as , and indicates the residual operation. In CNN, it is divided into convolution, pooling and full connection layers, and the last layer is Softmax layer [17]. The Softmax layer serves as the output layer of CNN, and the dimensions of its output values are determined by the image. The relationship between the type of image and the output value of the Softmax layer is shown in Eq. (5):
where, the model parameters of CNN are denoted as ; the output results are represented by ; the normalization of the calculation is denoted as . denotes the input image dimension, and means the size of pixel blocks. The adaptation range of CBAMYOLOv5 is large, medium, and small objects. To reduce the detection range of the algorithm, the study integrates CNN with this algorithm. When the CBAMYOLOv5 algorithm is fused with CNN (CBAMYOLOv5-CNN), the research adopts a layer by layer fusion from the downsampling layer to the upsampling layer to generate the fusion algorithm CBAMYOLOv5-CNN as shown in Fig. 3.
Fig. 3Flow chart of fusion algorithm for CBAMYOLOv5-CNN
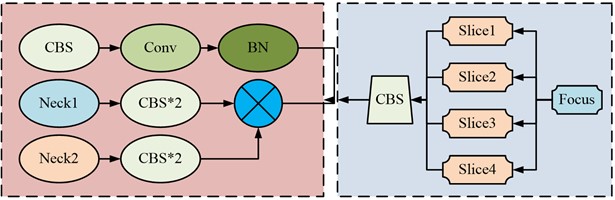
The fusion algorithm flowchart shown in Fig. 3 can be roughly divided into four parts. The source image is input through the Neck structure in CBAMYOLOv5, which first extracts the features of the image. Then it concatenates the downsampling method and uses five downsampling methods to convolution the object. Then, the downsampling and upsampling are fused into a special path to continuously collect shallow layers of the main part of the network. Finally, the downsampling sample monitoring probe with four detection nodes is refined to output pixels with different amounts of information. For edge noise contained in pixels, Gaussian denoising as shown in Eq. (6) is used in the study:
where, the image after Gaussian denoising is denoted as ; means the internal parameter of the Gaussian denoising kernel; expresses the grayscale value of the image pixels; the three primary colors of the image are denoted as , , . The Gaussian noise reduction process contains two parameter operators located in the horizontal and vertical directions, which can be denoted as and . By using them, Gaussian gradients in two directions can be calculated, as shown in Eq. (7):
where, the Gaussian gradients in the horizontal and vertical directions are denoted as , , respectively. The CBAMYOLOv5-CNN has stronger targeting for LSTs and can be applied to small target detection in ARSIs.
3.2. Construction of a LST detection model based on YOLOv5 in ARSIs
The CBAM module is introduced into the network structure of YOLOv5 to enhance the network's ability to pay attention to the target. The attention mechanism is introduced to improve the performance of YOLOv5 in target detection. CBAM focuses on image classification task, while YOLOv5 focuses on target detection. Therefore, the improvement of CBAM and YOLOv5 can improve the accuracy and speed of target detection. The algorithm introduces the mechanism of channel attention and spatial attention to improve the classification performance and refines the network structure to improve the performance of target detection. In the process of important information allocation in ARSIs, attention needs to be paid to the position information and abstract information of the pixel blocks it contains. For this purpose, the study maximizes the pooling of two types of modules globally, allowing them to be fully immersed in the channel. The upgraded two modules not only classify response features, but also perform targeted detection on them [18]. They operate using a parallel method, where two parameters are simultaneously extracted from the image, as shown in Fig. 4.
Fig. 4Working diagram of location information and abstract information extraction
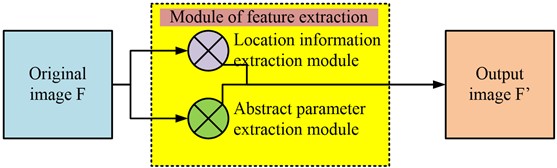
Fig. 4 shows the flowchart for extracting additional information from ARSIs. From Fig. 4, the input source image is extracted by position and abstract information, and then multiplied by pixels (denoted as ) for calculation. By paying attention to the image transportation channel, the automation of image dimensionality reduction is achieved [19]. The system parameters of the output image can be calculated using the source image, as shown in Eq. (8):
where, the output image is denoted as , and represents the set of positional information. If the current pixel block is similar in gradient to adjacent pixel blocks, the strongest block within the region boundary is retained. Considering the quadrilateral shape of high-altitude remote sensing images, they are affected by the spatial environment during rigid body transformation [20]. To avoid this impact, this study controls the shape and size of the quadrilateral to remain unchanged, controls for external influencing factors, and achieves accurate reading of ARSIs. The linear change in the image is controlled by the homogeneous coordinates of the pixel. The relationship between the two is shown in Eq. (9):
where, the intersection angle of the initial and end homogeneous coordinates of the pixel is recorded as , and the difference between the horizontal and vertical coordinates of two pixels is denoted by , respectively. The coordinates of the initial position of the pixel are marked as , and the coordinates of its end position are denoted as . In high-altitude remote sensing image monitoring, the receptive field of CNN is expanded by means of accretion. This method can quickly obtain image information, but it has disadvantages in traversing the whole world. This defect is improved by position weighting, as shown in Eq. (10):
where, the input pixel block is denoted as ; means the output pixel block; , indicate two random feature pixels, and can be used to calculate the similarity between the two pixels. The feature values of the input signal are calculated through . The parameters of standard pixels are expressed by and can be calculated using Eq. (11):
where, , denote the functions of two feature pixels, respectively. In the detection of LSTs in ARSIs, CBAMYOLOv5-CNN, due to its ability to retain some features in other pixels, carries redundant information and increases computational complexity without affecting the results [21]. Therefore, this study aims to filter redundant information by adjusting the size of the CNN sieve plate. This process exists in the convolutional layer, as shown in Fig. 5.
Fig. 5Screening process of redundant information in convolution layer
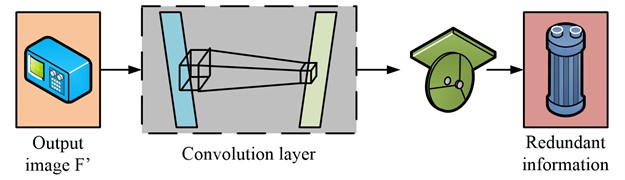
In Fig. 5, the extracted additional information first undergoes scaling in the convolutional layer, which marks and discards duplicate information. Then the remaining information will be introduced into CBAMYOLOv5 for further screening. When the reduction of information meets the requirements or the number of iterations reaches the preset level, the screening process terminates [22]. In this process, the regression equation of the anchor box can be used to detect the maturity of the screening results, represented by the following Eq. (12):
where, , mean the area of the anchor box at two adjacent random moments. The predicted values of the target detection results have a certain deviation, which can be used to determine the performance of the model. In the actual experimental results, there are true and false values, and the relationship between them is shown in Eq. (13):
where, denotes the true value of the positive example in the predicted results, while the true value and false value of the negative example are recorded as and , respectively. The , calculated using the two represent the accuracy and recall of the calculated results [23]. These two parameters can to some extent reflect the target detection ability of CBAMYOLOv5-CNN in ARSIs, but their shortcomings lie in not considering the impact of mean accuracy [24]. For this issue, the study uses Eq. (14) to supplement:
where, expresses the number of experiments conducted, and the average accuracy of a certain experiment is represented by [25]. The calculation method is shown in Eq. (15):
where, the score of a certain experiment is recorded as .
4. Comparative analysis of improved YOLOv5 algorithm and effectiveness analysis of target detection model
To verify the detection performance of YOLOv5 algorithm in a LST detection model, this study compared and verified the performance of the improved YOLOv5 algorithm proposed in the study. Afterwards, the actual application effect of the target detection model proposed based on the YOLOv5 algorithm would be analyzed to verify the superiority of the model. In the LST detection of this algorithm, firstly, the ARSI data set was collected, including image samples containing small targets and corresponding tag information, to ensure the diversity and representativeness of the data set. Then the ARSI was preprocessed and the tag information was corresponding to the image. Then, the network's perception ability of small targets would be enhanced, and appropriate model parameters would be selected according to the actual needs and data set characteristics. Finally, the study used the prepared data set to train the improved model. The experimental setting of the algorithm was carried out on image classification and target detection data sets, and the evaluation indexes were classification accuracy, detection accuracy and speed.
4.1. Performance comparison and analysis of improved YOLOv5 algorithm
To verify the performance of the improved IYOLOv5 algorithm based on YOLOv5 in detecting small targets, the study trained the algorithm on the Tiny-Person dataset. This dataset contained 1610 labeled images, including 794 in the training set and 816 in the testing set. The basic experimental environment settings are shown in Table 1.
The research parameters were set as follows: the resolution of the training image was 640×640×3; the number of iterations was 300; the batch size was 4; the initial and periodic learning rate were set to 0.01; the momentum of the learning rate was 0.937; the weight attenuation coefficient was 0.0005. The above parameters were selected for this experiment. To verify the superiority of IYOLOv5 algorithm in classification accuracy, this algorithm was compared with its similar YOLOv5, YOLOv6 and YOLOv7 algorithms. The confusion matrix generated by the above three algorithms and IYOLOv5 on Tiny-Person dataset is shown in Fig. 6. To make a fair comparison of SOTA, it is the basis of making a fair comparison to study and select a suitable data set. The data set is widely representative, including samples of multiple categories and different difficulty levels. When comparing, the research ensured that all models had the same hardware and software environment. This included using the same deep learning framework, the same version and the same compiler options. To ensure that the model was trained under the same conditions, the study avoided different training settings. According to different tasks, the experimental results were statistically analyzed, so that the performance of the model could be evaluated more accurately and compared reliably.
Table 1The experimental basic environmental parameters
Parameter variables | Parameter selection |
GPU | NVIDIA GeForce RTX 3080 |
CPU | Intel Core i7-11800H |
Internal memory | 16G |
Video memory | 10G |
Python | 3.7.0 |
Pytorch | 1.8.0 |
CUDA | 11.1 |
cuDNN | 8.1.0 |
Fig. 6Confusion matrix generated by different models on Tiny-person
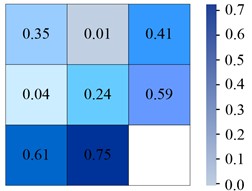
a) YOLOv6
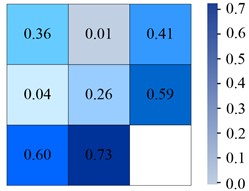
b) YOLOv7
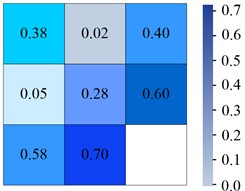
c) YOLOv5
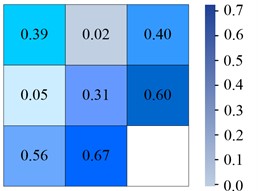
d) IYOLOv5
From Fig. 6(a), in the YOLOv6 algorithm, the classification accuracy of Sea-person and Earth-person was 35 % and 24 %, respectively. The probability of being predicted as a background was 61 % and 75 %, respectively. As shown in Fig. 6(b), in the YOLOv7 algorithm, the four experimental data were 36 %, 26 %, 60 %, and 73 %, respectively. As shown in Fig. 6(c), the experimental outcomes in YOLOv5 algorithm were 38 %, 28 %, 58 %, and 70 %, respectively. As shown in Fig. 6(d), the experiment findings in the IYOLOv5 algorithm were 39 %, 31 %, 56 %, and 67 %, respectively. From this, the YOLOv5 algorithm had a serious leakage phenomenon, and the IYOLOv5 algorithm had the highest classification accuracy. Compared to the YOLOv5 algorithm, the classification accuracy of the IYOLOv5 algorithm Sea-person has been improved by 4 %, while that of Earth-person has been improved by 7 %, which could effectively improve the problem of small target miss detection. To verify the superiority of the proposed IYOLOv5 algorithm, this study compared it with YOLOv5, YOLOv6, and YOLOv7 algorithms. The performance test was conducted on the Tiny-Person test set, and the PR curve and accuracy of the algorithm were used as experimental indicators. The specific results are shown in Fig. 7.
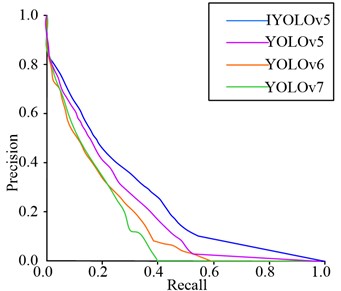
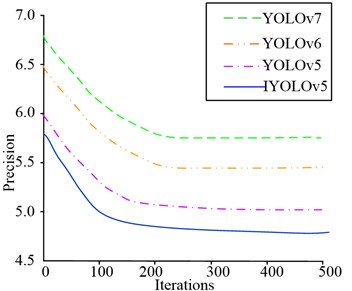
Fig. 7PR curves and map for different models on the Tiny-person test set
a) PR curve of MTCNN algorithm
b) Maximum absolute percentage error
As shown in Fig. 7(a), when the recall rate of YOLOv6 algorithm was 0.58 and YOLOv7 algorithm was 0.4, the accuracy of the algorithm was 0. Although YOLOv5 did not have an accuracy of 0, the PR curve of the YOLOv5 algorithm had a smaller area enclosed by the coordinate axis, while the PR curve of the IYOLOv5 algorithm had the largest area enclosed by the coordinate axis, so its performance was optimal. As shown in Fig. 7(b), both YOLOv6 and YOLOv7 algorithms converged to 210 iterations, with maximum absolute percentage errors of 6.7 % and 6.5 %, respectively. The maximum absolute percentage error of YOLOv5 algorithm tended to converge at 160 iterations, at which point it was 6.0 %. The algorithm proposed in this study tended to converge after 120 iterations, with a maximum absolute percentage error of approximately 5.8 %, indicating that the algorithm had higher accuracy. To further validate the performance advantages of the IYOLOv5 algorithm, the accuracy of the algorithm was taken as the experimental indicator, and the specific results are shown in Fig. 8.
Fig. 8Accuracy of different models on the Tiny-person test set
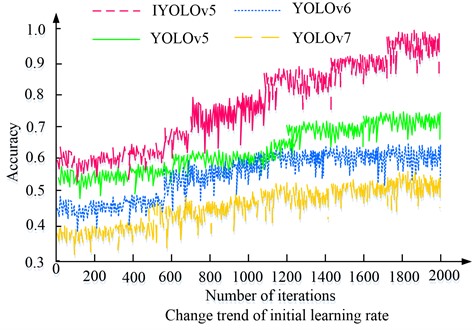
In Fig. 8, the accuracy of all four algorithms increased with the number of iterations. Among the four algorithms, YOLOv5s algorithm had the highest overall accuracy, with a maximum accuracy of 0.987, which was higher than YOLOv7 algorithm’s 0.603, YOLOv6 algorithm’s 0.479, and YOLOv5 algorithm’s 0.423. The above results indicated that from the accuracy dimension, the YOLOv5s algorithm performed better than the three comparative algorithms. To further analyze the performance of different algorithms, four algorithms were studied for live detection on the Tiny-Person dataset, and some of the live detection results are shown in Fig. 9.
Fig. 9Comparison of detection results of Tiny-person dataset
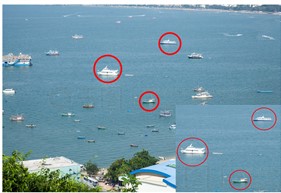
a) YOLOv6
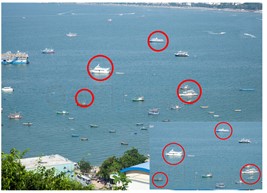
b) YOLOv7
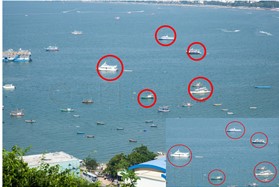
c) YOLOv5
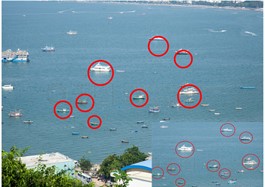
d) IYOLOv5
From Fig. 9, for small targets with long distances and low contrast, the YOLOv7 algorithm had the best detection performance. It detected the least number of image objects, while other models had more serious missed detections. The best detection effect was the IYOLOv5 algorithm, where almost all objects in the image were detected, which could meet the needs of real-time monitoring. From this, the IYOLOv5 algorithm had the best performance in small target detection. Based on the comparison of multiple dimensions mentioned above, the overall performance of the IYOLOv5 algorithm proposed in this study was superior to similar comparison algorithms. Therefore, applying it to aerial image target detection models could improve the detection accuracy of the detection model, thereby promoting the development of the field of aerial photography.
4.2. Performance comparison and analysis of IYOLOv5 target detection models
To analyze the performance of the target detection model proposed in the study, an aerial image dataset was selected as the test set, and it was tested with multiple target detection models in this dataset. There were a total of 9866 datasets, mainly sourced from the dataset of the first “Aviation Cup” target detection and recognition competition organized by the laboratory. The experimental hardware platform was a Dell Precision 7750 mobile workstation with an Inter Xeon E2286M8 core 16M cache CPU, 64G memory, and NVIDIA Quadro RTX5000 graphics card with 16GB GDDR6. When overlay threshold was set to 0.5, the input size of the training set was set to 640×640. Different target detection models were listed for testing on the test set, and the test results are shown in Table 2 [26].
Algorithm indicators are quantitative indicators used to evaluate and measure the performance and effect of an algorithm. These indicators can help us understand the advantages and disadvantages of the algorithm and its applicability in different scenarios. Accuracy refers to the proportion of correctly classified samples to the total number of samples in the classification algorithm, which can be calculated by dividing the correctly classified samples by the total number of samples. in Table 2 referred to the value of IOU taken from 50 % to 95 % in steps of 5 %. From Table 2, the D-YOLOv5s target detection model had the highest MAP50 value, which was 94.69 %. The IYOLOv5 target detection model had the fastest detection speed, which was 54 m/s. The CSP-YOLOv5 target detection model had the lowest MAP50 value, while the Res-Leaky-YOLOv5 and CSP-Leaky YOLOv5 target detection models had the slowest average detection speed, which was 46m/s. The target detection speed performance of DYOLOv5s target detection model with Mish loss function was the best. According to the results in Table 2, different target detection models obtained varying evaluation index F1 values and MAP results as the detection threshold settings changed, as shown in Fig. 10.
Table 2Performance test of object detection algorithm based on YOLOv5 framework
Detection model | Densemap | Backbone | Activation | MAP50 | MAP75 | Average speed / ms | |
CSP-YOLOv5 | – | CSPDarknet | Mish | 83.25 | 81.47 | 55.96 | 50 |
D-CSP-YOLOv5 | √ | CSPDarknet | Mish | 84.36 | 83.78 | 57.48 | 48 |
Res-Leaky-YOLOv5 | – | Resnet101 | Leaky | 83.89 | 79.37 | 52.69 | 45 |
D-Res-Leaky-YOLOv5 | √ | Resnet101 | Leaky | 87.13 | 83.14 | 56.23 | 46 |
CSP-Leaky-YOLOv5 | – | CSPDarknet | Leaky | 84.15 | 80.45 | 52.47 | 45 |
D-CSP-Leaky-YOLOv5 | √ | CSPDarknet | Leaky | 86.94 | 82.36 | 53.64 | 46 |
IYOLOv5 | – | CSPDarknet | Mish | 87.58 | 85.69 | 57.98 | 54 |
D-IYOLOv5 | √ | CSPDarknet | Mish | 94.69 | 91.78 | 63.45 | 53 |
Fig. 10IoU change curve of different detection algorithms
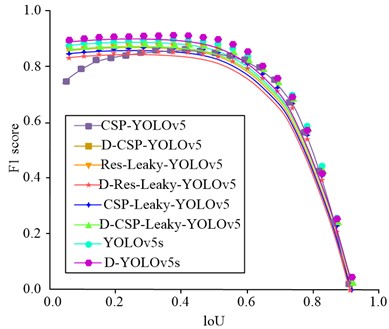
a) The change curve of F1 value with loU is detected
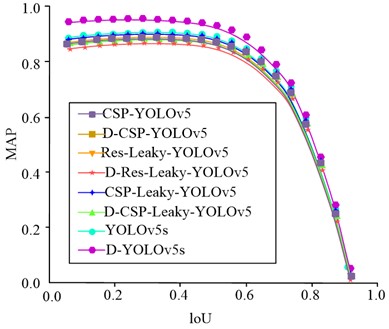
b) Detection algorithm MAP change curve with loU
The algorithm indicators in this study were used to measure the performance of the algorithm, including accuracy, recall, F1 value and root mean square error. Among them, accuracy refers to the proportion of correctly classified samples in the algorithm to the total number of samples; recall refers to the ratio of the number of samples predicted to be positive to the number of truly positive samples in the algorithm; F1 value is the harmonic average of accuracy and recall, and mean square error is the square of the difference between the predicted value and the true value of each sample. Using these indicators, they could be evaluated through cross-validation, and then the performance and effect of different algorithms were compared. From Fig. 10(a), the F1 value of the D-YOLOv5s and D-CSP-YOLOv5 target detection models was the highest and the lowest, at 90.36 % and 72.45 %, respectively. The use of Mish loss function in CSPDarknet was more stable and accurate than Leaky, but the complexity of the algorithm has increased, resulting in slower running speed. The CSPDarknet network could more comprehensively utilize the low complexity characteristics of shallow layers and had better performance than the Resnet101 network. From this, the IYOLOv5 target detection model proposed by the research institute extracted shallow features from the network and concatenated them with the upsampled convolutional layer, which to some extent improved the algorithm’s detection accuracy and running speed for small targets. From Fig. 10(b), the IYOLOv5 target detection model had the highest MAP value of 97.69 %, while the D-CSP-YOLOv5 algorithm had the lowest MAP value of 83.54 %. In summary, when the inspection threshold is set low, the detection F1 value and MAP can maintain a high level.
5. Conclusions
The purpose of this study is to use CBAM to enhance YOLOv5 algorithm to improve the detection ability of LSTs in ARSIs, and use CNN to eliminate redundant information in the algorithm to generate a fusion algorithm CBAMYOLOv5-CNN. This algorithm has been widely used in the fields of personnel search and rescue and danger prediction. The experiment was set in parameter comparison. The batch size was 4, and the iteration was 300 times. The initial learning rate and periodic learning rate were both set to 0.01, the learning rate momentum was 0.937, and the weight attenuation coefficient was 0.0005. In the classification results of target detection, the accuracy of CBAMYOLOv5-CNN algorithm in Sea_person classification was 39 %, and the accuracy in Earth_person classification was 31 %. Compared with YOLOv5, YOLOv6 and YOLOv7, CBAMYOLOv5-CNN performed best, and their classification accuracy was 38 %/28 %, 35 %/24 % and 36 %/26 % respectively. In the performance comparison experiment of the algorithm, the area enclosed by the PR curve and the coordinate axis of CBAMYOLOv5-CNN was the largest, while the maximum absolute percentage errors of the other three models were 6.0 %, 6.7 % and 6.5 % respectively. This showed that the fusion algorithm had the best performance in the same target detection field. When comparing the IOU value with the F1 value, the F1 value and MAP of CBAMYOLOv5-CNN could maintain a high level under the condition that the IOU value was controlled from 50 % to 95 % and the step size was 5 %. The experimental results showed that compared with the other three algorithms, CBAMYOLOv5-CNN had better detection effect on LSTs and could effectively distinguish objects of different regions and sizes. However, the algorithm is only suitable for analyzing static targets, while the targets in practical application are dynamic. Therefore, in the future research, dynamic analysis is equally important for the detection of LSTs in ARSIs, and further research is needed.
References
-
Y. Liu, C. Zhang, W. Wu, B. Zhang, and F. Zhou, “MiniYOLO: A lightweight object detection algorithm that realizes the trade‐off between model size and detection accuracy,” International Journal of Intelligent Systems, Vol. 37, No. 12, pp. 12135–12151, Sep. 2022, https://doi.org/10.1002/int.23079
-
Y. Tao, Z. Zong, and Z. Jun, “Low-altitude small-sized object detection using lightweight feature-enhanced convolutional neural network,” Journal of Systems Engineering and Electronics, Vol. 32, No. 4, pp. 841–853, 2021.
-
P. C. Jena, D. R. Parhi, and G. Pohit, “Fault measurement in composite structure by fuzzy-neuro hybrid technique from the natural frequency and fibre orientation,” Journal of Vibration Engineering and Technologies, Vol. 5, No. 2, pp. 124–136, 2017.
-
P. C. Jena, D. R. Parhi, and G. Pohit, “Dynamic Investigation of FRP Cracked Beam Using Neural Network Technique,” Journal of Vibration Engineering and Technologies, Vol. 7, No. 6, pp. 647–661, Jul. 2019, https://doi.org/10.1007/s42417-019-00158-5
-
Y. Li, M. Ni, and Y. Lu, “Insulator defect detection for power grid based on light correction enhancement and YOLOv5 model,” Energy Reports, Vol. 8, pp. 807–814, Nov. 2022, https://doi.org/10.1016/j.egyr.2022.08.027
-
K. Konen and T. Hecking, “Using synthetic images to evaluate and improve object detection neural network performance on aerial image datasets,” International Journal of Semantic Computing, Vol. 16, No. 3, pp. 339–356, Jun. 2022, https://doi.org/10.1142/s1793351x22420016
-
H. M. Hammed, O. M. Almiahi, and O. Shauchuk, “Detection of anthropogenic objects based on the spatial characteristics of their contour in aerial image,” Indonesian Journal of Electrical Engineering and Computer Science, Vol. 23, No. 1, pp. 206–215, 2021, https://doi.org/10.11591/ijeecs.v23.i1.pp
-
J. Zhu, Z. Wang, S. Wang, and S. Chen, “Moving object detection based on background compensation and deep learning,” Symmetry, Vol. 12, No. 12, p. 1965, Nov. 2020, https://doi.org/10.3390/sym12121965
-
Z. Ma et al., “Maize leaf disease identification using deep transfer convolutional neural networks,” International Journal of Agricultural and Biological Engineering, Vol. 15, No. 5, pp. 187–195, Jan. 2022, https://doi.org/10.25165/j.ijabe.20221505.6658
-
Y. Liu, C.-Q. Wang, and Y.-J. Zhou, “Camouflaged people detection based on a semi-supervised search identification network,” Defence Technology, Vol. 21, No. 3, pp. 176–183, Mar. 2023, https://doi.org/10.1016/j.dt.2021.09.004
-
T. D. Tran, N. H. Bui, K. T. Tran, and N. T. Tran, “Monte Carlo simulation of a cone-beam CT system for lightweight casts,” Radiation Detection Technology and Methods, Vol. 5, No. 4, pp. 504–512, Oct. 2021, https://doi.org/10.1007/s41605-021-00279-0
-
J. Du, H. Lu, M. Hu, L. Zhang, and X. Shen, “CNN‐based infrared dim small target detection algorithm using target‐oriented shallow‐deep features and effective small anchor,” IET Image Processing, Vol. 15, No. 1, pp. 1–15, Dec. 2020, https://doi.org/10.1049/ipr2.12001
-
J. Yang, Y. Cui, F. Song, and T. Lei, “Infrared small target detection based on non-overlapping patch model via l0-l1 norm,” Electronics, Vol. 9, No. 9, p. 1426, Sep. 2020, https://doi.org/10.3390/electronics9091426
-
Z.-B. Qiu, Y. Ma, F. Fan, J. Huang, M.-H. Wu, and X.-G. Mei, “A pixel-level local contrast measure for infrared small target detection,” Defence Technology, Vol. 18, No. 9, pp. 1589–1601, Sep. 2022, https://doi.org/10.1016/j.dt.2021.07.002
-
D. Mcnamara, W. Mell, and A. Maranghides, “Object-based post-fire aerial image classification for building damage, destruction and defensive actions at the 2012 Colorado Waldo Canyon Fire,” International Journal of Wildland Fire, Vol. 29, No. 2, pp. 174–189, Jan. 2020, https://doi.org/10.1071/wf19041
-
M. Unver, M. Olgun, and E. Ezgi Turkarslan, “Cosine and cotangent similarity measures based on Choquet integral for Spherical fuzzy sets and applications to pattern recognition,” Journal of Computational and Cognitive Engineering, Vol. 1, No. 1, pp. 21–31, Jan. 2022, https://doi.org/10.47852/bonviewjcce2022010105
-
K. Takiyama, H. Guo, K. Fujii, M. Yasugi, S. Suyama, and H. Yamamoto, “Improved modulation transfer function (MTF) for aerial image formed with AIRR by use of two transparent spheres,” in SID Symposium Digest of Technical Papers, Vol. 53, No. 1, pp. 1257–1260, Jun. 2022, https://doi.org/10.1002/sdtp.15735
-
M. Wang and J. Lin, “Retrieving individual tree heights from a point cloud generated with optical imagery from an unmanned aerial vehicle (UAV),” Canadian Journal of Forest Research, Vol. 50, No. 10, pp. 1012–1024, Oct. 2020, https://doi.org/10.1139/cjfr-2019-0418
-
N. Yuba et al., “Discriminating Pennisetum alopecuoides plants in a grazed pasture from unmanned aerial vehicles using object‐based image analysis and random forest classifier,” Grassland Science, Vol. 67, No. 1, pp. 73–82, Jun. 2020, https://doi.org/10.1111/grs.12288
-
P. C. Jena, D. R. Parhi, and G. Pohit, “Dynamic study of composite cracked beam by changing the angle of bidirectional fibres,” Iranian Journal of Science and Technology, Transactions A: Science, Vol. 40, No. 1, pp. 27–37, 2016.
-
S. Sahoo and P. C. Jena, “Advances in modelling and optimization of manufacturing and industrial systems,” in Lecture Notes in Mechanical Engineering, Vol. 38, Singapore: Springer Nature Singapore, 2023, pp. 271–287, https://doi.org/10.1007/978-981-19-6107-6
-
M. Rajabi et al., “Novel hybrid machine learning optimizer algorithms to prediction of fracture density by petrophysical data,” Journal of Petroleum Exploration and Production Technology, Vol. 11, No. 12, pp. 4375–4397, Oct. 2021, https://doi.org/10.1007/s13202-021-01321-z
-
P. C. Jena, “Fault assessment of FRC cracked beam by using neuro-fuzzy hybrid technique,” Materials Today: Proceedings, Vol. 5, No. 9, pp. 19216–19223, 2017, https://doi.org/10.12989/sss.2015.16.6.1107
-
A. K. Yıldız, H. Keles, and S. Aras, “Estimation of canopy area of fruit trees using light unmanned aerial vehicle (UAV) and image processing methods,” Turkish Journal of Agriculture – Food Science and Technology, Vol. 8, No. 5, pp. 1039–1042, Jun. 2020, https://doi.org/10.24925/turjaf.v8i5.1039-1042.3164
-
R. de Lima, A. A. Cabrera-Ponce, and J. Martinez-Carranza, “Parallel hashing-based matching for real-time aerial image mosaicing,” Journal of Real-Time Image Processing, Vol. 18, No. 1, pp. 143–156, Mar. 2020, https://doi.org/10.1007/s11554-020-00959-y
-
J. Zhang, X. Liang, M. Wang, L. Yang, and L. Zhuo, “Coarse-to-fine object detection in unmanned aerial vehicle imagery using lightweight convolutional neural network and deep motion saliency,” Neurocomputing, Vol. 398, pp. 555–565, Jul. 2020, https://doi.org/10.1016/j.neucom.2019.03.102
About this article

The authors have not disclosed any funding.
The datasets generated during and/or analyzed during the current study are available from the corresponding author on reasonable request.
The authors declare that they have no conflict of interest.
