Abstract
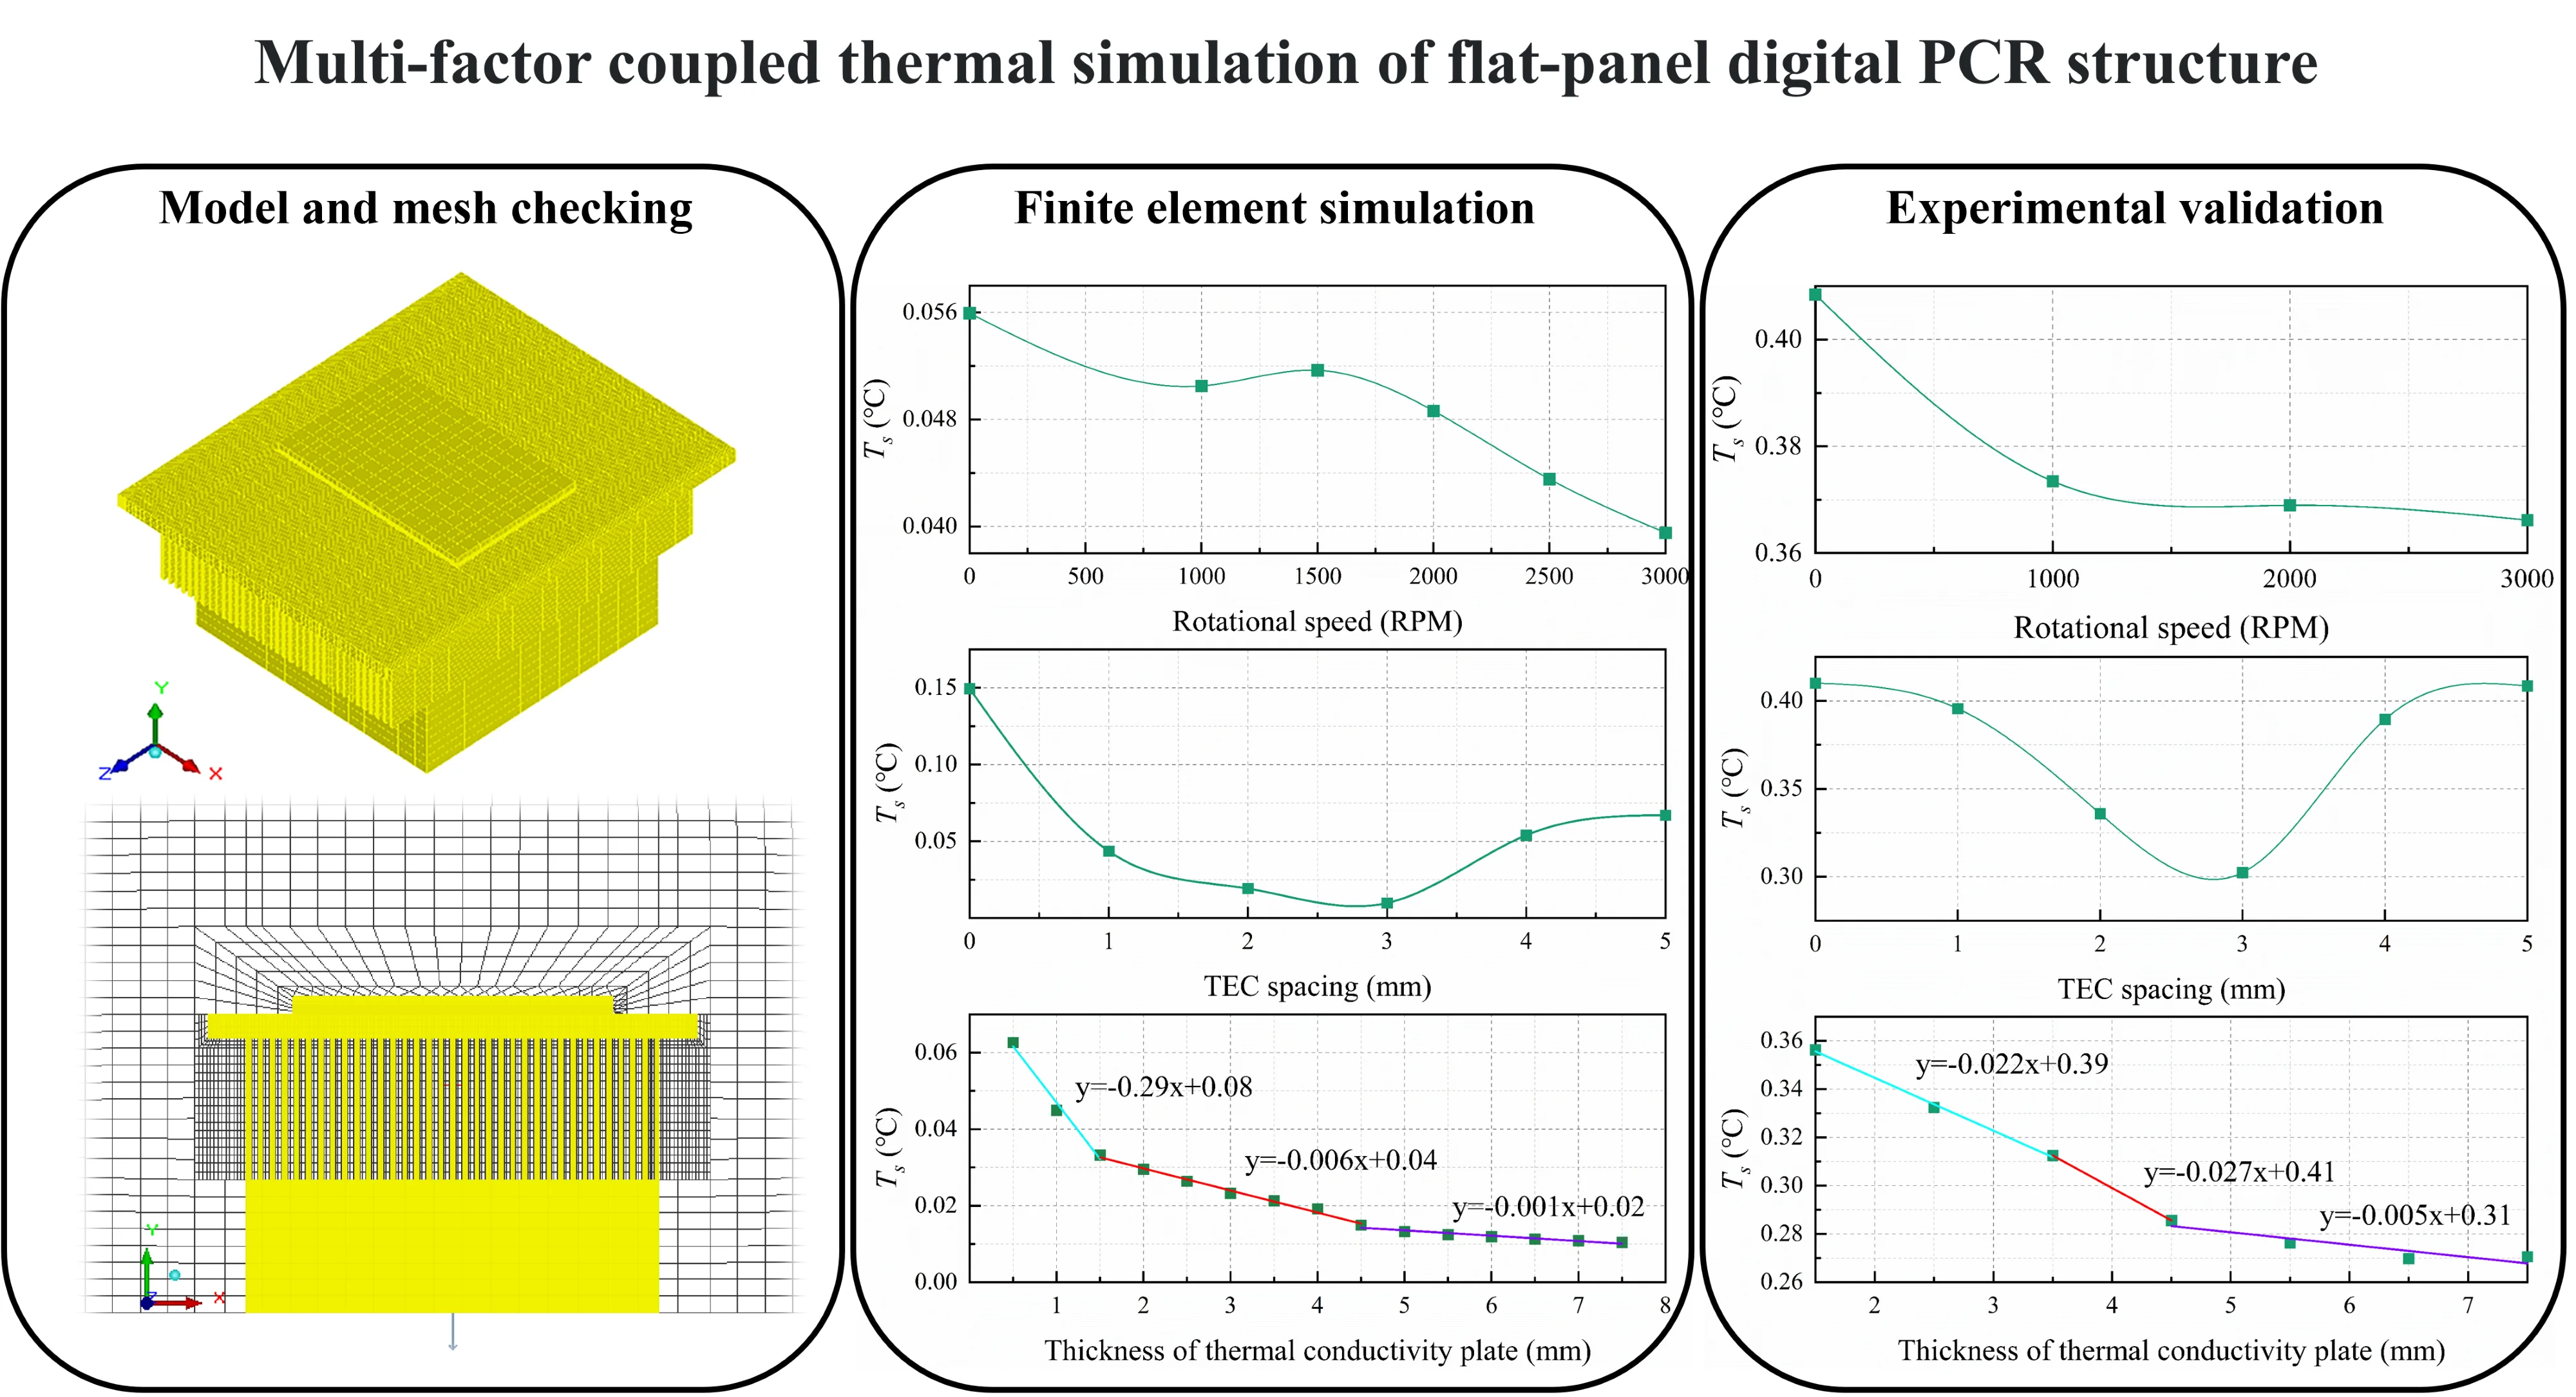
To achieve uniform reaction temperature in flat-plate digital polymerase chain reaction (dPCR), we propose a multi-factor coupled thermal simulation method for the structure of flat-plate digital PCR using finite element analysis. This will help us obtain the optimal method for the structure of flat-plate dPCR. Thermal simulations were conducted to analyze the effects of forced air cooling, thermoelectric cooler (TEC) arrangement spacing, and heat-conducting plate thickness on the temperature uniformity of the flat-plate dPCR. The resulting isothermal surfaces and velocity magnitude vectors were used to summarize the impact of each factor. The study found that maintaining a mechanical fan speed of 3000 revolutions per minute (RPM) ±10 % during the heating period resulted in a 29.3 % reduction in the standard deviation of the temperature on the surface of the heat-conducting plate. Additionally, when the TEC spacing was between 2 mm and 3.5 mm, the standard deviation of the temperature on the plate's surface decreased by 87.1 % to 93.4 %. When the thickness of the thermal plate ranges from 3.5 mm to 4.5 mm, the standard deviation of the temperature on the surface of the thermal plate varies by approximately 0.006. The experimental results, obtained by sampling and analyzing the temperature on the surface of the thermal plate, are consistent with the simulation results. This proves that the method is informative in determining the structural parameters of the dPCR to enhance temperature uniformity.
Highlights
- Study of the effect of forced air cooling on the temperature uniformity of flat-panel digital PCR
- Study of the effect of TEC spacing on the temperature uniformity of plate-based digital PCR
- Study of the effect of heat-conducting plate thickness on the temperature uniformity of flat-panel digital PCR
1. Introduction
The concept of Miniaturized Total Chemical Analysis Systems (μTAS) was introduced by Manz et al. in 1990 [1], the Digital Polymerase Chain Reaction (dPCR) concept was formally introduced by Vogelstein and Kinzler in 1999 [2], and the method for processing individual PCR molecules in water-in-oil emulsions was proposed by Diehl et al. in 2006 [3]. With the development of next-generation materials and micro and nano processing technologies, researchers have combined microfluidics with dPCR technology, and two dPCR approaches have emerged, micro-drop dPCR (dropletdPCR, ddPCR) and chip dPCR (cdPCR). With the advantages of high sensitivity, strong specificity, absolute quantification, good accuracy and strong anti-interference ability, dPCR technology has been increasingly used in scenarios such as non-invasive prenatal testing, precision medicine, animal vaccine research, infection diagnosis and management in intensive care medicine, and water quality monitoring [4]-[8]. dPCR is a method for absolute quantification of nucleic acid molecules by dispersing a large amount of diluted nucleic acid solution into the reaction chamber of the chip, amplifying it by PCR, counting the number of positives and negatives in the reaction chamber, and the ratio of both, and calculating the initial copy number concentration of the target DNA molecule according to the Poisson distribution model [2].
According to the principle of dPCR amplification of nucleic acid molecules, the PCR reaction takes place in tens of thousands of reaction chambers, and the temperature control in anyone chamber needs to be up to standard to reduce the non-specificity of the reaction. Digital PCR reaction conditions are more refined than traditional PCR and real-time fluorescence quantitative PCR temperature control. Previously, different researchers have performed modeling and analysis for real-time fluorescence quantitative PCR temperature control systems. C. Liu et al. designed a finite element model of the reaction cell of the quantitative PCR (qPCR) instrument, and the simulation results coincided with the theoretical calculations, which provided a theoretical basis for the development of the qPCR instrument [9]. Y. Yao et al. established an equivalent circuit model of the qPCR system based on TEC and simulated it through the circuit simulation software Multisim, which provides a simple and effective method for the design of the qPCR system [10]. J. Pang et al. analysed the effects of spatial dimensions, channel diameter and fluid velocity on the temperature distribution within the channel of a microfluidic chip by the finite element method and designed a spatial continuous-flow PCR chip based on single-temperature controlling module suitable for dPCR [11]. M. Gaňová et al. proposed a method for temperature inhomogeneity detection and temperature sensor calibration on dPCR chips [12]. F. Talebi presents a two-step continuous flow microfluidic device for PCR [13]. Few researchers have investigated the effects of flat-panel digital PCR heat source arrangement and forced air cooling on temperature, so this paper will discuss them.
Commonly used temperature detection methods include infrared radiation thermometer, micro-wave thermoacoustic tomography (MITAT), and thermocouple sensor temperature measurement. Among them, infrared radiation thermometer is susceptible to external thermal radiation, airflow, humidity, etc., for the bright or polished metal surface temperature readings have a greater impact. MITAT is a biomedical imaging technology, both the high contrast of microwave imaging and ultrasound imaging of high resolution. J. Li et al. had used the MITAT technology to establish a preclinical system prototype for Focused Microwave Breast Hyperthermia guide [14]. Thermocouple sensor temperature measurement has a wide range of temperature measurements, fast response speed, and high durability. As this experiment needs to accurately measure the surface temperature of the heat-conducting plate, the thermocouple sensor is chosen to measure the temperature.
Finite Element Method (FEM) is a fairly mature method for solving engineering designs, which can speed up product design and iterative optimization, and many researchers and scholars use FEM to study the structural properties of materials [15]-[16], temperature analysis of equipment [17], optimization of the electric field distribution structure of EBCOMS to improve the charge collection efficiency [18], prediction of mechanical and structural performance in special environments [19]-[21], failure analysis of equipment[22]. In this paper, finite element analysis will be used to solve and analyze the structural factors affecting the temperature uniformity of flat plate dPCR thermal conductive plates.
Given this, this paper will use Ansys Icepak to perform electro-thermal simulation and optimization of the basic structure of the flat-panel digital PCR and collect data by PT1000 to compare and analyze the measurement results with the simulation results to verify the rationality.
According to the laws of mass, momentum and energy conservation, the following CFD mathematical models for fluid thermal simulation are established [23]-[24].
Energy conservation equation:
where is constant heat capacity, is temperature and is viscous dissipation.
Reynolds number calculation method:
where is the air density of 1.29 Kg/m³, is the airflow velocity, is the dynamic viscosity of air, and is the characteristic size.
Heat transfer calculation formula:
where is the thermal conductivity of the material, is the cross-sectional area perpendicular to the direction of thermal conductivity and is the temperature gradient along the normal to the isothermal surface.
Forced air-cooled heat exchange system calculation:
where is the thermal conductivity and is the characteristic size.
2. Materials and methods
2.1. Model and mesh checking
The fluid heat transfer part of the microfluidic chip is neglected in this study due to the high efficiency of heat transfer and the micro-nanometer level of flow channel width in the microsystem chip, and the limited sample capacity in the microfluidic chip. The flat plate dPCR thermal cycling system is a top-down tight-fitting system, which includes a thermal conductor plate, TECs, and heat dissipation components, and the finite element simulation of the flat plate dPCR thermal cycling system is performed using ANSYS Icepak software.
Fig. 1Isometric view of flat-panel digital PCR finite element model
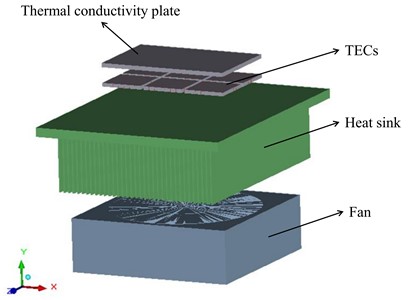
The Icepak self-modeling method was used to build the flat plate dPCR thermal cycle model, see Fig. 1, and set the material properties and boundary conditions of each module. The dimensions of the flat plate dPCR thermal cycle model are 200 mm×123.08 mm×248 mm, the dimensions of the computational domain are 456 mm×268.4 mm×496 mm, and other specific physical parameters are shown in Tables 1-2. The experiments assume that the air is an incompressible fluid, with an ambient temperature of 25 °C, and a pressure of 101325 N/m2. The calculation area Cabinet’s hexagonal properties are Opening, and the air can flow in and out, accompanied by energy transfer. The experiment selects a zero equation turbulence model for calculation.
Table 1Physical parameters of related materials
Module | Material | Density (kg/m3) | Specific heat (J/kg·K) | Conductivity (W/m·K) | |||
Thermal conductivity plate | 6061-T4 Aluminum alloy | 2700 | 896 | Isotropic | 154 | ||
Heat sink | |||||||
TEC | Ceramic based thickness | Alumina | 3970 | 61 | Isotropic | 27 | |
Metal gaskets | Copper and Air | 3124.34 | 381 | Orthotropic | X | 0.026 | |
Y | 148.06 | ||||||
Z | 0.026 | ||||||
P/N Semiconductor | Bismuth-Telluride and Air | 715.645 | 660 | Orthotropic | X | 0.026 | |
Y | 0.467 | ||||||
Z | 0.026 | ||||||
Table 2Parameters of heat sink, fan and TEC
Module | Related parameters | Value |
Heat sink | Fin count | 35 |
Fin spacing (mm) | 3.16 | |
Fan | Fan radius (mm) | 72.5 |
Hub radius (mm) | 30.4 | |
Fan case size (mm) | 160 | |
Fan case height (mm) | 51.6 | |
TEC | Number of couples | 127 |
T.E. element height (mm) | 1.3 | |
T.E. element pitch (mm) | 1 | |
T.E. element area/height (mm) | 1.73 | |
Ceramic based thickness (mm) | 0.76 |
Hexa unstructured meshing is performed on the established digital PCR thermal cycling system model, and the mesh is locally area encrypted to ensure that the mesh is adherent to the body, to improve the quality of the mesh, and to sure that the calculations convergr. Fig. 2 shows the mesh delineation when the TEC spacing is 1 mm, and the thickness of the heat-conducting plate is 2 mm. The minimum rate of grid face alignment in all experiments in this article is 0.434548, which is greater than 0.15, indicating good grid quality.
Fig. 2Mesh generation of flat-panel digital PCR finite element model
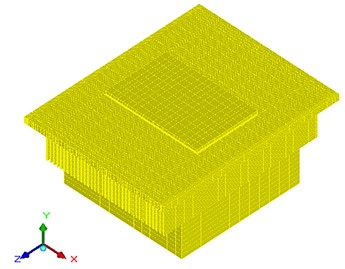
a) Flat-panel digital PCR grid surface inspection
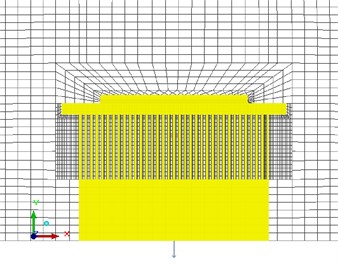
b) Flat-panel digital PCR cut grid inspection
2.2. Forced air-cooled
The maximum speed of the fan selected for the experiment is 3000 RPM±10 %, and Table 3 shows the air flow-air pressure curves (P-Q curves) corresponding to different speeds. In this experiment, the models of the flat-panel dPCR system at different speeds were simulated instantaneously. The time step was 17s, the number of iteration steps per second was 40, and the surface of the heat conduction plate was heated to 95±0.5 ℃. Subsequently, a steady-state analysis was conducted with an iteration step of 150. The number of system grid divisions is 372240, and the face alignment ratio is 0.456738~1.
Table 3Pressure-Volume flow value at 3000 RPM
Volume flow (CFM) | Pressure (mm-H2O) |
0 | 17.5 |
13.09 | 15.94 |
30.55 | 13.59 |
41.45 | 12.03 |
54.55 | 10.15 |
80 | 8 |
104.73 | 6.72 |
124.36 | 5.94 |
141.82 | 4.84 |
160 | 4 |
218.18 | 0 |
Set the speed of the exhaust fan to 0 RPM, 1000 RPM, 1500 RPM, 2000 RPM, 2500 RPM, and 3000 RPM. The P-Q curve at different speeds can be calculated using Eq. (6) and Eq. (7):
where represents the P-Q curve static pressure corresponding to the new rotation rate, represents the P-Q curve static pressure corresponding to the rated rotation rate, is the new rotation rate of the fan, is the rated rotation rate, represents the volume flow of the P-Q curve corresponding to the new rotation rate, represents the volume flow of the P-Q curve corresponding to the rated rotation rate.
Fig. 3Vector diagram of airflow velocity at the same XZ plan
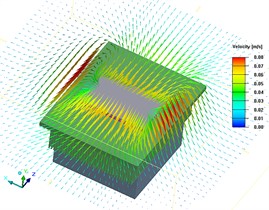
a) The fan rotational speed is 1000 RPM and axis coordinate is 0.033722
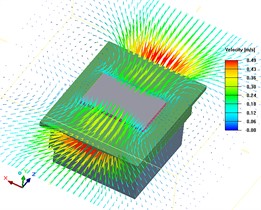
b) The fan rotational speed is 3000 RPM and axis coordinate is 0.033722
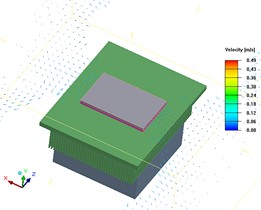
c) Local velocity vector diagram (0.08 m/s) at a fan speed of 3000 RPM and a -axis coordinate of 0.033722
According to Fig. 3, as fan speed increases, the flow velocity of air on the surface of thermal conductive plate increases, which affects the flow situation of air above the thermal conductive plate, and thus affects the temperature uniformity of thermal conductive plate.
To analyze the effect of forced air cooling on temperature uniformity, we selected the top surface of the heat-conducting plate as the research object. We sampled 96 points by accurately inputting the coordinate values, selecting one point every 5 mm, as shown in Fig. 4 Temperature uniformity , temperature standard deviation , and temperature confidence interval with a 95 % confidence level were used as the evaluation indices of temperature uniformity:
where is the number of sampling points, 1 , 96. is the temperature of the sampling point, is the average temperature of sampling points, and is the standard deviation of sampling points. The significant level is 0.05, 1.6611, and the confidence interval of 95 % of the temperature of the heat conducting plate is .
Fig. 4Description of sampling location
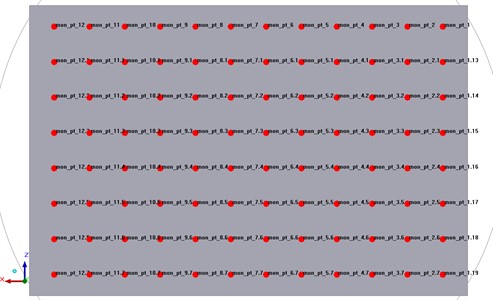
Fig. 5Analysis of heat transfer plate uniformity at different fan speeds
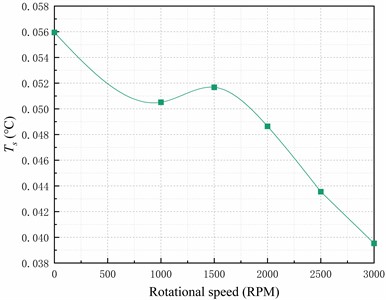
a) The temperature standard deviation of sampling points
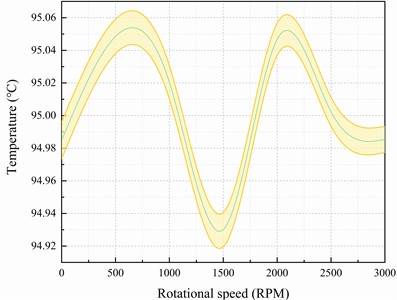
b) The 95 % confidence interval of sampling points
Fig. 5 demonstrates that the standard deviation of the temperature at the sampling points on the top surface of the heat-conducting plate decreases by 9.7 % when the fan is turned on to 1000 RPM, resulting in improved uniformity. Furthermore, increasing the fan speed to 3000 RPM reduces the standard deviation of the temperature on the top surface of the heat-conducting plate by 29.3 % compared to when there is no fan.
2.3. TEC layout
The structure of TEC with the heat-conducting plate is a single-sided arrangement, which can be categorised as compact, properly spaced, grouped and random. The TEC layout for flat-panel digital PCR is 2 rows × 3 columns, as shown in Fig. 6.
Fig. 6Schematic diagram of TEC layout
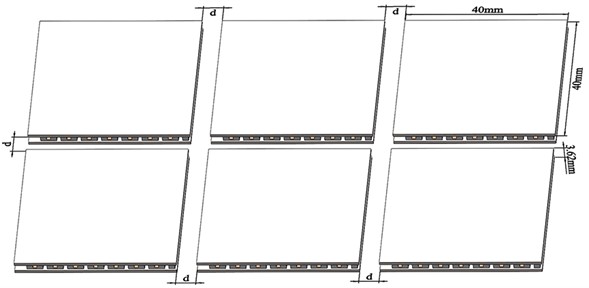
In this paper, a total of six different TEC layouts (0 mm, 1 mm, 2 mm, 3 mm, ... , 5 mm) were tested to determine the optimal layout and specific spacing. Six simulations of the TEC spacing d in the XY plane are carried out using the finite element method. The face alignment ratios are above 0.15, indicating good mesh quality. For this experiment, we chose the data sampling method described in subsection 2.2, and sampled 96 points and calculated the standard deviation for each group of sampling points.
Fig. 7Analysis of heat transfer plate uniformity with different TEC spacing
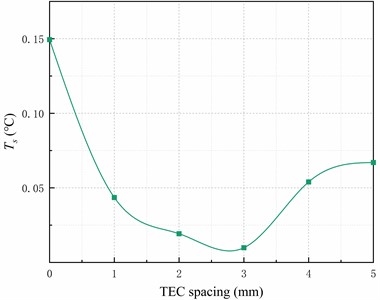
a) The temperature standard deviation of sampling points
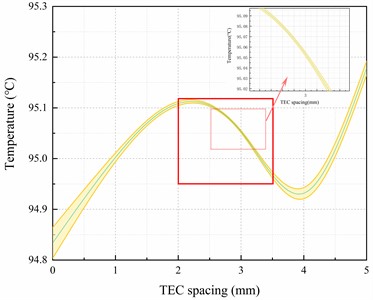
b) The 95 % confidence interval of sampling points
Fig. 7(a) demonstrates that the standard deviation of temperature decreases by 87.1 % to 93.4 % when the TEC layout spacing is between 2mm and 3.5mm, compared to a TEC spacing of 0mm. Additionally, Fig. 7(b) shows the heat conducting plate's temperature with the smallest 95 % confidence interval.
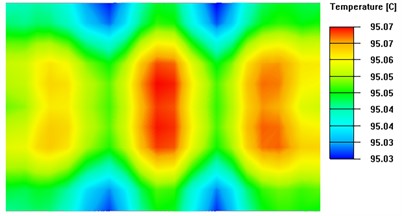
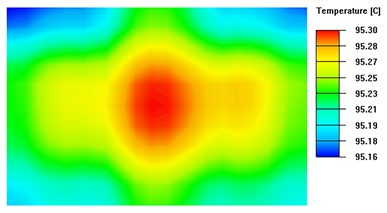
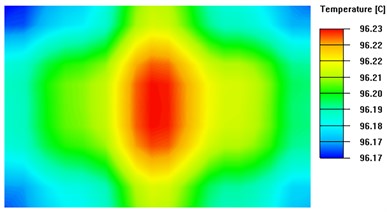
Fig. 8 presents the isothermal surfaces with significant differences between the four sets of experiments. When the TEC spacing is too small, heat accumulates, hindering even heat distribution. Conversely, if the TEC layout spacing is too large, although heat diffuses better, it concentrates more around the TECs, resulting in lower temperatures in other areas. However, if there are gaps between the TEC modules, the surface area of the heat sink increases, which reduces the heat build-up effect.
Fig. 8Isothermal surface on the upper surface of the thermal conductivity plate with different TEC spacing
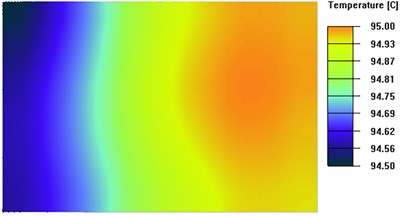
a) TEC spacing d is 0mm
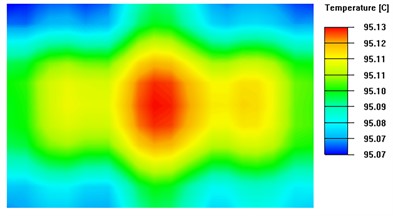
b) TEC spacing d is 2mm
c) TEC spacing d is 3mm
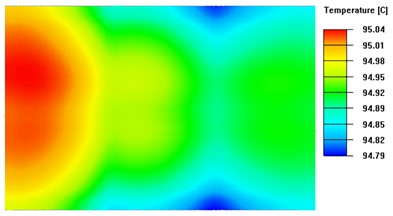
d) TEC spacing d is 4mm
2.4. Heat conduction plate thickness
The flat-plate digital PCR model places the heat-conducting plate directly below the microfluidic device, with both in close proximity. The size of the heat-conducting plate is 124 mm × 82 mm × mm, where {0.5, 1, 1.5, ..., 7.5}, 1/10 Length, 1/10 Width. As a result, the heat-conducting plate can be treated as a one-dimensional flat wall, and its thermal conductivity differential equation is provided:
Eq. (12) shows that the one-dimensional flat wall temperature is inversely proportional to the thickness of the heat-conducting plate. In practical engineering, it is important to consider thermal conductivity efficiency, so the heat-conducting plate should not be too thick. Therefore, for this experiment, 8.2 mm is selected.
In the actual project, the thermal conductive plate will wrap around the insulation material to reduce edge heat loss. However, some heat loss will still occur. The heat-conducting plate is made of 6061-T4 aluminum alloy, and its specific physical properties are shown in Table 1. This paper utilizes ANSYS Icepak software to conduct simulation experiments on the heat transfer plate thickness. The third type of boundary conditions is set to simulate different thicknesses of the heat transfer plate and to determine the optimal thickness range for achieving thermal uniformity.
For this experiment, we chose the data sampling method described in subsection 2.2. We sampled 96 points and calculated the standard deviation for each group of sampling points. We then performed segmented linear fitting of the standard deviation, as shown in Fig. 9. When the thickness of the heat-conducting plate exceeds 1.5 mm, the rate of change of the standard deviation is approximately 0.006. At this level, the dispersion of the sampling points of the temperature on the upper surface of the heat-conducting plate is small enough.
Fig. 9Analysis of the heat-conducting plate thickness and its impact on heat conductivity uniformity
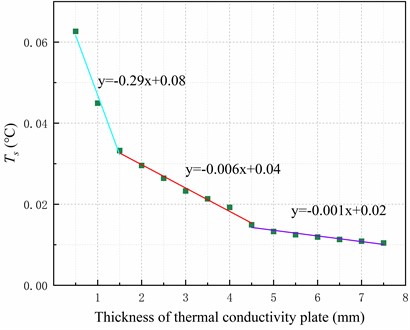
a) The temperature standard deviation of sampling points
b) The 95 % confidence interval of sampling points
Based on Fig. 10, the isothermal surface extreme is 0.06 °C when the thickness of the heat-conducting surface is 4.5 mm, and 0.05 °C when the thickness is 7 mm. Based on Fig. 9 , it can be concluded that when the thickness of the heat-conducting plate exceeds 4.5 mm, there is no significant improvement in temperature uniformity as the rate of change of the linear fit to the standard deviation of the temperature is only 0.001. Therefore, this experiment concludes that the optimal thickness of the heat-conducting plate for the system ranges from 3.5mm to 4.5mm.
Fig. 10Isothermal surface on the upper surface of the thermal conductivity plate with different thickness
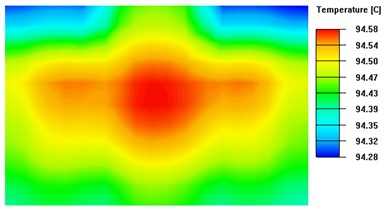
a) Thickness of heat-conducting plate is 0.5 mm
b) Thickness of heat-conducting plate is 2 mm
c) Thickness of heat-conducting plate is 4.5 mm
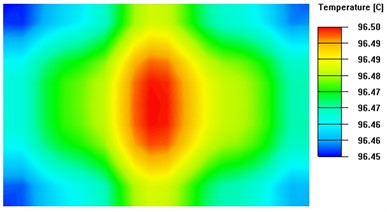
d) Thickness of heat-conducting plate is 7 mm
3. Experimental verification
The experimental verification of forced air cooling, TEC spacing, and heat-conducting plate thickness was conducted. The surface temperature of the heat-conducting plate was sampled using a commercial version of a tight-fitting digital PCR temperature calibrator.
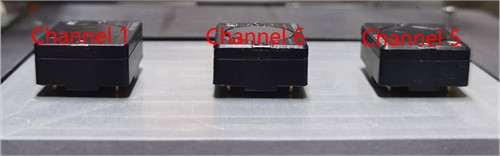
Three sampling sensors, namely #1, #5, and #6, were randomly selected and zero-calibrated. Fig. 11 depicts the placement of the temperature calibrator, where Channel 1, Channel 5, and Channel 6 correspond to sensors #1, #5, and #6, respectively. The same pressure is applied above the sensors during temperature measurement, and thermally conductive silica gel is placed under the sensor probes to reduce thermal resistance. The digital PCR temperature calibrator was set to a sampling interval of 200 ms. The same digital PCR temperature cycle was used during the test, and data was sampled from 60 s to 100 s of temperature rise, resulting in a total of 603 sampling points.
Fig. 11Location of the dPCR temperature calibrator presented in a schematic diagram
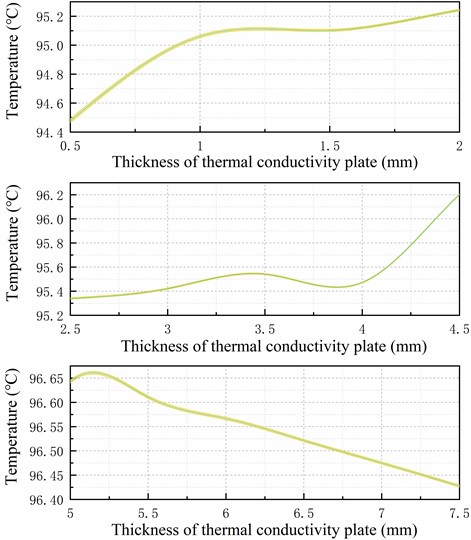
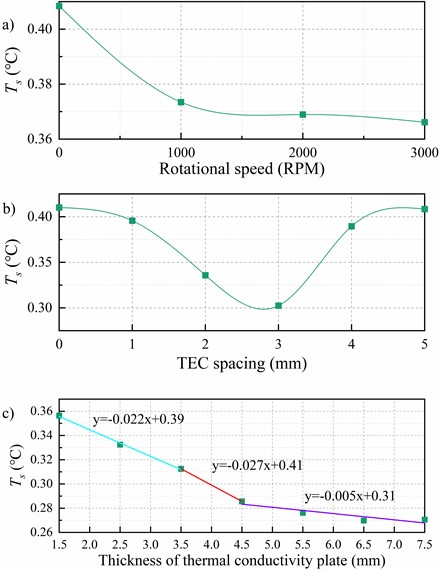
The code was used to set different PWM duty cycles to adjust the fan rotation speed. The standard deviation of the temperature at the sampling points was analyzed, as shown in Fig. 12(a). The experimental results indicate that the standard deviation of the temperature on the top surface of the heat-conducting plate is approximately 8.6 % lower when the fan rotation speed is around 1000 RPM compared to when the fan is not turned on. At a fan speed of approximately 3000 RPM, the temperature deviation on the top surface of the heat-conducting plate decreases by approximately 10.3 % compared to when the fan is not in use. The experimental results are consistent with the simulation results in subsection 2.2, indicating the reliability of the simulation results. Fig. 12(b) displays the analyzed graph of the experimental verification of TEC spacing and temperature uniformity of the heat-conducting plate. The image indicates that the standard deviation of the temperature on the top surface of the heat-conducting plate is smaller when the TEC spacing is between 2.5 mm and 3.5 mm. This result is consistent with the simulation results in subsection 2.3, indicating their reliability. Fig. 12(c) displays the analysis diagram for the experimental verification of the heat-conducting plate's thickness and temperature uniformity. The graph illustrates that when the thickness of the heat-conducting plate exceeds 4.5 mm, the temperature standard deviation of the top surface increases by approximately 0.005. However, the thickness of the heat-conducting plate does not significantly affect its uniformity. Therefore, for optimal heat transfer efficiency, a thickness of 3.5 mm-4.5 mm is recommended. This range aligns with the reliable results obtained from the simulations in subsection 2.4. To maintain consistency with the simulation results, it is deemed reliable.
Fig. 12Experimental validation analysis diagram
4. Conclusions
This paper proposes using Ansys Icepak to simulate the effect of the digital PCR structure on the temperature uniformity of its heat conduction plate. The optimal digital PCR structure with detailed parameter ranges was predicted through simulation. The experimental verification of the effects of forced air cooling, TEC spacing, and heat-conducting plate thickness on the temperature uniformity of the heat-conducting plate is presented. The experimental results are compared with the simulation results, and they are found to be consistent, thus verifying the superiority of the proposed method in this paper.
References
-
A. Manz, N. Graber, and H. M. Widmer, “Miniaturized total chemical analysis systems: A novel concept for chemical sensing,” Sensors and Actuators B: Chemical, Vol. 1, No. 1-6, pp. 244–248, Jan. 1990, https://doi.org/10.1016/0925-4005(90)80209-i
-
B. Vogelstein and K. W. Kinzler, “Digital PCR,” Proceedings of the National Academy of Sciences, Vol. 96, No. 16, pp. 9236–9241, Aug. 1999, https://doi.org/10.1073/pnas.96.16.9236
-
F. Diehl, M. Li, Y. He, K. W. Kinzler, B. Vogelstein, and D. Dressman, “BEAMing: single-molecule PCR on microparticles in water-in-oil emulsions,” Nature Methods, Vol. 3, No. 7, pp. 551–559, Jul. 2006, https://doi.org/10.1038/nmeth898
-
Y.-Q. Li, G.-J. Tan, and Y.-Q. Zhou, “Digital PCR and its applications in noninvasive prenatal testing,” Briefings in Functional Genomics, Vol. 21, No. 5, pp. 376–386, Sep. 2022, https://doi.org/10.1093/bfgp/elac024
-
L. Zhang, R. Parvin, Q. Fan, and F. Ye, “Emerging digital PCR technology in precision medicine,” Biosensors and Bioelectronics, Vol. 211, p. 114344, Sep. 2022, https://doi.org/10.1016/j.bios.2022.114344
-
D. Xu, W. Zhang, H. Li, N. Li, and J.-M. Lin, “Advances in droplet digital polymerase chain reaction on microfluidic chips,” Lab on a Chip, Vol. 23, No. 5, pp. 1258–1278, Mar. 2023, https://doi.org/10.1039/d2lc00814a
-
I. Merino, A. de La Fuente, M. Domínguez-Gil, J. M. Eiros, A. P. Tedim, and J. F. Bermejo-Martín, “Digital PCR applications for the diagnosis and management of infection in critical care medicine,” Critical Care, Vol. 26, No. 1, pp. 1–10, Mar. 2022, https://doi.org/10.1186/s13054-022-03948-8
-
A. Tiwari et al., “Application of digital PCR for public health-related water quality monitoring,” Science of The Total Environment, Vol. 837, p. 155663, Sep. 2022, https://doi.org/10.1016/j.scitotenv.2022.155663
-
C. Liu and J. Feng, “Calculation and simulation of temperature control in real time PCR instrument,” (in Chinese), Chinese Journal of Biomedical Engineering, Vol. 26, pp. 195–198, 2007.
-
Y. Yao, Z. Chen, J. Huang, and J. Liu, “Modeling and Analysis of Thermal Cycle System for Quantitative PCR Instrument,” (in Chinese), China Mechanical Engineering, Vol. 22, No. 1, pp. 31–34, Jan. 2011.
-
J. Pang et al., “Study on the spatial continuous-flow PCR based on single-temperature controlling module,” (in Chinese), Analytical Laboratory, Vol. 41, pp. 1317–1321, 2022.
-
M. Gaňová et al., “Temperature non-uniformity detection on dPCR chips and temperature sensor calibration,” RSC Advances, Vol. 12, No. 4, pp. 2375–2382, Jan. 2022, https://doi.org/10.1039/d1ra08138a
-
F. Talebi, H. Ghafoorifard, S. Ghafouri-Fard, and A. Jahanshahi, “A straight-forward, inexpensive, low power continuous-flow µPCR chip using PCB-based heater electrodes with uniform temperature distribution,” Sensors and Actuators A: Physical, Vol. 333, p. 113220, Jan. 2022, https://doi.org/10.1016/j.sna.2021.113220
-
J. Li et al., “A preclinical system prototype for focused microwave breast hyperthermia guided by compressive thermoacoustic tomography,” IEEE Transactions on Biomedical Engineering, Vol. 68, No. 7, pp. 2289–2300, Jul. 2021, https://doi.org/10.1109/tbme.2021.3059869
-
C. Chua, S. L. Sing, and C. K. Chua, “Characterisation of in-situ alloyed titanium-tantalum lattice structures by laser powder bed fusion using finite element analysis,” Virtual and Physical Prototyping, Vol. 18, No. 1, Dec. 2023, https://doi.org/10.1080/17452759.2022.2138463
-
Y. Nie, Q. Tang, M. Zhao, and J. Song, “Effect of heat treatment on mechanical properties, failure modes and energy absorption characteristics of lattice skeleton and sheet structures fabricated by SLM,” Journal of Materials Research and Technology, Vol. 26, pp. 4925–4941, Sep. 2023, https://doi.org/10.1016/j.jmrt.2023.08.264
-
Y. Pan, K. Zhang, M. Hu, Y. Zhao, and X. Xu, “FEA based opto-mechanisms design and thermal analysis of a dynamic SFS with an ultra-long exit pupil distance,” Optics and Laser Technology, Vol. 161, p. 109148, Jun. 2023, https://doi.org/10.1016/j.optlastec.2023.109148
-
X. Qin, Q. Shi, F. Shi, Y. Li, and Song, “The impact of a thick-doping-layer on the charge collection efficiency in the P-type silicon substrate of EBCMOS devices,” Journal of Nanoelectronics and Optoelectronics, Vol. 18, No. 8, pp. 938–945, Aug. 2023, https://doi.org/10.1166/jno.2023.3475
-
M. A. Naghsh et al., “An innovative model for predicting the displacement and rotation of column-tree moment connection under fire,” Frontiers of Structural and Civil Engineering, Vol. 15, No. 1, pp. 194–212, Mar. 2021, https://doi.org/10.1007/s11709-020-0688-2
-
A. Shishegaran, M. Moradi, M. A. Naghsh, B. Karami, and A. Shishegaran, “Prediction of the load-carrying capacity of reinforced concrete connections under post-earthquake fire,” Journal of Zhejiang University-SCIENCE A, Vol. 22, No. 6, pp. 441–466, Jun. 2021, https://doi.org/10.1631/jzus.a2000268
-
B. Karami, A. Shishegaran, H. Taghavizade, and T. Rabczuk, “Presenting innovative ensemble model for prediction of the load carrying capacity of composite castellated steel beam under fire,” Structures, Vol. 33, pp. 4031–4052, Oct. 2021, https://doi.org/10.1016/j.istruc.2021.07.005
-
M. Fitouri, Y. Bensalem, and M. N. Abdelkrim, “Analysis and co-simulation of permanent magnet sychronous motor with short-circuit fault by finite element method,” in 2016 13th International Multi-Conference on Systems, Signals and Devices (SSD), pp. 472–477, Mar. 2016, https://doi.org/10.1109/ssd.2016.7473721
-
H. Wang et al., “Modulating cation migration and deposition with xylitol additive and oriented reconstruction of hydrogen bonds for stable zinc anodes,” Angewandte Chemie International Edition, Vol. 62, No. 10, Feb. 2023, https://doi.org/10.1002/anie.202218872
-
Y. Wang and Y. Zhang, “ANSYS Icepak Advanced Application Navigation Case,” Beijing: House of Electronics Industry, 2016.
About this article

The study was supported by “the 2021 Jilin Provincial Science and Technology Department Key R&D Project” (Grant No. 20210201031GX). The study has received research support from LUSTER LightTech Co.
The datasets generated during and/or analyzed during the current study are available from the corresponding author on reasonable request.
Qixuan Li: data curation, formal analysis, investigation, methodology, software, validation, writing – original draft, writing – review and editing. Xulei Qin: Project administration, funding acquisition, supervision, writing – review and editing. Haoyu Wang: conceptualization, investigation, project administration, resources, supervision, writing – review and editing.
The authors declare that they have no conflict of interest.
