Abstract
The paper focus on showing using statistical analysis the relevance of vibration, temperature, and humidity on a crimped connection between a copper wire and copper terminal. As a primary metric it was used, as baseline, the behavior of the resistivity of a crimped assembly after vibration, humidity, and temperature tests in order to analyze and conclude if there is a significant relation between all these environmental factors and the crimped height. The core activity of this experiment consists in the analysis performed on 50 crimped assemblies where the main dimensional characteristics were achieved using a specific crimping normative, followed by a sequence of environmental testing steps, in order to obtain a significant number of data points that enable us to create a proper statistical model to analyze and conclude the influence of vibration (one of the main environmental factors tracked) over the crimped assembly.
1. Introduction
In the actual economic context of automotive industry and current transition from combustion engine to electric engines, manufacturing of wiring harnesses is having the biggest transformation requirements to quickly adapt the classic ways of production process to the new type of requirements given by the electric engine expansion. In this new created environment, the wire crimping process requirements are changing on a much faster pace as before which consequently drives a higher degree of validation tests to prove the reliability of crimped connection. The challenge is to synchronize high resource requirements of those validation test (labor, cost and time) with the time constraints of wiring harness design release that is a major factor in determining the overall release of a new generation vehicle.
Vibration is currently one of the most important tests [1] used in the automotive industry and more specific the one focusing on the design and manufacturing of the engines. Every O.E.M (Original Equipment Manufacturer) were issuing a wide range of specification to determine the behavior of the engines over the life span of an assembly [2]. As a result, all the components’ suppliers were adopting these specifications to secure the reliability of the final product.
The study objective was to determine the behavior of a crimp joint assembly [3] between terminal Micro timer 114-18081 and cable FLRY 0,5-A during validation test and by utilizing statistical analyze [4], to determine the relevance of each performed test by monitoring the resistance measured during these trials [5]. This study was focusing in showing if the vibration of an assembly will in fact influence the crimp joint and if so, what will be the degree of this influence in comparison with other environmental factors.
2. Experiment criteria and data collection plan
2.1. Crimp height and pull test measurements
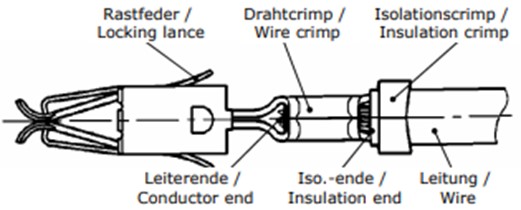
As described in Fig. 1, the main element of a crimped assembly process is the “Wire crimp” which is also our focus point in this experiment.
Fig. 1Crimp joint between terminal and cable
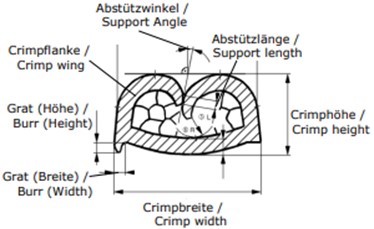
To enable a proper statistical analysis to be performed 50 crimped samples were chosen, all in accordance with the terminal specification [3]. including the microsection analysis for compliance (Fig 2). As primary output all the samples were dimensional measured and recorded and the pull test value (using Mecmesin AFG 1000N) and crimp height “CH” were recorded (Fig.3 ).
Fig. 2Crimp microsection
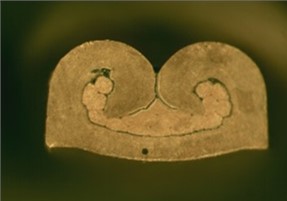
Fig. 3Terminal crimp dimensions
2.2. Initial resistance measurements
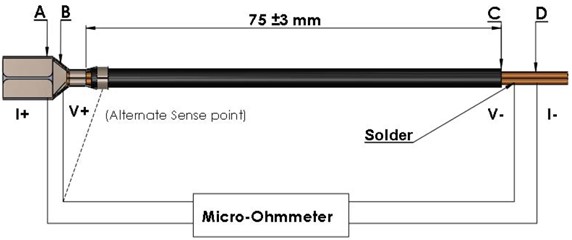
According to the current standards, applicable in the automotive industry all the 50 samples were prepared to enable an accurate initial resistance measurement to be performed during the validation tests (Fig. 4), [5].
Fig. 4Dry circuit measurement points
2.3. Thermal Shock measurements
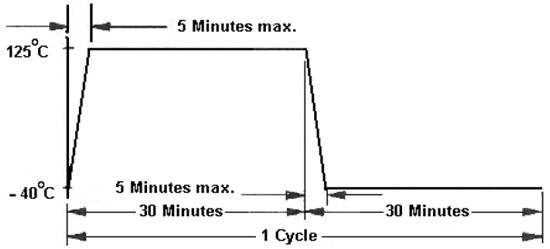
In the third step of the experiment the batch of 50 samples were tested and resistance measured under a thermal shock cycle (Fig. 5), [5].
Fig. 5Thermal shock cycle
2.4. Humidity cycle conditioning and vibration measurements
In this test the resistance of the crimped join was measured during humidity cycle conditioning, (Fig. 6), [6] combined with a vibration bed (Fig. 7), [2], [7] using 10 to 55 Hz at +/- 0.75 amplitude, 50 to 500 Hz at 100 m/s2 acceleration for a total of 16 hours in each of the three direction with the aim of observing any variation of the resistance during the applied procedure.
Fig. 6Humidity Cycle Conditioning [5]
![Humidity Cycle Conditioning [5]](https://static-01.extrica.com/articles/23681/23681-img6.jpg)
Fig. 7Vibration test mounting bed [8]
![Vibration test mounting bed [8]](https://static-01.extrica.com/articles/23681/23681-img7.jpg)
3. Results and statistical analysis
The full range of the 50 samples measurements were recorded in a data collection plan (Table 1), that was used as an input in the next phase of the experiment related to the statistical analyses of the recorded data using Minitab Software [4], as processing tool:
The base of this study was to determine if during the life cycle of a crimped joint the main characteristic which is the crimp height together with the connected characteristic as pull test values and resistance values performed after pre validation test have a relationship between them, if these variables are influencing each other and if they do what is the degree of interdependency.
In this perspective we started to use the multiple regression tool [4] and plotted all the data point to understand if first we have a clean regression model and observing (Fig.8) we came back to the data collection plan to understand the reasons behind the data points that were identify by the model as large residuals or unusual data that could have a strong influence on the model.
The second step in our multiple regression analysis we try to determine if all the characteristics will have a statistically significant relation, if the percentage of the variation of the output “Y” will be explained by the regression model and if any of the “X” variables are not part of the model so consequently not relevant.
Table 1Example from data collection plan
Crimp Height Nominal (mm) | Pull test Nominal (N) | Initial resistance R(mΩ) | Resistance after T/S R(mΩ) | Resistance after T/S/H R(mΩ) |
1.181 | 116.52 | 0.105 | 0.205 | –0.033 |
1.189 | 113.28 | 0.155 | 0.009 | –0.038 |
1.189 | 112.13 | 0.121 | 0.022 | –0.051 |
1.189 | 117.25 | 0.135 | 0.046 | –0.029 |
1.187 | 108.99 | 0.158 | 0.033 | –0.029 |
1.179 | 114.57 | 0.118 | 0.039 | –0.036 |
1.184 | 109.78 | 0.134 | 0.079 | –0.041 |
Fig. 8Multiple regression diagnostic report
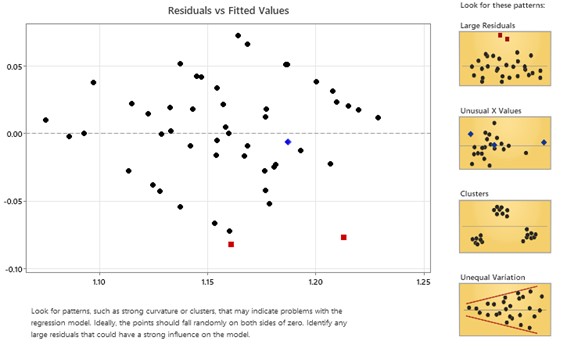
Fig. 9Multiple regression summary report
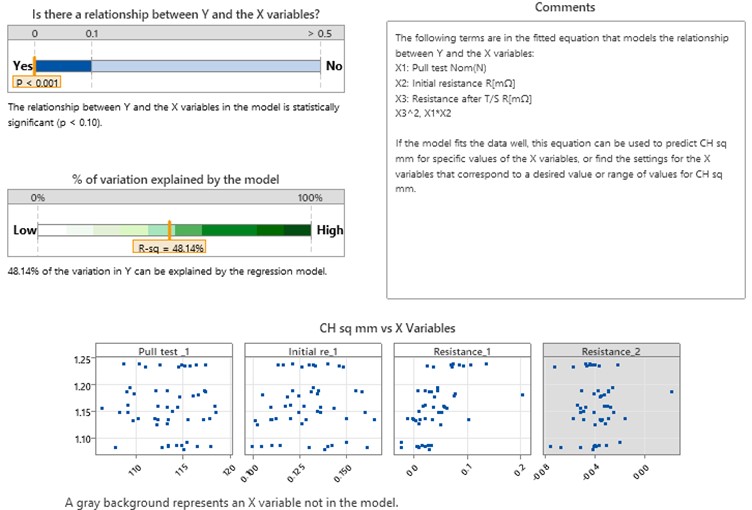
In (Fig. 9), upper corner left, after plotting all the recorded data points due to the fact that P value is below 0.10, we can observe that the relation between the variables plotted in the model is statistically significant and that 48.14 % of the output variation in our case crimp height (CH) can be explained by the regression model. The R-sq value of 48.14 % shows that for a higher confidence in our model the sample size should be increased so the current study conclusions should be reconfirmed after an additional experiment involving at least 125 samples that will bring the confidence level of our regression model to a value above 85 %-90 %.
In (Fig. 9), we can also observe when plotting the crimp height (CH) versus each “X” variables that “Resistance_2” in our case the resistance after humidity cycles and vibration is having no influence.
The last step in our statistical analysis using multiple regression was to observe which variable have the strongest relation and if there are in our model inputs that do not explain additional variation of the out. In charts below (Fig. 10), we can observe that the Resistance after humidity cycles and vibration cycles have no influence and no contribution to the statistical model which lead to the obvious conclusion that the last performed test of Humidity Cycle Conditioning and Vibration will not impact in any way the variation of the Crimp Height (CH).
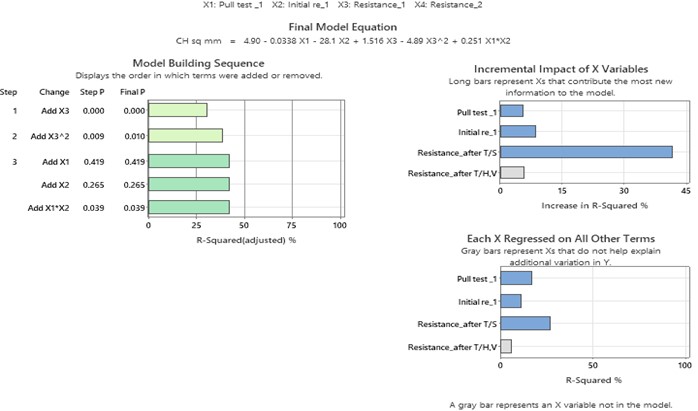
Fig. 10. Multiple regression model building report
4. Conclusions
The sample size used to be large enough (50) the normality was not an issued and by obtaining the P-value lower than 0.001 we could accurately say that there is significant relationship between the data points. Having this concluded we can further go and conclude that for a crimp joint between a terminal and a copper stranded wire FLRY 0.50 A in the pre validation test that most important ones that could have a significant impact are Pull Test and Thermal Shock cycles and that the Vibration and Humidity though very important for a full engine test design validation in case of wiring harnesses and specific in crimped joints will not have a statistical significance and so no relevance for the integrity and functionality of the crimped joint.
References
-
Gilbert-Rainer Gillich and Zoltan Korka, “The Relations between Deflection, Stored Energy and Natural Frequencies, with Application in Damage Detection,” Romanian Journal of Acoustics and Vibration, Vol. 13, No. 2, pp. 87–93, 2016.
-
G.-R. Gillich, Z. I. Praisach, V. Iancu, H. Furdui, and I. Negru, “Natural Frequency Changes due to Severe Corrosion in Metallic Structures,” (in Romanian), Strojniški vestnik – Journal of Mechanical Engineering, Vol. 61, No. 12, pp. 721–730, Dec. 2015, https://doi.org/10.5545/sv-jme.2015.2674
-
“Application specification 114-18081, Micro Timer 2+3,” 11.10.2021 REV.M, 2021.
-
M. R. Delozier and S. Orlich, “Discovering influential cases in linear regression with MINITAB,” Statistical Methodology, Vol. 2, No. 2, pp. 71–81, Jul. 2005, https://doi.org/10.1016/j.stamet.2004.11.005
-
“Performance specification for cable-to-terminal electrical crimps,” SAE/Uscar-21 Revision 3, 2002.
-
L. B. Veldscholte and S. de Beer, “OpenHumidistat: Humidity-controlled experiments for everyone,” HardwareX, Vol. 11, p. e00288, Apr. 2022, https://doi.org/10.1016/j.ohx.2022.e00288
-
K. Krüger, H. Yuan, and J. Song, “The influence of the vibration test mode on the failure rate of electrical connectors,” Microelectronics Reliability, Vol. 135, p. 114567, Aug. 2022, https://doi.org/10.1016/j.microrel.2022.114567
-
“Quality requirements and testing STD 7611,151,” Volvo Corporate Standards, 2013.
Cited by
About this article

The authors have not disclosed any funding.
The datasets generated during and/or analyzed during the current study are available from the corresponding author on reasonable request.
The authors declare that they have no conflict of interest.
