Abstract
Ultrasonic welding parameters originally provided by the components supplier caused negative pull/peel tension results. In this paper, we present a method to find the optimal parameters for the ultrasonic welding of copper elements. These elements represent components inside an electrical harness from automotive industry: coper plate and copper wire strands. The design of experiments (DoE) was used as a method within the Six Sigma approach. We succeeded in obtaining welding parameters that ensure successfully passing the pull/peel tension test.
Highlights
- Optimized ultrasonic welding parameters for copper elements
- Utilized design of experiments within Six Sigma methodology
- Achieved successful pull/peel tension test results
- Application in automotive electrical harness components
1. Introduction
Ultrasonic welding (USW) is a process of bonding metallic (or even plastic) elements by using high-frequency ultrasonic vibrations. It is a solid-state procedure mostly used in manufacturing to create electrical connections between non-ferrous metals like copper or aluminum [1]. Widely used in the automotive industry [2], [3], the USW has recently been proven as a good alternative to the classical crimping technology, especially in the increased demand related to the development of electric vehicles [4]-[8].
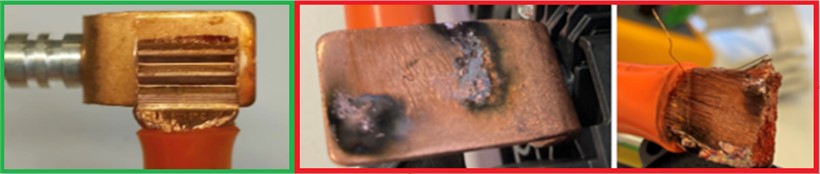
We focused on obtaining correct ultrasonic welds of copper plate with copper wire strands (Fig. 1, in green), as opposed to those showed in red, which represent defects that frequently occur in this type of weld joint.
Fig. 1Proper welding (green) of copper plate with copper lead strands versus defective welding (red)
We operated a decrease of the control limit from 5000 ms to 4500 ms (welding time) after the alignment with the original equipment manufacturer.
Energy dispersive X-ray spectroscopy (EDX) analysis was performed on the failed parts and the results were positive: no deviation on the terminal/wire surface.
2. Methods
2.1. Design of experiments (DoE) - statistical analysis using Minitab software
Design of Experiments (DoE) is a practical and organized way for engineers to understand how different factors influence key outcomes. It is widely used in the manufacturing world and the automotive industry, within the Six Sigma approach, using software such as Minitab [9], [10].
Six Sigma is a data-driven methodology and philosophy used in the automotive industry to improve processes, reduce defects, enhance quality, and increase overall efficiency [11], [12]. It uses two process capability indices to measure process specifications (see Table 1).
The Sigma level is calculated by multiplying the Process Capability Index (Cpk) value with 3.
Table 1Process capability index in relation to part per million (PPM)
Cpk | Sigma level | PPM |
0.33 | 1 | 691462 |
0.67 | 2 | 308537 |
1 | 3 | 66807 |
1.33 | 4 | 6214 |
1.67 | 5 | 233 |
2 | 6 | 3.4 |
2.2. DoE Roadmap - determination of proper parameters for ultrasonic welding
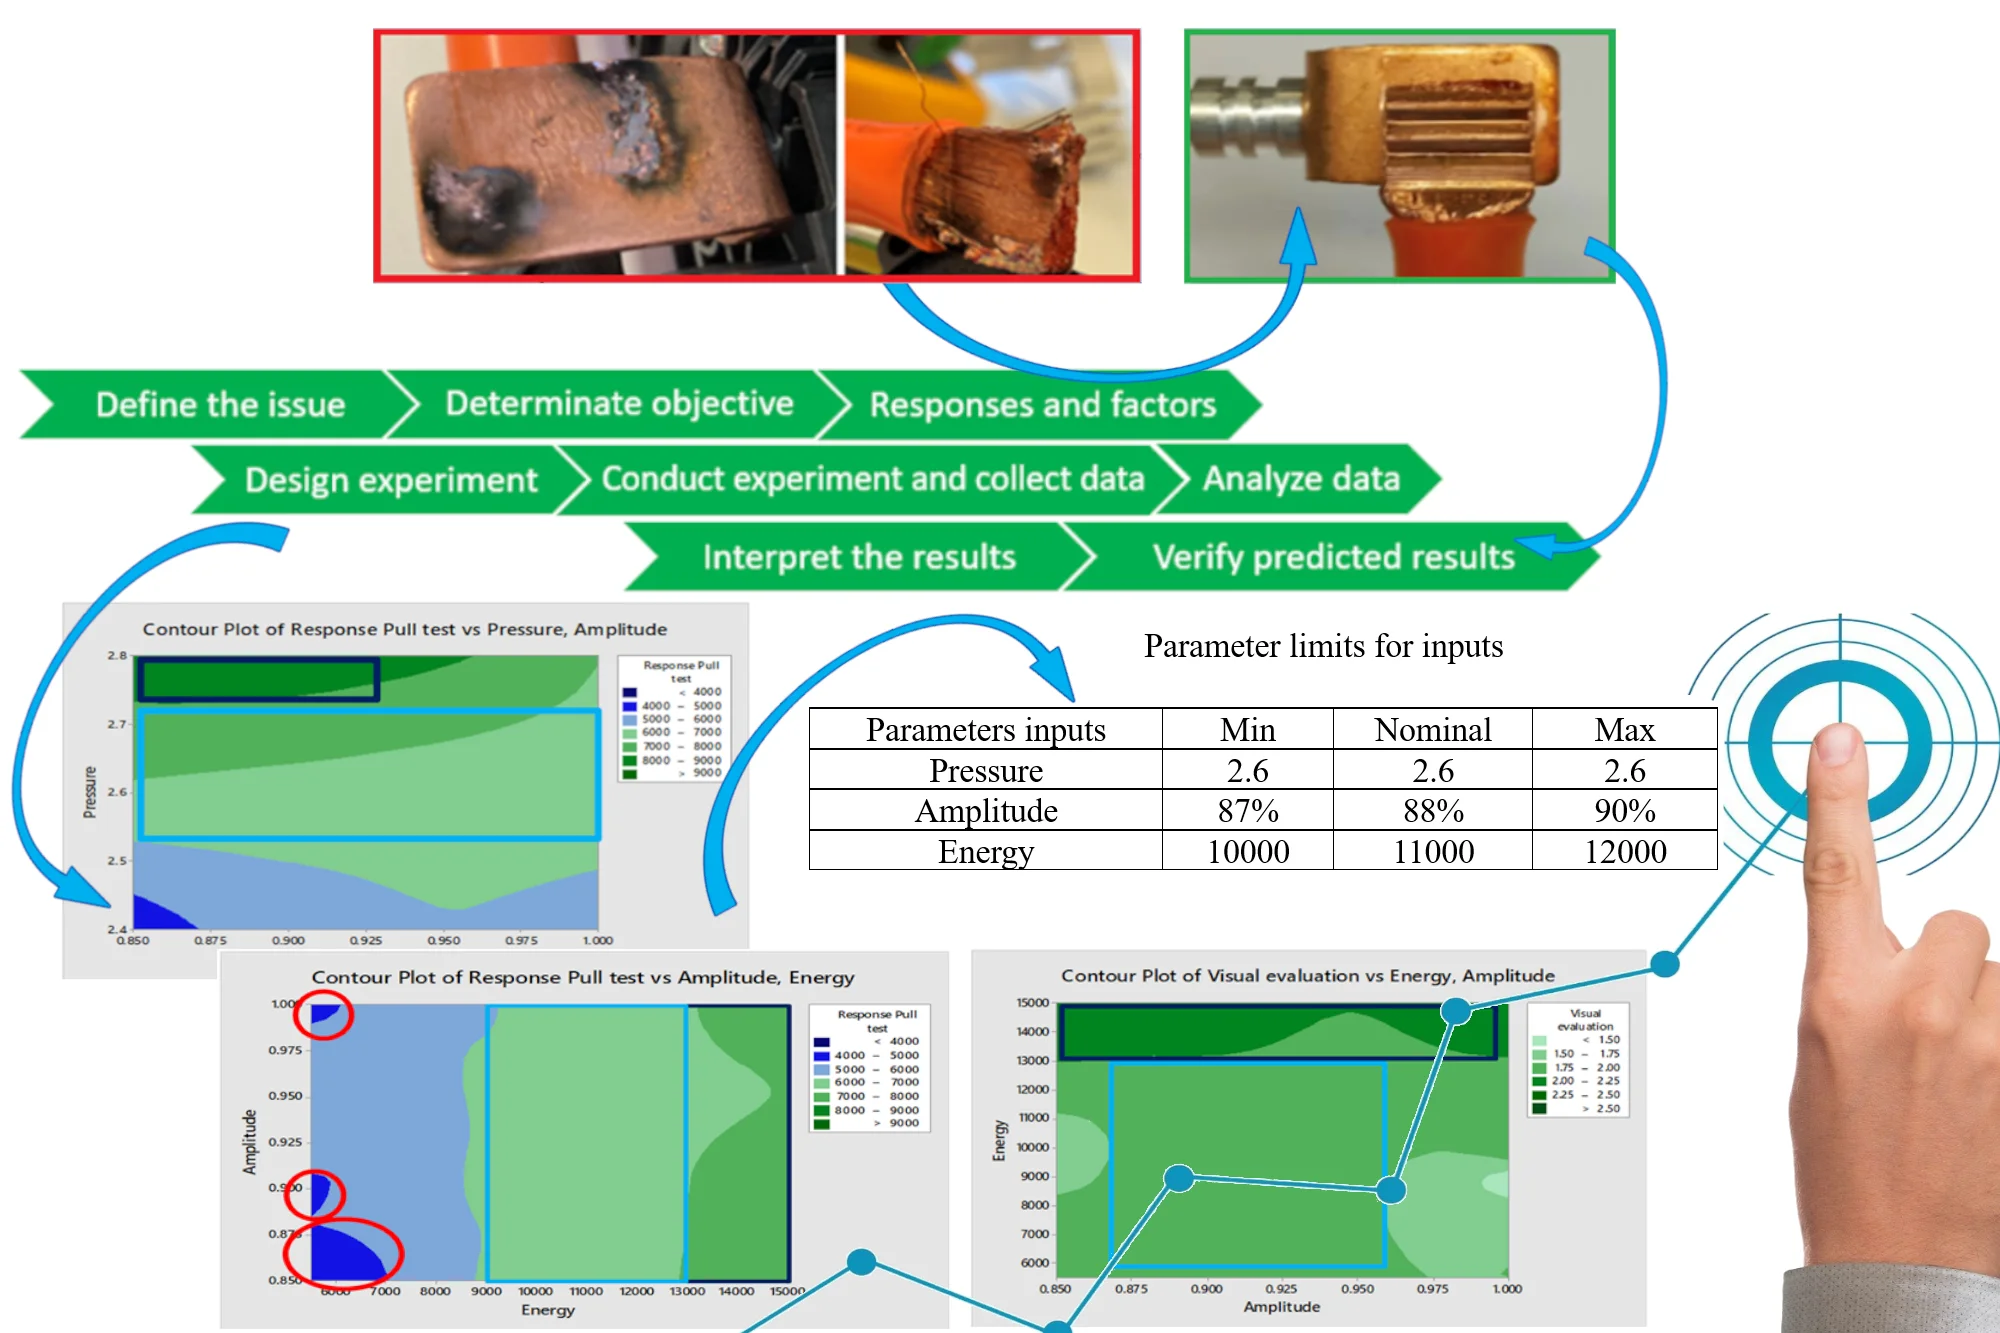
After choosing the method, we have clarified the eight steps that are part of the process and defined the actions needed for each of them, tailored toward our specific needs. This resulted in a roadmap that guided us throughout the experiments.
Schematically, the DoE method can be represented in Fig. 2.
Fig. 2Design of experiments method

3. Experiments and results
The test results and the validation data are explained, followed by a discussion regarding the optimal parameters.
3.1. Conduct the experiment
To conduct the experiment, we used a TT7 welding machine from Telsonic.
The schematic below (Fig. 3) illustrates the basic principles of the welding process. As the sonotrode moves back and forth, termed the amplitude, the part being welded also moves over the lower part, which is being clamped rigidly in the anvil. The resultant welds provide very good electrical conductivity and strong welds with no structural changes in the parent material.
For the actual testing, we used fifteen sets of materials, each consisting of ten wire-to-copper-plate pairs (as seen in Fig. 4). The specimens used in this work are cleaned thoroughly using isopropyl to remove surface oxides and other impurities [13].
Based on the literature survey [14]-[16], the predominant process variables such as clamping pressure, amplitude of vibration of the sonotrode, weld time, and weld specimen part dimensions are considered for experimentation. In our experiment, we determined three parameters have the most influence on the quality of the weld: pressure, amplitude, and energy. Various values were considered according to the established design of the experiment (see Table 2).
Fig. 3The welding process diagram
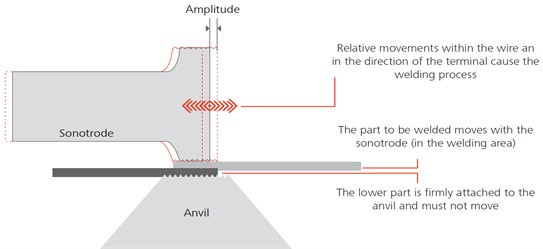
Fig. 4Example of material sets used in the experiment
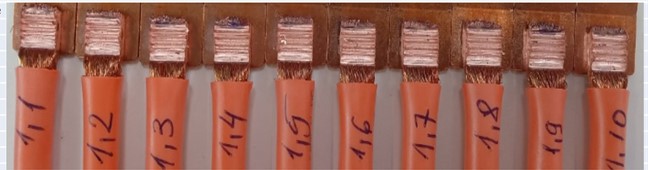
Table 2Variables used for testing
Input parameters | |||
Pressure | Amplitude | Energy | Level |
2,40 bar | 85 % | 5,500 W/s | Low |
2.60 bar | 90 % | 10,000 W/s | Medium |
2.80 bar | 100 % | 15,000 W/s | High |
The resulting welds were evaluated visually and measured for welding height, welding time, absolute welding distance and differentiated welding distance.
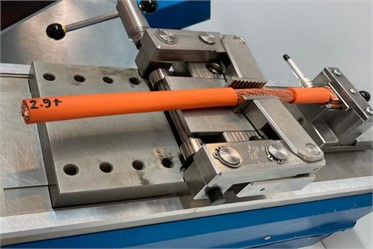
Destructive tests were performed to determine the strength of the weld. Pull force testing (see Fig. 5) in ultrasonic welding is a method of measuring the strength of a weld by applying a pulling force to the joint. Peel tests are conducted by peeling one side of the sheet metal away from the other, often using a roller.
Fig. 5Example of pull test equipment
3.2. Data acquisition
The resulted dataset was collected and introduced in Minitab, then analyzed using DoE. We observed the best input parameters for the optimal welding process, but also working values for the input parameters that can be successfully used considering efficiency as a value-added element in the decisions making process. This means that we have interpreted the results considering not only the value levels at which the resulted weld is the closest to perfection, but also the value levels that will yield a good result, using less resources in terms of energy consumption.
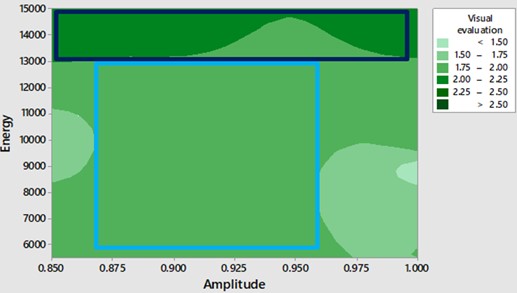
Minitab can create Contour plots with the response variable on the -axis and the two control variables on the - and -axes, used to identify optimal values of the predictor variables for a given response variable [15].
In Fig. 6. we can observe the best values for energy are situated between 13000 and 15000 W/s, but that values between 5500 and 13000 W/s could also be used with good results (light blue contour).
Fig. 6Contour plot of visual evaluation vs. energy and amplitude
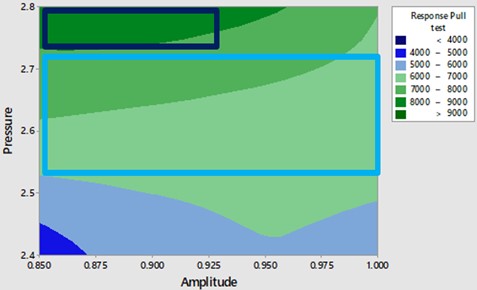
Consequently, in Fig. 7 we observe that the best values for pressure are situated between 2.73 and 2.8, with an amplitude of 85 % to 93 %, while we will still get good results by using pressure between 2.55 to 2.73 if the amplitude is preserved:
Fig. 7Contour plot of pull test vs. pressure and amplitude
However, in Fig. 8 we can observe a case in which if the energy is dropped to values between 5500-6100 W/s or below the result is a bad welding.
In this case, the optimal energy level would be between 13000-15000 W/s, with working values situated at 9000-13000 W/s.
4. Results
We were able to provide the best working parameters that can be used for a good ultrasonic weld. The predicted results were validated by calculating the new CmK. We have established the parameters limits as the highest value and the lowest value (Table 3) at which we can obtain a proper ultrasonic weld (Table 4).
Fig. 8Contour Plot of Pull test vs. Amplitude and Energy
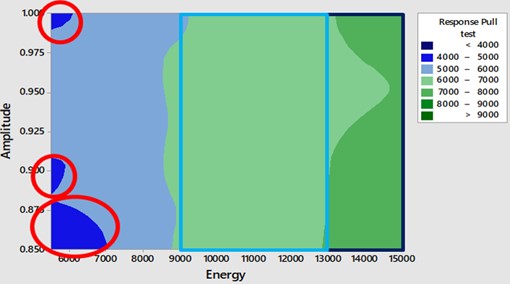
Table 3Parameter limits for inputs
Parameters inputs | Min | Nominal | Max |
Pressure | 2.6 | 2.6 | 2.6 |
Amplitude | 87 % | 88 % | 90 % |
Energy | 10000 | 11000 | 12000 |
Table 4Resulting outputs
Parameters outputs | Lower standard limit (LSL) | Upper standard limit (USL) | Parameters outputs |
Pull force | 4200 | N/A | Pull force |
Weld distance | 1.9 | >30 | Weld distance |
Weld time | 3400 | 4000 | Weld time |
5. Conclusions
The final decision to use the determined optimal working input parameters was taken as a result of concrete experimental results, statistically analyzed, and not based on assumptions.
By conducting experiments and using the DoE method provided by the Minitab program, we were able to determine the most optimal input parameters to obtain a weld of cable (FHLR2GCB2G and with 50 mm2 / 0.21 T180 0.6/1.0 kV) with Copper plate (5 mm thickness)
Thus, the resulting optimal range (minimum-maximum) satisfies both the client's needs regarding the quality and reliability of the finished product, as well as the internal requirements for the efficiency and effectiveness of the use of resources.
References
-
T. Kuprys and J. Janutėnienė, “Strength of copper wire connections welded by ultrasonic,” Mechanika, Vol. 3, No. 65, 2007.
-
B. Zhou, M. D. Thouless, and S. M. Ward, “Predicting the failure of ultrasonic spot welds by pull-out from sheet metal,” International Journal of Solids and Structures, Vol. 43, No. 25-26, pp. 7482–7500, Dec. 2006, https://doi.org/10.1016/j.ijsolstr.2006.03.009
-
V. Neag, A. Sirbu, L. Kun, and L. Udrescu, “Experimental research on ultrasonic joining of metallic materials used in the automotive industry,” Welding and Material Testing, Vol. 2, pp. 8–11, 2015.
-
I. Balz et al., “Process monitoring of ultrasonic metal welding of battery tabs using external sensor data,” Journal of Advanced Joining Processes, Vol. 1, p. 100005, Mar. 2020, https://doi.org/10.1016/j.jajp.2020.100005
-
F. W. Müller, C. Mirz, S. Weil, A. Schiebahn, B. Corves, and U. Reisgen, “Weld quality characterization by vibration analysis for ultrasonic metal welding processes,” Journal of Advanced Joining Processes, Vol. 8, p. 100149, Nov. 2023, https://doi.org/10.1016/j.jajp.2023.100149
-
M. F. R. Zwicker, M. Moghadam, W. Zhang, and C. V. Nielsen, “Automotive battery pack manufacturing – a review of battery to tab joining,” Journal of Advanced Joining Processes, Vol. 1, p. 100017, Mar. 2020, https://doi.org/10.1016/j.jajp.2020.100017
-
B. Das et al., “Comparison of tab-to-busbar ultrasonic joints for electric vehicle li-ion battery applications,” World Electric Vehicle Journal, Vol. 10, No. 3, p. 55, Sep. 2019, https://doi.org/10.3390/wevj10030055
-
F. Ye, Y. Wang, H. Lu, and Y. Guo, “Study on the bonding mechanism of multilayer copper with nickel sheet in ultrasonic welding process,” Materials Research Express, Vol. 9, No. 2, p. 026527, Feb. 2022, https://doi.org/10.1088/2053-1591/ac57db
-
A. Kumar, K. Singh, K. Singh, K. Thakur, H. Singh, and J. Singh, “Product performance optimization in an automotive manufacturing plant using shainin DOE tools: A case study,” Materials Today: Proceedings, Vol. 50, pp. 1679–1682, 2022, https://doi.org/10.1016/j.matpr.2021.09.150
-
R. Chandrasekaran, R. D. S. G. Campilho, and F. J. G. Silva, “Reduction of scrap percentage of cast parts by optimizing the process parameters,” Procedia Manufacturing, Vol. 38, pp. 1050–1057, 2019, https://doi.org/10.1016/j.promfg.2020.01.191
-
A. Mittal, P. Gupta, V. Kumar, A. Al Owad, S. Mahlawat, and S. Singh, “The performance improvement analysis using six sigma DMAIC methodology: a case study on indian manufacturing company,” Heliyon, Vol. 9, No. 3, p. e14625, Mar. 2023, https://doi.org/10.1016/j.heliyon.2023.e14625
-
R. Titmarsh, F. Assad, and R. Harrison, “Contributions of lean six sigma to sustainable manufacturing requirements: an Industry 4.0 perspective,” Procedia CIRP, Vol. 90, pp. 589–593, 2020, https://doi.org/10.1016/j.procir.2020.02.044
-
G. R. Gillich, Z. I. Praisach, V. Iancu, H. Furdui, and I. Negru, “Natural frequency changes due to severe corrosion in metallic structures,” Strojniški Vestnik – Journal of Mechanical Engineering, Vol. 61, No. 12, pp. 721–730, 2015.
-
K. Faes, R. Nunes, S. de Meester, W. de Waele, F. Rubino, and P. Carlone, “Influence of the process parameters on the properties of Cu-Cu ultrasonic welds,” Journal of Manufacturing and Materials Processing, Vol. 7, No. 1, p. 19, Jan. 2023, https://doi.org/10.3390/jmmp7010019
-
R. Nunes, K. Faes, S. de Meester, W. de Waele, and A. Kubit, “Influence of welding parameters and surface preparation on thin copper-copper sheets welded by ultrasonic welding process,” The International Journal of Advanced Manufacturing Technology, Vol. 123, No. 1-2, pp. 373–388, Nov. 2022, https://doi.org/10.1007/s00170-022-10164-9
-
M. H. Amini-Chelak, R. Miresmaeili, M. Askari-Paykani, H. Aliyari, and H. R. Shahverdi, “Resistance spot weldability of Fe66Cr16.5Ni14.1Si3.4 advanced high strength steel using D-optimal design of experiment method,” Journal of Materials Research and Technology, Vol. 25, pp. 5615–5632, Jul. 2023, https://doi.org/10.1016/j.jmrt.2023.06.262
About this article

The authors have not disclosed any funding.
The datasets generated during and/or analyzed during the current study are available from the corresponding author on reasonable request.
The authors declare that they have no conflict of interest.
