Abstract
Strong motion records with acceleration spikes have occurred frequently in recent major earthquakes, acceleration spikes contribute to the peak ground accelerations (PGAs) and the amplitudes are significantly higher than the predicted values based on present attenuation relation. The generation mechanism of acceleration spikes is revealed based on long-term monitoring after the 2008 Mw 8.0 Wenchuan earthquake. The horizontal accelerogram with obvious spikes from the Mw 9.0 Tohoku-Oki earthquake is reproduced by using numerical simulation, and it’s found that the dilatancy cyclic mobility (DCM) mechanism can explain the generation of acceleration spikes. The support vector machine (SVM) is used to efficiently identify DCM sites. We found that the spatial distribution of DCM sites is parallel to the earthquake source fault and the corresponding PGAs of ground motions recorded in DCM sites differ significantly from those recorded in non-dilatancy cyclic mobility (NDCM) sites.
1. Introduction
Ground motion records, which are the direct result of massive earthquakes and offer important insight into the ground motion features, are fundamental study data for seismology and earthquake engineering [1]. Since earthquake hazard assessment studies have been used to look into nonlinear soil reactions and geological disasters like sand liquefaction and tsunamis, in addition to the causes of structural damage in strong earthquakes, an understanding of the mechanism underlying acceleration spikes in ground motion is beneficial [2-5]. Due to developments in strong motion observation technology, seismologists and engineers are becoming increasingly concerned about the collection of strong motion records, particularly the PGA greater than 1 g [6-7]. These anomalous records with acceleration spikes are extremely valuable for investigating near-surface nonlinear behavior to better understand the soil response and the process of anomalous acceleration spike generation, as well as to minimize damage from devastating earthquakes.
Since the 2008 Mw 8.0 Wenchuan earthquake, which also happened during the 2011 Mw 9.0 Tohoku-Oki earthquake and the 2021 Mw 7.1 Fukushima earthquake, we have been monitoring this occurrence. Fig. 1 displays accelerograms for the most recent big earthquakes that clearly exhibit peaks. The following traits of the acceleration spikes, which contribute to the PGA, are as follows: the acceleration increases quickly to a peak value and lasts for a predetermined amount of time; also, the PGA values are significantly bigger than their counterparts predicted using the attenuation relationship.
2. The NOAH program and mechanism of acceleration spikes
The horizontal NS component observed accelerogram and the simulation result based on the DCM model are shown in Fig. 2(a) to (c). The accumulation pattern of excess pore water pressure in the higher sand layer is depicted in Figs. 2(d) to (f), mostly occurring in two time-sections. However, it is evident that the excess pore water pressure abruptly drops at the moment when the acceleration spikes appear. Additionally, the phase transformation line is repeatedly crossed by the stress route, indicating that the soil begins to dilate and the stress-strain loop produces significant strains up to 1 %.
Fig. 1Ground motion time histories with acceleration spikes: a) the NS component accelerogram at Wolong station in the 2008 Wenchuan earthquake, b) the NS component accelerogram at Qingping station in the 2008 Wenchuan earthquake, c) the NS component accelerogram at MYG004 station in the 2011 Tohoku-Oki earthquake, d) the EW component accelerogram at TCGH16 station in the 2011 Tohoku-Oki earthquake
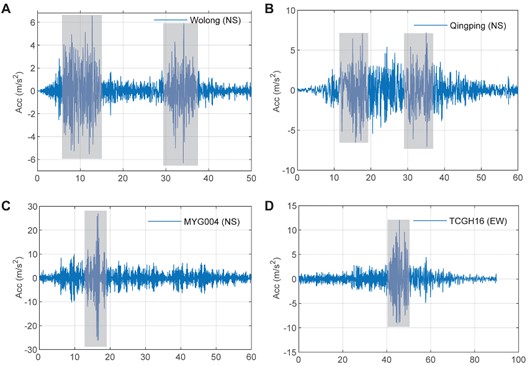
Fig. 2Station MYGH04 simulation results during the March 11, 2011 Mw9.0 Tohoku-Oki earthquake: a) the horizontal NS component observed accelerogram and simulation result based on DCM model during the Tohoku-Oki earthquake, b)-c) enlarged views of sec1 and sec2 in A, d) the simulated time-history curve of pore water pressure at 2m underground depth, e) the simulated time-history curve of stress-path pressure at 2 m underground depth, f) the simulated time-history curve of strain-stress at 2 m underground depth
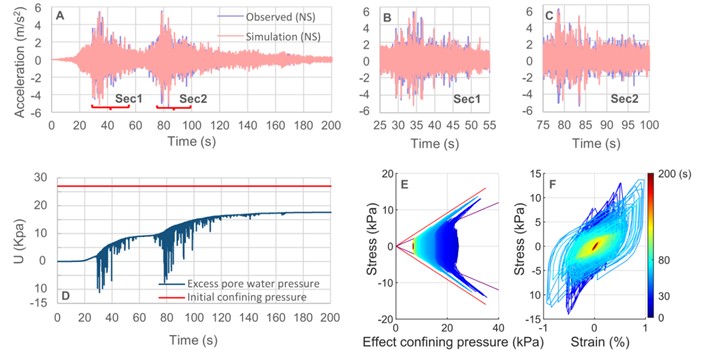
Dilatancy cycle mobility behavior causes a downward spike in the excess pore water pressure curve, according to the undrained stress path coupling relationship between excess pore water pressure and soil dilatancy in the cyclic plastic strain model. Spike shear stresses, which are observed as dilatancy pulses on the ground, follow the huge strains [8-9], huge and sharp shear stresses produce huge acceleration spikes, as per the shear wave motion equation. Under undrained cyclic shear action, the skeleton grains of sand will experience a linked cyclic shear dilatancy process at the micro level. More pore space is produced through dilatancy, which raises the soil's volume. Pour water seeps into the additional pore space, increasing effective average stress, decreasing pore water pressure, and stiffening the soil, all of which slow down the deformation process. Comparable modeling findings of the significant motion reported at station MYGH04 for the Mw7.3 earthquake on March 16, 2022, are displayed in Fig. 3.
Fig. 3Station MYGH04 simulation results during the March 16, 2022 Mw7.3 earthquake: a) the NS accelerogram component at station MYGH04 during the March 16, 2022 Mw7.3 earthquake, b) the simulated time-history curve of stress-path pressure at 2 m underground depth, c) the simulated time-history curve of strain-stress at 2 m underground depth
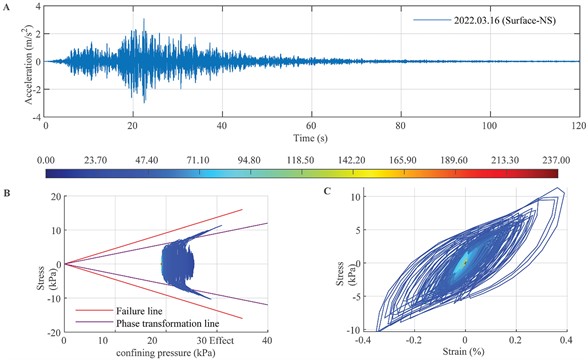
Fig. 4Spike filtering and NDCM model: a) the NS horizontal acceleration component after filtering out spikes, b) the simulation result of the NS horizontal acceleration component using NDCM model
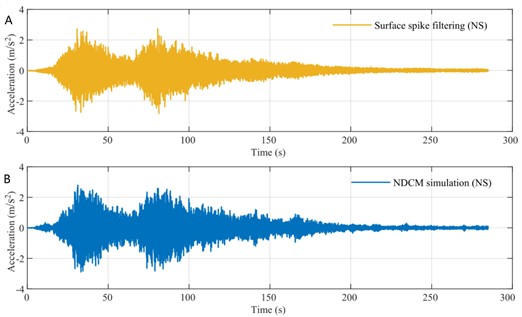
We use Figs. 4(a) to (b) for comparison, which demonstrate that while the NDCM model simulation result is unable to replicate the acceleration spikes, the NDCM acceleration envelope resembles the DCM model accelerogram’s envelope following the spike removal. Without taking dilatancy into account, it is evident that there is no spike and that the acceleration time history curve is essentially unchanged. This indicates that the filtering approach is also capable of removing the spike's influence.
2.1. DCM site identification based on SVM classification
After a catastrophic earthquake, there are a lot of recordings available. It can be challenging to determine by visual inspection – which is ineffective and prone to subjectivity – whether a record has acceleration spikes or whether a site shows DCM. Consequently, in order to differentiate between DCM and NDCM records, we use SVM classification. There are 3156 acceleration records at 1052 stations (each station has two horizontal and one vertical acceleration record); records with three PGA components of less than 0.1 m/s2 are eliminated. A total sample of 1008 (504 group) horizontal acceleration recordings has been selected for statistical analysis and identification. The feature vectors are four classification indices. The first classification index is the site category. sandy soils with medium-dense and loose sand, and dense sand, exhibit soil dilatancy. To quickly determine which recorded sites are affected by DCM, it is appropriate to use the site category as the initial index of identification. The second classification index is the surface PGA's threshold value. After a certain range of borehole input acceleration, the ground acceleration takes on the shape of a spike; the acceleration spikes become more visible, and the influence of DCM sand becomes greater.
As a result of this, we can determine whether a site is in the DCM state by looking for the ground PGA threshold that results in the generation of an acceleration spike. The third and fourth indices are the envelope and PGA differences, respectively, before and after filtering. The ground acceleration curve is filtered using the phase space reconstruction filtering method. At each station, the difference between the PGA before and after filtering the spike is collected for statistical analysis. The envelope of the NDCM simulated ground acceleration curve is very similar to the envelope of the DCM-simulated filtered spike component. When the spike's amplitude is large, the difference between the before and after filtered PGA values is obvious, whereas the difference between the before and after filtered PGA values without obvious acceleration spikes is very small. Thus, the fourth index can be the difference between the PGA values before and after filtering.
We chose 50 strong earthquake records on the ground that are visibly influenced by DCM and 50 horizontal strong earthquake records that are not impacted as the training sample. The accuracy of sample recognition is 89 % for SVM. There were 93 groups of strong earthquakes that were considerably impacted by cyclic mobility generated by dilatancy, including 89 groups in class C sites and 4 groups in class D sites. Sampling verification of SVM recognition results showed that all DCM records contained obvious acceleration spikes, and the other acceleration records had no obvious acceleration spikes.
3. Results and discussions
In Fig. 5, the solid black pentagram represents the epicenter of the Tohoku-Oki Earthquake. Solid black line with arrows shows the magnitude of the horizontal permanent displacement. The blue solid circle is the DCM site identified by SVM method, the red solid circle is the NDCM site, and the yellow solid circle is the simulation site, the yellow line of dashes and solid line show the earthquake source fault model (rectangular fault model) of the Tohoku-Oki earthquake.
And the Fig. 5 shows the spatial location distribution map reveals that DCM records show evident directionality, and their distribution positions and trends are closely parallel to the fault. In addition, DCM sites are largely focused on the side parallel to the fault within a fault distance of 200 kilometers. Because of the larger PGA, which is parallel to the fault and close to the fault, it is more likely to activate the dilatancy cycle of the sandy soil.
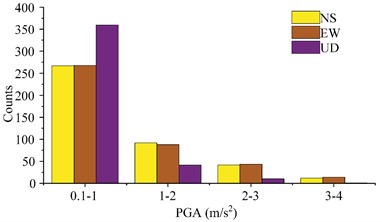
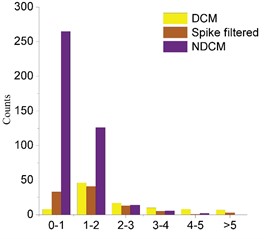
Fig.6(a) shows the horizontal PGA of DCM records is predominantly above 3 m/s2 and there are approximately ten records greater than 1 g. The vertical PGA is predominantly in the range of 1 to 5 m/s2, accounting for 86 % of the total. The number of records with a PGA value greater than 5 m/s2 is significantly less than that in the horizontal direction because dilatancy is more likely to occur in the horizontal direction under the influence of the shear wave. There are 411 records classified as NDCM type. Fig. 6(b) shows the horizontal NDCM PGA is mostly distributed between 0.1 and 3 m/s2, with a few records exceeding 3 m/s2. The vertical PGA is primarily distributed between 0.1 and 1 m/s2, accounting for 88 % of the total PGA. The number of records obtained with PGA greater than 1 m/s2 and less than 4 m/s2 is significantly less than that obtained in the horizontal direction, and the vertical amplification effect is not readily apparent.
Fig. 5Topographic map of northern Honshu Island of the Tohoku-Oki earthquake
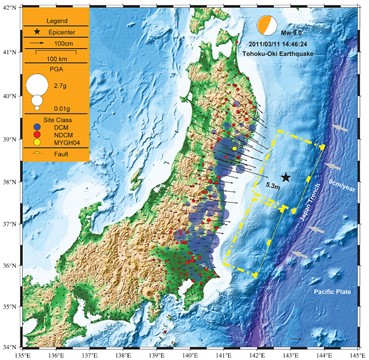
Fig. 6Three-component PGA distribution in DCM and NDCM sites

a)
b)
Fig. 7DCM and NDCM sites’ seismic characteristics
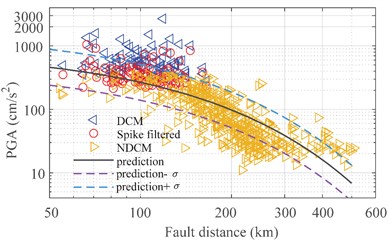
a) We used the SI PGA attenuation law
b) The ratio of three ground motions to attenuation
In Fig. 7(a), the red triangle is the PGA of the DCM site after filtering the spikes. The solid black line is the average line, the light purple dotted line and the blue dotted line are the standard deviation limits. And Fig. 7(a) shows the PGAs of NDCM are roughly the same as predicted values calculated using the attenuation relation proposed by SI [10], while the attenuation curve of PGA recorded by DCM is larger than that of SI, because dilatancy cyclic mobility occurs in DCM records, resulting in abnormally large acceleration spikes. The mean PGA value at the DCM site was 2.7 times that predicted. The largest ratio value of DCM sites is as high as 19 times, which is far beyond the predicted value.
At the NDCM site, Fig. 7(b) shows the mean value of PGA was consistent with the predicted value. It is worth noting that, from the distribution of the two types of records, DCM records have an obvious range limitation. There is no DCM record beyond 200 km, because PGA is not enough to overcome the elastic shear work of the sand layer. Furthermore, the PGA variation is relatively significant within 200 km of the same fault distance. When the elastic shear work threshold of the sand layer at the station is very small and the phase transformation angle is also small, it is quite easy to trigger dilatancy cyclic mobility when the seismic acceleration is large, resulting in large acceleration spikes. As a result, the variation in the characteristics of the sand layer is the cause of the large difference in PGA at the same fault distance.
4. Conclusions
We use the simulation results from station MYGH04 during the Tohoku earthquake to illustrate the generation mechanism, based on decades of tracking research on the phenomenon of acceleration spikes. The simulation results of a constitutive model of sand layer dilatancy and pore water pressure accurately reproduce the horizontal acceleration spikes and response spectrum, demonstrating that the acceleration spikes are caused by the DCM.
The indexes and methods for rapidly identifying records significantly affected by the DCM effect are proposed based on the results of seismic wave propagation simulations and the correlation between the acceleration spikes recorded and the sand dilatancy. As identification objects, 1008 records from the Tohoku earthquake’s networks K-NET and KiK-net were used. The final identification results have an accuracy of up to 89 percent and a high efficiency.
Utilizing NOAH finite element software, modeling necessitates precise geological data regarding the soil layer at the site. This study uses the neighborhood method to find the dilatancy characteristics of the station MYGH04 after a long time, millions of iterations. We found that this procedure requires a significant amount of time and energy. The aim of our subsequent study is to expedite the iteration process by including spectrum analysis at the beginning of each iteration to compare the simulated and actual spectrums.
References
-
S. Midorikawa, H. Miura, and T. Atsumi, “Strong motion records of the 2011 Tohoku earthquake and its attenuation characteristics,” Journal of Disaster Research, Vol. 7, No. 6, pp. 693–700, Dec. 2012, https://doi.org/10.20965/jdr.2012.p0693
-
T. L. Holzer, T. C. Hanks, and T. L. Youd, “Dynamics of liquefaction during the 1987 superstition hills, California, earthquake,” Science, Vol. 244, No. 4900, pp. 56–59, Apr. 1989, https://doi.org/10.1126/science.244.4900.56
-
S.-Y. Wang et al., “Near-surface softening and healing in eastern Honshu associated with the 2011 magnitude-9 Tohoku-Oki earthquake,” Nature Communications, Vol. 12, No. 1, pp. 1–10, Feb. 2021, https://doi.org/10.1038/s41467-021-21418-7
-
F. Santucci de Magistris, G. Lanzano, G. Forte, and G. Fabbrocino, “A peak acceleration threshold for soil liquefaction: lessons learned from the 2012 Emilia earthquake (Italy),” Natural Hazards, Vol. 74, No. 2, pp. 1069–1094, Nov. 2014, https://doi.org/10.1007/s11069-014-1229-x
-
S. Bhattacharya, M. Hyodo, K. Goda, T. Tazoh, and C. A. Taylor, “Liquefaction of soil in the Tokyo Bay area from the 2011 Tohoku (Japan) earthquake,” Soil Dynamics and Earthquake Engineering, Vol. 31, No. 11, pp. 1618–1628, Nov. 2011, https://doi.org/10.1016/j.soildyn.2011.06.006
-
O. V. Pavlenko, “Possible mechanisms for generation of anomalously high PGA during the 2011 Tohoku earthquake,” Pure and Applied Geophysics, Vol. 174, No. 8, pp. 2909–2924, Aug. 2017, https://doi.org/10.1007/s00024-017-1558-2
-
I. A. Beresnev, “Calculation of extreme accelerations in earthquake motion due to ground spalling,” Journal of Seismology, Vol. 25, No. 1, pp. 339–345, Feb. 2021, https://doi.org/10.1007/s10950-020-09980-x
-
M. Zeghal and A.W. Elgamal, “Analysis of site liquefaction using earthquake records,” Journal of Geotechnical Engineering, Vol. 120, No. 6, pp. 996–1017, Jun. 1994, https://doi.org/10.1061/(asce)0733-9410(1994)120:6(996)
-
T. L. Holzer and T. L. Youd, “Liquefaction, ground oscillation, and soil deformation at the wildlife array, California,” Bulletin of the Seismological Society of America, Vol. 97, No. 3, pp. 961–976, Jun. 2007, https://doi.org/10.1785/0120060156
-
D. M. Boore and J. J. Bommer, “Processing of strong-motion accelerograms: needs, options and consequences,” Soil Dynamics and Earthquake Engineering, Vol. 25, No. 2, pp. 93–115, Feb. 2005, https://doi.org/10.1016/j.soildyn.2004.10.007
About this article

The authors have not disclosed any funding.
The datasets generated during and/or analyzed during the current study are available from the corresponding author on reasonable request.
The authors declare that they have no conflict of interest.
