Abstract
Determining the characteristic period of ground motions () is an essential step in the seismic design of structures, but a critical problem that needs to be solved is figuring out how to do so when bedrock ground motion is utilized as an input. In this paper, the relationship between surface and borehole temperature data is investigated, and the main factors affecting the are analyzed. Then, the algorithm for predicting is presented. It is found that two factors, i.e., peak ground acceleration (PGA) and fault distance have significant effects on the value of . By comparing the values of for borehole and surface motions, we find that, contrary to expectation, for borehole motions is usually larger than that for surface motions in most cases. Finally, the conversion equation between the for borehole and surface motions is given using regression analysis.
1. Introduction
The characteristic period of ground motions () can be used to analyze vibration attenuation during seismic wave propagation and investigate the vibration response of building structures, both of which can help in earthquake prediction. Robust seismic observation and engineering practice have proven that there is a difference between the underground and surface characteristic periods. There remains an issue with determining the characteristic time when bedrock ground motion is utilized as the input. To address this issue, this study aims at the distinction between surface and borehole . Section 2 explains the ideas of data collection and selection in database design. In Section 3, the prediction relation is derived through two separate methods of assessing the degree of correlation between the data from different locations and the . We then compare the surface with the borehole .
2. Characteristic period and strong vibration data collection of ground motion response spectrum
2.1. Calculation method of characteristic period
has a significant impact on seismic engineering design, although there are numerous variables that affect and its physical meaning is unclear. There are variations in the computation techniques used in seismic codes across various nations. For China's Code for Seismic Design of Buildings (GB50011-2010), the characteristic period is determined based on the design seismic grouping and site category [1]. Based on the ground classification ascertained by the properties of the soil layer, the European Seismic Code (EC8) establishes the [2]. According to ATC3-06, the effective peak acceleration (EPA) and effective peak velocity (EPV) are the ground motion characteristics that determine the . The is calculated by ATC3-06 specification method:
where EPA is the average spectral value of the absolute acceleration response spectrum in the high frequency band (0.1-0.5 s) when the damping ratio is 5 % divided by 2.5; EPV is the average spectral value of the corresponding velocity response spectrum in the (0.5-2.0 s) segment divided by 2.5.
2.2. Strong motion records
The primary source of data for this research is the KIK-net ground motion database of the Japan Earthquake Network. We select the ground motion records during the 11, March, 2011 Tohoku earthquake for analysis. For this earthquake event, there are more than 1000 ground motions available, but not all of them are trustworthy. In conclusion, it is essential to choose appropriate seismic records based on specific guidelines. The selection of seismic records in this work adheres to the following principles in conjunction with the research goal: Because the seismic records with a smaller PGA have the same amplitude as the noise level and the measurement error of the seismograph, the seismic records with a horizontal PGA less than 5Gal are discarded in this paper.
2.3. Statistical analysis of characteristic period in strong motion records
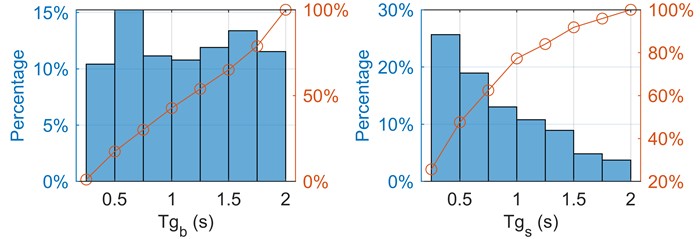
The strong motion records after screening are analyzed statistically. Fig. 1 shows the histogram of the and of the seismic record after screening. As can be seen from the figure, there are a certain number of seismic records in each interval of , and 79 % of the total are between 0.25 and 1.75. 50 % of the ground motion records have a more than 1.25, and 40 % have a between 0.5 and 1.25. About 10 % of ground motions recorded have between 0.25 and 0.5. In the meantime, 60 % of fell between 0.25 and 0.75, and 80 % of were less than 1.25. ’s major distribution interval is bigger than ’s. is bigger than overall.
Fig. 1Distribution of downhole and surface Tg
The correlation coefficient between the surface and the borehole is 0.7249, the confidence interval is 95 %, and the correlation coefficient is between 0 and 1, so it is a positive correlation. Continue to carry out correlation analysis on the logarithm of the two, and the correlation coefficient is 0.7832, which indicates a stronger correlation. Moreover, as fitted in the following figure, we can see that the logarithm correlation is stronger.
3. Prediction relation of characteristic period
3.1. Analysis of influence factors
Numerous variables, such equivalent shear wave velocity, fault distance, PGA, soil depth, and others, might influence Developing a prediction model requires quantifying the degree of connection between each factor and the .
Fig. 2Scatter plot of Tgb and Tgs
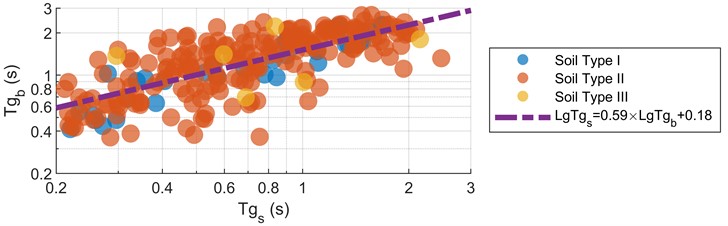
Fig. 3The relationship between influence factors and Tg
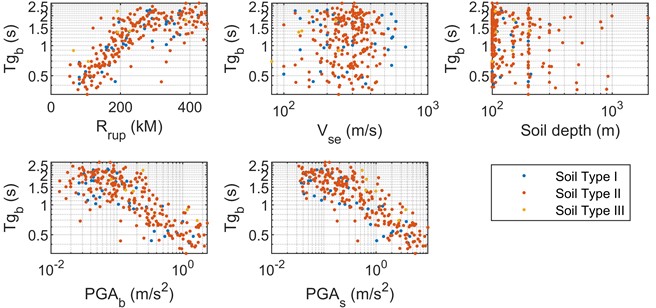
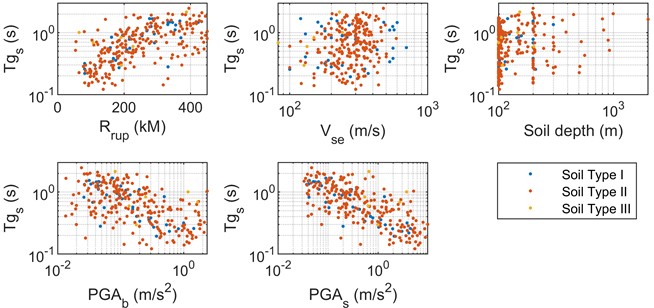
The link between , and different contributing factors is plotted in a scatter plot. It is evident that when fault distance increases, , also tends to increase. But when PGA increased, , had a declining tendency. And in contrast to Fig. 3(b), in Fig. 3(a) was typically higher.
This paper adopts two methods of the investigation and discussion on the importance of the factors affecting the MIC and MRMR, MIC is based on maximal information-based nonparametric exploration (MINE) method, can be used in linear and nonlinear relations. MRMR is based on input and output statistical correlation, and the main function of MRMR algorithm is to ensure the maximum correlation while removing redundant features.
Since its introduction by Reshef et al. [7] in Science in 2011, MIC has found widespread application in data mining and large data analysis related to economics. This study uses an open-source program, minepy-1.2.4 [8], to conduct all the MIC calculations. MIC has two key characteristics, namely generality and equitability, and it can assess the correlation between two quantitative variables well [7]. Given its generality, the MIC is expected to be able to represent a broad spectrum of functional relationships, including superposition, nonlinear, and linear correlations.
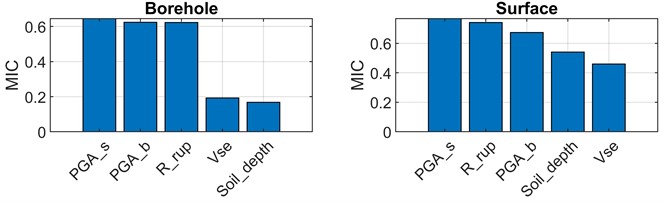
Several parameters have an important effect on the , including the surface PGA (PGA_s), borehole PGA (PGA_b), fault distance (R_rup), equivalent shear wave velocity , soil depth. However, quantitative comparison between these parameters is absent. In view of this, Fig. 4 uses the MIC between the and PGA, R_rup, , and soil depth to determine the most suitable parameter that can be used in the predictive model.
Fig. 4(a) clearly shows that the MIC of and the borehole is the largest among five parameters, demonstrating that PGA_s is the best parameter for developing empirical formulas. Similarly, Fig. 4(b) shows that the MIC of the surface and PGA_s is the largest.
Fig. 4MIC of Tg and different parameters
The use of MRMR algorithm for feature selection is mainly to solve the problem that the best m features obtained by maximizing the correlation between features and target variables will not necessarily obtain the best prediction accuracy. The general evaluation methods of features are basically based on whether the features have a strong correlation with the target variable, but these features may also contain some redundant features. MRMR algorithm is used to ensure the maximum correlation while removing redundant features, equivalent to obtaining a set of “purest” feature subsets (features are very different, and the correlation with the target variable is also very large). MRMR can be considered as an approximation of the dependence between the joint distribution of the maximized feature subset and the target variable.
Fig. 5Predictor importance score of different parameters.
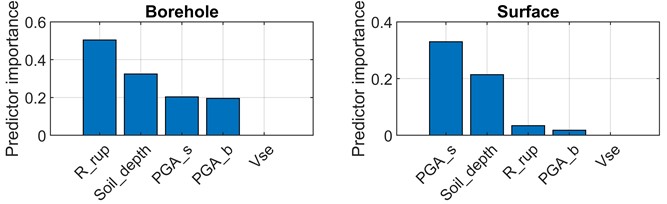
In this work, MRMR is used to sort the degree to which fault distance, soil lay er thickness, PGA, and equivalent shear wave velocity affect . The degree to which each element influences the borehole and the surface are depicted in Fig. 5(a) and Fig. 5(b), respectively.
Fig. 5(a) illustrates that the fault distance has the greatest impact on the of the borehole, while soil depth has a substantial reducing effect and PGA has even less of an impact. Fig. 5(b) illustrates how surface PGA has the greatest influence on the surface , while soil layer thickness has less of an impact. Unlike the time of surface characteristics, the impact of fault distance is significantly weakened.
3.2. Characteristic period prediction formula
According to the above content, it can be seen that the factors that have the greatest influence on the are RGA and fault distance. The is analyzed by regression, and the regression formula and results of the are shown in Table 1:
Table 1The regression parameters of Tg
1.941 | 0.01543 | 147.1 | 0.6817 | –1.156 | 0.5367 | 1.053 | |
0.6728 | 0.02121 | 147.5 | 0.3545 | –0.7261 | 0.3601 | 2.274 |
3.3. Surface – Borehole characteristic period comparison
By comparing the relationship between the of surface and borehole, it can be seen that the of borehole is generally larger than that of surface. The of borehole changes faster with PGA, while the of surface changes faster with fault distance.
Fig. 6The regression results of Tg
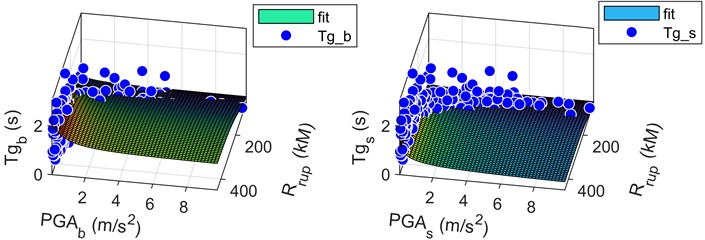
Fig. 7The regression relationship between Tg and fault distance, PGA
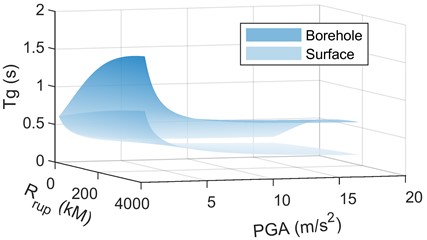
In this work, regression analysis is used to examine the link between the , PGA, and fault distance. Additionally, regression analysis is used to examine the relationship between the surface and borehole . Fig. 7. plots the of the borehole and surface after regressing it with fault distance and PGA. The results indicate that there is a faster change in the borehole with increasing fault distance and PGA.
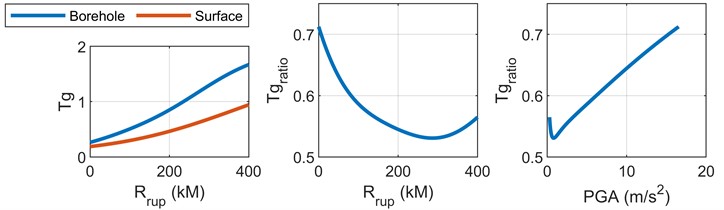
The variation trend of surface and borehole with fault distance is shown by curve, both of them increase with the increase of fault distance, but the increase rate of borehole is greater than that of surface. Then, the variation of ratio with fault distance and the variation trend of ratio with PGA is shown respectively. The ratio generally decreases with the increase of fault distance, but when the fault distance is between 300 km and 400 km, the ratio increases slightly with the increase of fault distance. The ratio generally increases with the increase of PGA, but it also decreases locally when PGA is extremely small.
Fig. 8The variation and ratio of Tg with rupture distance
4. Conclusions
Through rigorous data filtering and careful selection of 311 seismic data, this research creates a dependable database. In order to fully understand the influencing factors of the borehole characteristic cycle and the surface characteristic cycle, as well as the relationships between the two and the site characteristics, a thorough statistical analysis is performed on the database.
The results show that the borehole is greatly affected by fault distance, while the surface is greatly affected by PGA. The importance of the most influential factors of MIC and MRMR methods was used to judge. It can be seen that the of the borehole is larger than that of the surface, and there is a strong positive correlation between them. In addition, the relationship between the , PGA and fault distance is analyzed by regression, and the prediction formula of the is given. By fitting the results of the prediction formula, it can be seen that the borehole changes faster with PGA and fault distance. Finally, the ratio decreases with the increase of fault distance. The ratio generally showed an upward trend with the increase of PGA.
References
-
“MOHURD, Code for seismic design of buildings,” Beijing, China, 2010.
-
“British Standards Institution. Eurocode 8: Design of Structures for Earthquake Resistance,” London, Britain, 2004.
-
“International Building Code,” International Code Council, Washington DC, America, 2006.
-
“FEMA 450.Recommended Provisions for Seismic Regulations for New Buildings and Other Structures,” Washington D C, America, 2003.
-
“CECS. General Rule for Performance-Based Seismic Design of Buildings,” Beijing, China, 2004.
-
“MOHURD, Design Code for Antiseismic of Special Structures,” Beijing, China, 1993.
-
D. N. Reshef et al., “Detecting novel associations in large data sets,” Science, Vol. 334, No. 6062, pp. 1518–1524, Dec. 2011, https://doi.org/10.1126/science.1205438
-
D. Albanese, M. Filosi, R. Visintainer, S. Riccadonna, G. Jurman, and C. Furlanello, “Minerva and minepy: a C engine for the MINE suite and its R, Python and MATLAB wrappers,” Bioinformatics, Vol. 29, No. 3, pp. 407–408, Feb. 2013, https://doi.org/10.1093/bioinformatics/bts707
About this article

The authors have not disclosed any funding.
The datasets generated during and/or analyzed during the current study are available from the corresponding author on reasonable request.
The authors declare that they have no conflict of interest.
