Abstract
Horizontal to vertical spectral ratio (HVSR) based on seismic ground motion is an important index to study site conditions and dynamic characteristics (seismic effect). Due to the influence of the vertical dynamic amplification effect of the site, the Fourier spectral ratio calculated according to the surface motion and downhole motion is quite different from that of the horizontal and vertical ground motion in the case of strong vibration input. However, our recent research shows that when considering the time-varying characteristics of ground motion, the time-varying surface-downhole spectral ratio and time-varying HVSR are almost the same. Based on this discovery, the time-varying HVSR is used to study the dynamic characteristics of the site (site effect). First, a new method for calculating the natural period and damping ratio of the site is proposed. Secondly, based on tremendous strong motion records, the prediction formulas of natural period and damping ratio are studied. Finally, the effects of various influencing factors on the natural period and damping ratio are compared. The results of this paper can provide a basis for selecting and synthesizing appropriate ground motions in structural seismic design.
1. Introduction
The inherent period and damping ratio are not only the inherent properties of the site, but also important factors affecting ground motion, and play an important role in evaluating the earthquake damage of ground structures. Through the comparison of the spectral ratio Fourier calculated from surface motion and downhole motion and the spectral ratio HVSR based on ground horizontal motion and ground vertical motion, it is found that there is a great difference in instantaneous spectral ratio (SR) under the condition of strong motion input, but their time-varying SR is highly consistent when considering the time-varying characteristics of ground motion. Due to the influence of site vertical amplification, there is a large gap between the surface and downhole spectral ratio (SBSR) and HVSR. Real-time HVSR can eliminate the vertical magnification effect of the site. Therefore, in this paper, the time-varying HVSR is used to study the dynamic characteristics of the site, the horizontal and vertical ground motion records are expressed by the time-varying VARMA model, and the Kalman filter is used to estimate the model parameters to obtain the instantaneous frequency and instantaneous damping ratio of the site. Finally, the natural frequency and damping ratio of the site are obtained by weighted average according to the instantaneous power. Based on the analysis of tremendous strong ground motion data, this paper creatively provides a calculation method and corresponding prediction formula for the natural period and damping ratio of the site. We compare the influence of key factors such as magnitude (), epicenter distance () and ground peak acceleration (PGA) by predictor importance score (PIS) and maximal information coefficient (MIC) methods. The results of this paper can provide a basis for seismic structure design and site characteristic analysis, and provide theoretical support for earthquake damage prediction.
2. Determination of site natural period and damping ratio based on time-varying HVSR
The time-varying VARMA model is used to model the two horizontal components of ground motions as the outputs of a time-varying multi-degree-of-freedom (MDOF) system excited by two horizontal components of borehole ground motions, and then the Kalman filter is used to estimate the parameters of the time-varying VARMA model, so as to calculate the instantaneous frequency and instantaneous damping ratio of the site. Then the weighted average is calculated according to the instantaneous power, and then the site natural frequency and damping ratio are obtained.
The time-varying VARMA model is as follows:
Among them, is composed of two horizontal components of ground motions, . consists of two horizontal components of vertical ground motion, that is , coefficients and are both 2×2 matrices. The variable represents the time , and is the sampling interval. The time-varying VARMA model can be estimated by Kalman filtering. Then, the system matrix is constructed:
The instantaneous frequency and instantaneous damping ratio are calculated by eigenvalue decomposition of , as follows:
The instantaneous frequency and damping ratio of the model are calculated according to the instantaneous eigenvalue , where and The instantaneous eigenvalue and the eigenvector are a complex conjugate pair:
where and are weighted and averaged according to the instantaneous power, and the natural frequency and damping ratio of the site are obtained:
where the instantaneous power of the horizontal component, that is ; represents the time , ; and represent the North-South direction and East-West direction at time .
In order to study the strong motion recorded during the Northeast earthquake on March 11, 2011, we select the MYGH04 station which is from the Kiban Kyoshin Network. We find the time-varying acceleration map recorded by MYGH04 station consists of two peaks, which correspond to the two main motion processes of the earthquake. Fig. 1 shows the instantaneous frequency and damping ratio of MYGH04 station site using time-varying HVSR method.
Fig. 1Time-varying graph of isotropic acceleration and comparison between SBSR and HVSR
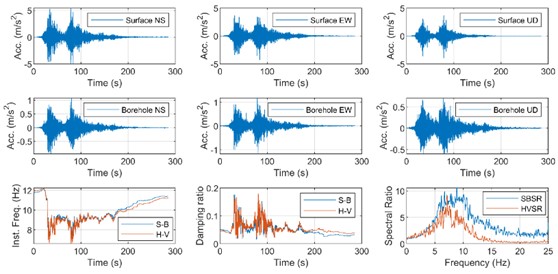
The time-varying SBSR is very close to the time-varying HVSR. While the lower right corner, the difference of HVSR and SBSR is obvious. That shows the time-varying HVSR calculation can eliminate the influence of the site vertical amplification effect. So, the time-varying HVSR is the best choice.
3. Prediction formula of site natural frequency and damping ratio
3.1. Strong motion recording and analysis of influencing factors
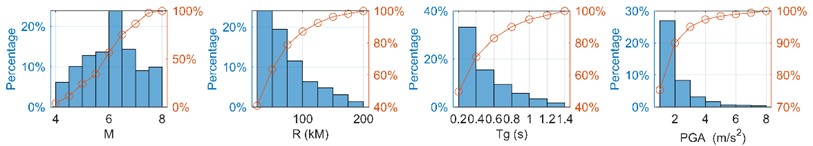
This part of the data is from NGA-West database, and the conclusions are as follows: In this paper, strong motions from the NGA-West2 Database (Ancheta et al., 2014) are used to establish the prediction relation of model parameters of time varying spectrum. The epicenter of this earthquake is mainly between 4 and 8, in which the data of 6 accounting for about 20 %. The earthquake influence shows a negative correlation with the . The influence is mainly concentrated in the area where the is between 50 km and 100 km, accounting for about 84 %. The of the earthquake is mainly distributed between 0.2 and 0.6. In this earthquake, the PGA is mainly concentrated in PGA ≤ 4 m/s2, in which 85 % of the PGA is less than 2 m/s2.
Fig. 2Proportion diagram of different M, R, Tg and PGA
With the increase of , the natural frequency tends to decrease slightly, but it has no great influence on the damping ratio. The increase of has no obvious effect on the natural frequency and damping ratio. There is an obvious negative correlation between the and the natural frequency, and the natural frequency decreases with the increase of the natural period, but has no obvious effect on the damping ratio. There is no obvious correlation between PGA and natural frequency and damping ratio.
When considering the PIS method, it is found that has the greatest influence on the , while , , PGA and other factors have less correlation with the and . When considering the MIC method, it is found that and have a great influence on the natural frequency, while the other factors are less related to the natural frequency and damping ratio.
3.2. Prediction formula of site natural frequency and damping ratio
Based on the conclusion of Section 3.1, following prediction relation of and is adopted:
The corresponding model parameters of and prediction relation are shown in Table 1.
Evaluation and comparison the effects of factors on natural frequency and damping ratio.
The effects of and on and are further investigated. Fig. 5 shows the changes of and with and , in which PGA and are calculated according to the existing prediction formulas:
Fig. 3Scatter diagrams of natural frequencies and damping ratios of M, R, Tgand PGA
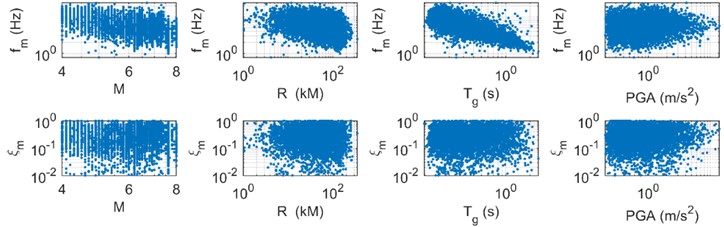
Fig. 4Using PIS and MIC methods to evaluate the contribution of impact factors
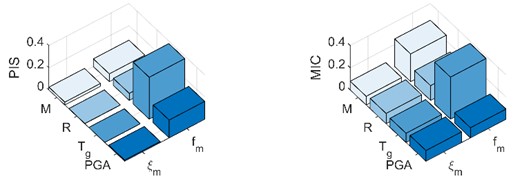
Table 1Prediction relations for fm and ξm parameters
–0.0342 | –0.1611 | 324.8 | 0.738 | –1.48 | 0.0526 | 0.9247 | 0.173 | |
0.0001 | –0.0567 | 51.56 | 422.62 | –99.94 | 0.1051 | –0.5286 | 0.375 |
When the is kept constant, the decreases with the increase of , and the with the increase of . When the remains constant, the decreases with the increase of the , and the decreases with the increase of the , and the change degree is relatively gentle when the is large, and changes violently when the is small.
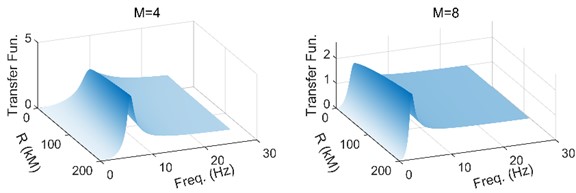
The transfer function of the site can be calculated according to and . We found that when the is constant, the value of the transfer function decreases slightly with the increase of . And the transfer function reaches its peak near 10 Hz. When the is fixed and 4 and it reaches a peak near 5 Hz. when the is fixed and 8. That is to say, the higher is, the lower required by the transfer function is when the epicenter distance is kept at a certain level.
Fig. 5Comparison of the influence of influencing factors on fm and ξm
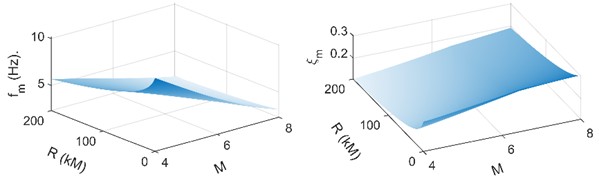
Fig. 6The variation of transfer function with epicenter distance and natural frequency
4. Conclusions
Based on the collation of tremendous Tohoku earthquake data on March 11, 2011, considering the time variation of ground motion, SBSR and HVSR are compared by showing the time-varying map of isotropic acceleration. It is creatively found that the spectral ratio of the two is highly consistent and the time-varying HVSR can eliminate the vertical amplification of the site. Based on the above two points, this paper creatively proposes a method to calculate the natural frequency and damping ratio. The time-varying HVSR model is established and its parameters are estimated by Kalman filter to obtain and . And and are obtained by weighted average according to the instantaneous power. The transfer function of the site can be calculated by and , and the effects of epicenter distance, magnitude and natural frequency on the transfer function are analyzed. At the same time, this paper studies the correlation of , , PGA and to natural frequency and damping ratio, then, based on the contribution degree of influencing factors, the prediction formulas of natural frequency and damping ratio are given.
References
-
R. K. Gupta, M. Agrawal, S. K. Pal, and M. K. Das, “Seismic site characterization and site response study of Nirsa (India),” Natural Hazards, Vol. 108, No. 2, pp. 2033–2057, Sep. 2021, https://doi.org/10.1007/s11069-021-04767-w
-
R. Xu and L. Wang, “The horizontal-to-vertical spectral ratio and its applications,” EURASIP Journal on Advances in Signal Processing, Vol. 2021, No. 1, pp. 1–10, Dec. 2021, https://doi.org/10.1186/s13634-021-00765-z
-
D. Nagamani, K. Sivaram, N. P. Rao, and H. V. S. Satyanarayana, “Ambient noise and earthquake HVSR modelling for site characterization in southern mainland, Gujarat,” Journal of Earth System Science, Vol. 129, No. 1, pp. 1–14, Dec. 2020, https://doi.org/10.1007/s12040-020-01443-8
-
D. Albanese, S. Riccadonna, C. Donati, and P. Franceschi, “A practical tool for maximal information coefficient analysis,” GigaScience, Vol. 7, No. 4, p. 1, Apr. 2018, https://doi.org/10.1093/gigascience/giy032
About this article

The authors have not disclosed any funding.
The datasets generated during and/or analyzed during the current study are available from the corresponding author on reasonable request.
The authors declare that they have no conflict of interest.
