Abstract
Real-time estimates of natural frequencies, mode shapes and damping of a structural system can be interpreted to its structural health. In this regard, real-time estimation of damping ratios for full-scale structures can be useful by itself or in conjunction with real-time estimates of natural frequencies. Such estimates also allow for continuous health monitoring. This paper demonstrates an approach of assessing real-time damping in full scale bridges and demonstrates this on one of the iconic steel bridges in Ireland, the Daly’s “Shaky” bridge. This is the only suspension bridge in the city of Cork, Ireland and renowned in popular culture for its lively behaviour. From existing vibration data evaluated from an image processing technique, the damping estimates of the Daly’s bridge are evaluated based on an automated enhanced frequency domain decomposition (AE-FDD) technique. The method provides accurate estimates of natural frequencies and mode shapes and additionally yields the damping ratio corresponding to each vibration (and/or torsional) mode. This technique of real-time damping estimation can be easily adapted for other full-scale structures in an automated real-time framework.
Highlights
- Real-time estimates of damping ratios
- Demonstration of an automated enhanced frequency domain decomposition technique
- Implementation in an iconic bridge
- Demonstration of image processing for structural health monitoring
1. Introduction
Bridges are aging globally, and limited resources are available for their repair and rehabilitation. This has necessitated a need to explore automated and real-time monitoring techniques for these structures [1-4]. The Structural health monitoring (SHM) market growing rapidly [5] and vibration based SHM is a popular method in this regard. Advances in statistical signal processing techniques, data acquisition methods and intelligent monitoring strategies have prompted a growth in output-based smart sensing – especially for systems embedded with a dense array of wireless sensors [6]. These techniques, developed mostly to identify the changes in the infrastructure system’s inherent properties, rely on basic SHM approaches that involve identification of structural modal parameters [7, 8]. Bridges remains a cornerstone of economic growth and development [9] worldwide, but the cost of replacing and rehabilitating degraded bridges are prohibitive [10], leading to the need for economically sustainable maintenance of bridges and prioritization of available funds for their rehabilitation or rebuilding [11].
Detection of damage or degradation through monitoring if often dependent on the detection of variation of global modal parameters, nonlinearity indices and structural discontinuity, facilitated by the resolution of an inverse problem linking the dynamic responses back to the properties of the system. System-spectral properties, described in terms of modal parameters (natural frequencies, mode shapes and damping ratios), are inherently functions of structural properties (mass, stiffness, and energy dissipation) and their changes are related to damage or degradation. In large civil engineering infrastructure, it is usually impossible to measure all components of input excitation and decisions are required to be taken from output responses alone. Experimental modal identification through ambient vibration response methods has consequently emerged as an attractive alternative [1, 2, 6].
Despite uncertainties and limitations in monitoring a structure through natural frequencies and damping ratios, they remain the most popular and often the most robust technique for SHM. In this regard, significant attention has been directed towards pedestrian-induced vibrations in footbridges [12, 13]. Extraction of modal properties from the user-induced excitations has been reported in recent literature indicative of serviceability conditions, comfort level of users and eventually, the health of the monitored system [14, 15]. The use of a wide range of technologies for full-scale testing of bridges range from traditional (wired) vibration based data acquisition to contemporary methods in fibre optics and video based non-contact tracking – involving geographical positioning system (GPS) [16], laser Doppler vibrometer (LDV) [17] and microwave interferometer. The shift towards wireless sensing technologies brings along the advantages of flexibility and value over wired systems. Coupled with energy harvesting technology, recent research has reported low power data transmission over cloud architecture – with an added advantage of self-powered sensors; thereby making it an attractive choice for monitoring of bridges [18-20]. The demand for a reasonable predictive model for structural damping remains a challenge since the actual damping value of a bridge is difficult to be identified [21, 22]. A real-time implementation of such estimates can also be relevant in the context of SHM [23].
The paper, in this light, investigates a contemporary method of modal identification of output-only systems under repeated loading regime. The technique presented in this paper is an automated real-time extension of the enhanced frequency domain decomposition (EFDD) [24-26], that provides damping estimates of the monitored system in real-time. The automated enhanced frequency domain decomposition (AE-FDD) method evaluates the damping ratio corresponding to each mode against a pre-selected window length. The damping estimates obtained are then compared against established modal parameter estimation method – namely, the time domain decomposition (TDD) technique – applied in an automated real-time framework [27, 28]. The performance comparison of the methods is highlighted through the estimates corresponding to each window.
To demonstrate the use of this approach, an implementation on an iconic pedestrian bridge in Ireland is carried out. Theoretical derivations of the EFDD technique are carried out in this regard and its real-time formulation in an automated framework is presented. The scope of the study is explained in detail next along with the test setup, monitoring method and associated loading. The analysis of the gathered vibration data from the bridge is then explored in detail, where the functioning of the proposed AE-FDD is compared in terms of performance metrics against the traditional TDD approach. The study thus presents this improved real-time framework for damping estimation, which can be implemented in other full-scale bridges.
2. Shaky bridge and previous tests
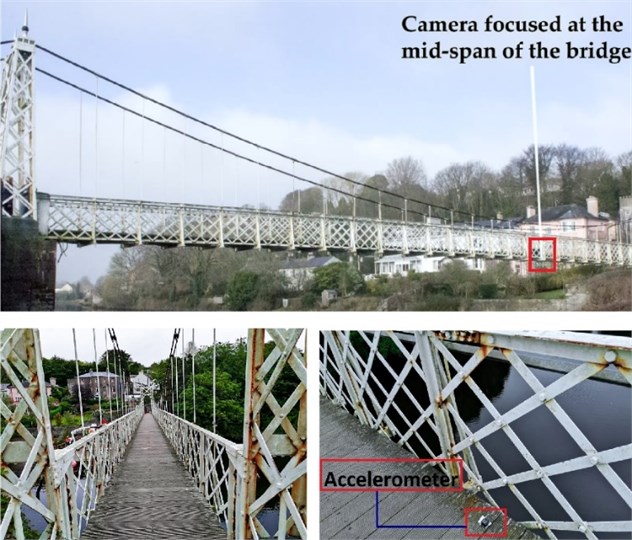
The Daly’s bridge is an iconic steel suspension footbridge in Cork, Ireland, colloquially known as the ‘Shaky’ bridge, for its discernible movement under pedestrian loading. (Fig. 1).
Daly’s Bridge spans the River Lee which joins Sunday's Well on the northside to Fitzgerald’s Park in the Mardyke area on the south [12,13]. This pedestrian – only suspension bridge, constructed mostly out of wrought iron spans 160 feet (48.768 m) and consists of a 4.5 feet (1.371 m) wide timber – planked walkway. A preliminary investigation carried out by O’Byrne et al. [12] presents a video tracking technique to identify the fundamental frequency of the bridge. Excited by pedestrian movements and cyclists traversing the length of the bridge, the video-tracking method consistently obtained similar values of the fundamental frequency – in agreement with the data from the accelerometers placed on the bridge. In a recent extension of this work, O’Donnell et al. focused on the extraction of dynamic measurements due to pedestrian induced excitation on the bridge [13]. Using a video-based imaging system, the authors adopted a wavelet packet decomposition technique to separate structural and excitation frequencies from output-only vibration data. The authors concluded that the video-based approaches were robust and efficient in extracting the fundamental frequency from structural and human-induced loadings [13]. The established literature investigating the structural properties of the bridge, however, failed to address the challenge of estimating modal damping. This is addressed in real-time in this paper. To evaluate the structural modal parameters of the bridge, it is important that the spectral characteristics of the measured response reflect the properties of the modes rather than those of the excitation. In output only modal tests, structural responses are captured by one or more reference sensors at fixed positions, or simultaneously with a set of roving sensors, placed at different measurement points along with the structure. This paper presents an enhanced frequency domain decomposition (EFDD), which is implemented in an automated framework, which provides windowed estimates of modal damping using pedestrian excitation on the Daly’s bridge.
Fig. 1Daly’s bridge: general view (from west and looking across north) and position of a wireless accelerometer for the trials
3. Theoretical background of the proposed AE-FDD method
The EFDD theory is based on the typical input/output relationship of a general stationary random process for an MDOF system. For an -degree of freedom system, the equations of motion can be expressed as:
where , and are the mass, stiffness and damping matrices, respectively. Here is the displacement vector and the dots on the vector represent the time derivatives. The force vector is given by . The relationship between unknown inputs and the responses measured in pre-selected windows can be expressed as [25]:
with being the power spectral density (PSD) matrix of the input, , the PSD of the output and is the frequency response function (FRF) matrix. The overbar and the superscript denote the complex conjugate and the transpose, respectively. In the pole-residue partial response form, the FRF can be written as a combination of the pole and residue as:
with ( and being the mode shape vector and the modal participation vector, respectively), Eq. (1) can be re-written, considering broadband Gaussian white noise of intensity [26]:
On expanding the terms of Eq. (3) and applying Heaveside partial fraction theorem, the pole-residue form of the PSD matrix can be obtained as:
The contribution to the residue from the th mode is given by . The scalar constant is given as: . For a typical structural system, at a certain frequency only a limited number of modes will contribute to the kinetic energy, thereby forming a subset of the actual set of frequency, denoted by . For the case of lightly damped structure, the response spectral density can be written as:
The above equation forms the modal decomposition of the spectral matrix. In the proposed AE-FDD method, the first step is to estimate the PSD matrix from the window of measured responses, from which the first singular value gives an estimate of the mode shape. The corresponding singular value is the auto-PSD function of the associated single-degree-of-freedom (SDOF) system. As the SDOF PSD evolves from a window of data that is streamed continuously over a period, an automated real-time implementation is automatically invoked [3, 24]. An estimate of the SDOF correlation function is obtained by projecting the previous subset of the singular values to the time domain, using an inverse fast Fourier transform (IFFT) algorithm [24]. In this automated technique, the remaining parts of the PSD function that lies outside the frequency window are reset to zero. The damping corresponding to each mode in the selected window is estimated from the crossing times and logarithmic decrement of the SDOF autocorrelation function [30].
The importance of carrying out the automated windowing technique can be realized as follows. Consider a typical dynamical system which is excited by arbitrary service loads. In the frequency domain, the modal damping is always overestimated which can bring about unrealistically larger damping ratio estimates. This arises due to the power of the signal leaking out to neighboring frequencies- commonly referred to as spectral leakage and cause modal peaks of the spectral density functions to widen out [29]. As each modal peak obtained from a window corresponds to damping, the ratio will be overestimated. This also arises due to wrong tapering that accounts for incorrect window length and can be resolved by proper window selection, that allows the estimation to continuously evaluate the damping ratio over time. For cases of closely spaced modes (arising due to dominant cable vibrations), the first singular vector will always provide a good estimate of the mode shape of the dominating mode. In cases two modes are orthogonal, the first singular vectors are unbiased estimates of the corresponding mode shape vectors. For non-orthogonal modal entities, the bias on the mode shape estimate of the dominant mode will typically be small but the bias on the estimate of the weak mode will be strong.
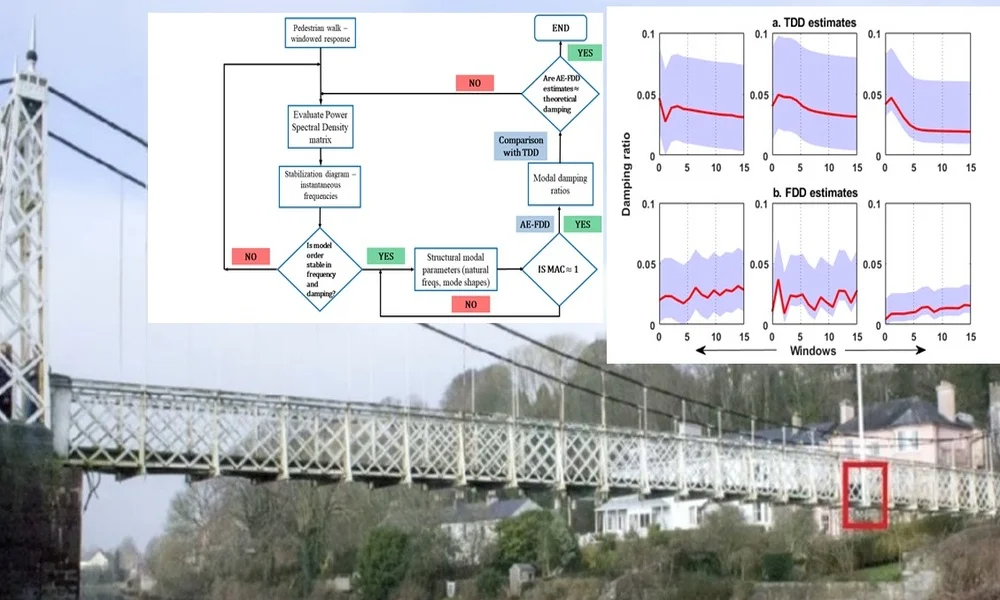
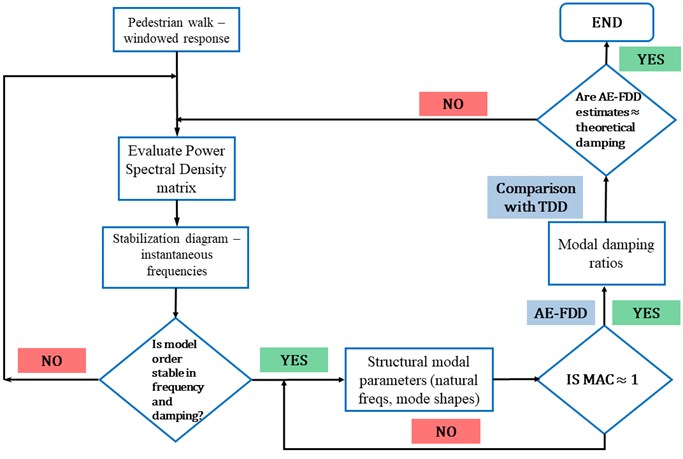
Fig. 2Methodology of the proposed AE-FDD method for automated damping estimates
4. Description of the test setup
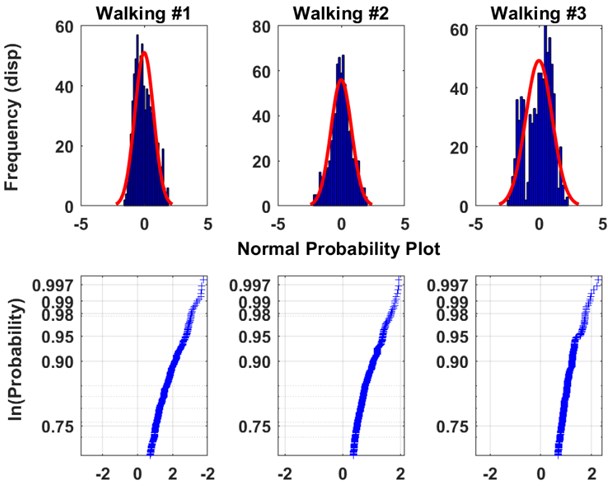
The structural parameters of this transport system are identified using the video analysis of the dynamic deflection under excitation from traversing pedestrians. A wireless sensor network was installed throughout the structure to record the vibration data sampled at 50 Hz, with a range of ±2 g. The video camera positioned at the riverbankaided in visually tracking the video analysis at certain pre-selected nodes, which is shown in Fig. 1. The methodology of the method is illustrated in Fig. 2. Additionally, the placement of one of the wireless accelerometers is shown in the figure. For the present study, the vibration responses were gathered against pre-selected windows. Corresponding to each trial run, the walking data set acquired from the wireless accelerometers are shown in Fig. 3. Visual descriptions of the recorded acceleration do not provide any useful information regarding the modal properties of the structure. Preliminary statistical features of the data (descriptors of Gaussianity and probability plot) are therefore investigated and presented in Fig. 4. The walking dataset #2 is used for subsequent analysis considering its perfectly Gaussian description, as evident from Fig. 4. The structural responses to a pedestrian walking over the bridge is analyzed in pre-selected window length for estimating the modal parameters. Automated windows () of 50 samples stretched over the entire output response is illustrated in Fig. 5. The figure clearly illustrates the progression of samples acquired over windows. Prior to the analysis, it becomes important to investigate the spectral content of the signals determined from the sensors. This has been represented in the form of a stabilization chart in Fig. 6. While the presence of closely spaced modes is evident from the figure, the implementation of an automated approach enables appropriate damping estimation, as explained in the later stages of the draft. To avoid overestimation of the damping ratio, the windows are automated to have same number of samples throughout, which counters the assumed periodicity of spectral estimates within a finite measurement time.
Fig. 3Pedestrian excitation over the bridge as trial runs
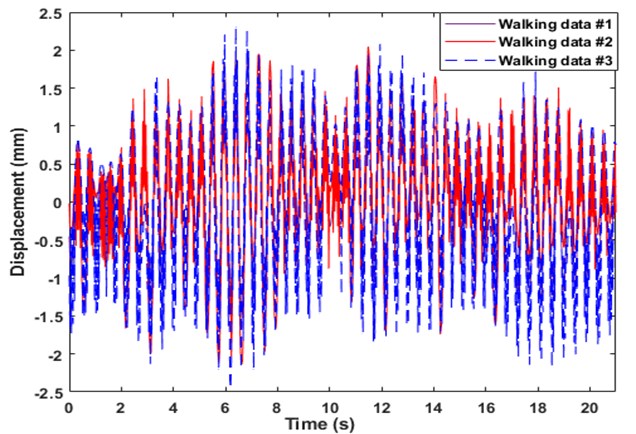
Fig. 4Statistical descriptors of the measured responses
Spurious frequencies arising due to closely spaced modes impair the estimation ability of the proposed AE-FDD method, leading to over estimation of damping ratios. Cases where the first singular value and neighboring values indicate a peak corresponding to a certain frequency manifests the occurrence of a harmonic instead of an actual structural response. To alleviate this ambiguity, the stabilization diagram shown in Fig. 6 clearly indicates the chosen range where the estimate is stable in both frequency and damping. From the figure, frequencies of 1.9 Hz, 2.19 Hz and 2.32 Hz are found to be stable and therefore, designated as the bridge vibratory modes of significance.
Fig. 5Vibration response from Daly’s bridge automated in 15 windows
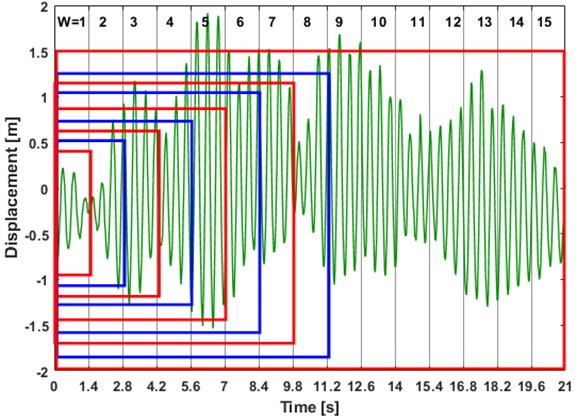
Fig. 6Stabilization diagram indicating the exact frequencies of the bridge
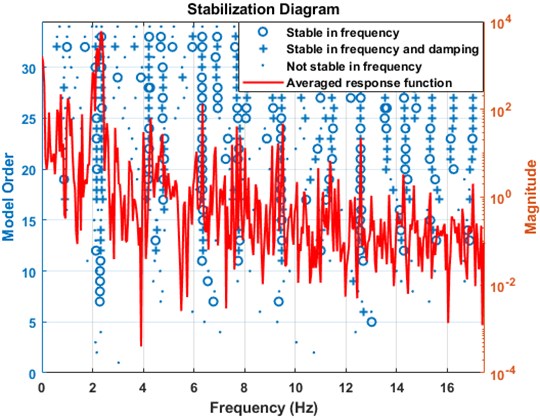
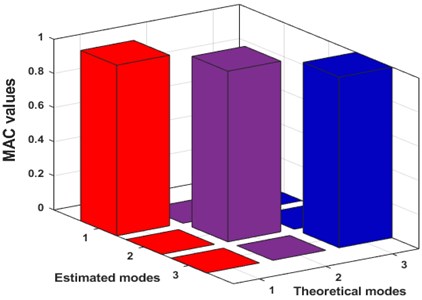
The stabilization diagram is an effective means to manifest the variation in the modal parameters with model order increments. Additionally, the plot eliminates spurious modes and determine the system order, which in practice, is difficult to extract from singular values. The stable natural frequencies are considered to designate the significant modes of vibration of the bridge. The three structural modes corresponding to the natural frequencies are estimated using the proposed AE-FDD approach. For the sake of correctness, the correlation between the estimated and the theoretical modes must be ensured. Towards this, one of the most robust and popular indicators of correctness are provided by the modal assurance criterion (MAC). The MAC values are employed to check the correlation between the linear normal modes (LNMs) and the estimated modes, mathematically described in Eq. (6). The theoretical and estimated th vibration modes are represented by and respectively [3]:
A 3D plot of MAC values for the three modes is presented in Fig. 7. It can be inferred from the figure that the MAC values reach close to unity, which indicates near-perfect correlation between the theoretical and estimated modes, obtained using the proposed method. This indicates that the natural frequencies obtained from stabilization chart are appropriate modal indicators of the bridge verified using a MAC plot and is further considered for damping estimation.
Fig. 73D MAC plot for the extracted modes
The windowed response obtained from the automated system is used to estimate the damping ratios using the TDD approach. Windowed data of 50 samples each are analysed in a real-time framework to provide estimates of damping ratios corresponding to each mode. Theoretical estimations of modal damping ratios indicate a 2 %, 3 % and 2 % damping in the first three modes (rounded to their nearest percentages), respectively. The values shown in Table 1 suggest an overestimation of the damping ratios, using the well-established TDD approach. This happens because the basic assumption of low damping and well-separated modes are violated here. In fact, this method identifies the operational deflection shapes that are the superposition of multiple modes for closely spaced frequencies.
The graphical representation of the evolution of damping ratios over windows can be found in Fig. 8(a). The windowed data is now provided as input to the proposed automated real-time method. The AE-FDD algorithm is designed in MATLABR to provide a user-friendly interface for choosing the number of modes for analysis. To maintain parity, the first three modes of the system are analyzed to provide damping estimates at each window. Damping is estimated from the logarithmic envelope of the correlation function for each window. The instances of overestimation of damping using the established TDD method is evident from the table. In comparison, the AE-FDD method shows discrepancies for higher (torsional) modes, which can be ignored, considering a minimal percentage of contribution in explaining the kinetic energy of the system. As observed from Table 1, using AE-FDD, the average modal discrepancy in damping estimates is evidently lower - thereby indicating its effectiveness over existing TDD based approaches. The evolution of damping estimates for each window using AE-FDD method is graphically illustrated in Fig. 8(b) (indicated in bold). However, it should be realized that an improved damping estimate for higher modes require records of longer duration, where the loading can be in form of repeated trials of a pedestrian walk across the bridge.
Fig. 8Evolution of damping ratios for each mode using: a) TDD and b) AE-FDD
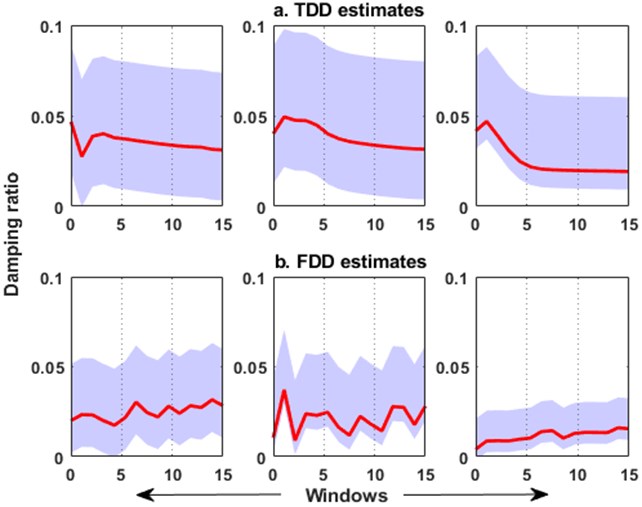
Table 1Estimates of damping ratio for each mode corresponding to automated windows using TDD and proposed AE-FDD
Windows | Modes | ||||||||
Damping ratio | Estimated damping using TDD | Estimated damping using AE-FDD | |||||||
M1 | M2 | M3 | M1 | M2 | M3 | M1 | M2 | M3 | |
1 | 0.05 | 0.05 | 0.04 | 0.04 | 0.04 | 0.04 | 0.02 | 0.02 | 0.02 |
2 | 0.02 | 0.05 | 0.04 | 0.02 | 0.05 | 0.04 | 0.02 | 0.03 | 0.02 |
3 | 0.04 | 0.09 | 0.03 | 0.04 | 0.04 | 0.04 | 0.02 | 0.01 | 0.02 |
4 | 0.03 | 0.03 | 0.02 | 0.04 | 0.04 | 0.03 | 0.02 | 0.02 | 0.02 |
5 | 0.02 | 0.02 | 0.02 | 0.03 | 0.04 | 0.02 | 0.02 | 0.02 | 0.01 |
6 | 0.02 | 0.02 | 0.02 | 0.03 | 0.03 | 0.02 | 0.02 | 0.02 | 0.02 |
7 | 0.01 | 0.02 | 0.01 | 0.03 | 0.03 | 0.02 | 0.02 | 0.02 | 0.01 |
8 | 0.01 | 0.02 | 0.01 | 0.03 | 0.03 | 0.02 | 0.02 | 0.01 | 0.01 |
9 | 0.01 | 0.01 | 0.01 | 0.03 | 0.02 | 0.02 | 0.02 | 0.01 | 0.01 |
10 | 0.01 | 0.02 | 0.01 | 0.03 | 0.03 | 0.02 | 0.02 | 0.02 | 0.01 |
11 | 0.01 | 0.01 | 0.01 | 0.03 | 0.03 | 0.02 | 0.02 | 0.02 | 0.01 |
12 | 0.01 | 0.01 | 0.01 | 0.03 | 0.03 | 0.01 | 0.02 | 0.02 | 0.01 |
13 | 0.02 | 0.02 | 0.02 | 0.03 | 0.03 | 0.02 | 0.02 | 0.02 | 0.02 |
14 | 0.02 | 0.02 | 0.02 | 0.03 | 0.03 | 0.02 | 0.02 | 0.02 | 0.02 |
15 | 0.02 | 0.02 | 0.02 | 0.03 | 0.03 | 0.02 | 0.02 | 0.02 | 0.02 |
Average | 0.02 | 0.03 | 0.02 | 0.03 | 0.04 | 0.03 | 0.02 | 0.03 | 0.02 |
An important consideration related to the damping ratio estimates lie in the resolution of samples adopted during the PSD matrix evaluation. The PSD matrix, computed at each sampled window length, fulfils all the properties required for correct working of the proposed AE-FDD technique, which includes real diagonal terms and complex conjugate off-diagonal entities, thereby leading to a Hermitian matrix. The use of correct sampling resolution in an automated real-time framework directly affects the number of spectral bells that are available prior to the projection into the time domain. Especially with short structural recordings (e.g. acquisitions derived from in service loads, earthquake spectra, etc.), the resolution can be enhanced by increasing the number of samples corresponding to each chosen window. For cases where the enhancement of sampling resolution is unattainable, a zero-excitation time window added at the end of the recordings can increase the duration of the response. The technique, commonly known as ‘zero-padding’ in signal processing sometimes might become instrumental in improving the outcomes for damping estimates, especially when implemented in an automated setup. Additionally, it should be noted that the timescale in which the proposed method correctly identifies the structural modal properties is not expected to show any significant changes in temperature conditions. Rather, the changes in the data acquisition patterns will be evident if these estimates are carried out intermittently over a period of significant diurnal and seasonal variations.
5. Conclusions
In this paper, a new method for estimating structural damping for a transport system, AE-FDD, has been introduced. The technique uses an automated approach for estimating damping ratios corresponding to each mode, thereby invoking a real-time framework. The method is based on decomposing the PSD function matrix into its spectral components, where individual SDOF systems correspond to each mode. The modal parameters are identified by fitting an SDOF model to the singular values in a user-defined frequency band around the peak. In addition to this, automated real-time damping estimates can be obtained by projecting the previous subset of the singular values to the time domain, using an IFFT algorithm. Logarithmic decrement technique is subsequently applied to get estimates of the damping ratio corresponding to each mode in an automated setup. Through the integration of SHM into transportation systems, the reliability and operational functionality of built infrastructure, especially bridges, can be assessed in real-time. As automated SHM is a feasible prospect in full-scale transport systems, the proposed technique is applied on the vibration data gathered from a pedestrian walk over Ireland’s Daly’s ‘Shaky’ bridge. The study concludes that the AE-FDD technique provides near-accurate estimates of modal damping for the structure-thereby portraying its robustness and efficacy for implementation in real world applications.
References
-
Neves A. C., González I., Leander J., Karoumi R. Structural health monitoring of bridges: a model-free ANN-based approach to damage detection. Journal of Civil Structural Health Monitoring, Vol. 7, Issue 5, 2017, p. 689-702.
-
Comisu C. C., Taranu N., Boaca G., Scutaru M. C. Structural health monitoring system of bridges. Procedia Engineering, Vol. 199, 2017, p. 2054-2059.
-
O’donnell D., Murphy J., Pakrashi V. Damage monitoring of a catenary moored spar platform for renewable energy devices. Energies, Vol. 13, Issue 14, 2020, p. 3631.
-
Krishnan M., Bhowmik B., Hazra B., Pakrashi V. Real-time damage detection using recursive principal components and time varying auto-regressive modeling. Mechanical Systems and Signal Processing, Vol. 101, 2018, p. 549-574.
-
Dasyam N. Structural Health Monitoring Market by Component (Hardware, Software, and Services), Connectivity (Wired and Wireless), and End User (Civil, Aerospace, Defense, Energy, and Others): Global Opportunity Analysis and Industry Forecast, 2017-2023. Report, 2017, https://www.alliedmarketresearch.com/structural-health-monitoring-market.
-
Cho S., Jo H., Jang S., Park J., Jung H. J., Yun C. B., Spencer Jr B. F., Seo J. W. Structural health monitoring of a cable-stayed bridge using wireless smart sensor technology: data analyses. Smart Structures and Systems, Vol. 6, Issues 5-6, 2010, p. 461-480.
-
Hazra B., Sadhu A., Roffel A. J., Narasimhan S. Hybrid time‐frequency blind source separation towards ambient system identification of structures. Computer‐Aided Civil and Infrastructure Engineering, Vol. 27, Issue 5, 2012, p. 314-332.
-
Bhowmik B., Krishnan M., Hazra B., Pakrashi V. Real-time unified single-and multi-channel structural damage detection using recursive singular spectrum analysis. Structural Health Monitoring, Vol. 18, Issue 2, 2019, p. 563-589.
-
Znidaric A., Pakrashi V., Obrien E. J. A review of road structure data in six European countries. Proceedings of the Institution of Civil Engineers – Urban Design and Planning, Vol. 164, Issue 4, 2011, p. 225-232.
-
Pakrashi V., Kelly J., Ghosh B. Sustainable prioritisation of bridge rehabilitation comparing road user cost. Transportation Research Board Annual Meeting, 2011.
-
Weninger Vycudil A., Hanley C., Deix S., O'connor A., Pakrashi V. Cross-asset management for road infrastructure networks. Proceedings of the Institution of Civil Engineers-Transport, Vol. 168, Issue 5, 2015, p. 442-456.
-
O’Byrne M., Ghosh B., Schoefs F., O’Donnell D., Wright R., Pakrashi V. Acquisition and analysis of dynamic responses of a historic pedestrian bridge using video image processing. Journal of Physics: Conference Series, Vol. 628, Issue 1, 2015, p. 012053.
-
O’Donnell D., Wright R., O’Byrne M., Cahill P., Pakrashi V. Modelling and testing of a historic steel suspension footbridge in Ireland. Proceedings of the Institution of Civil Engineers – Bridge Engineering, Vol. 170, Issue 2, 2017, p. 116-132.
-
Farrar C. R., James III G. H. System identification from ambient vibration measurements on a bridge. Journal of Sound and Vibration, Vol. 205, Issue 1, 1997, p. 1-18.
-
Salawu Olusegun S., Williams C. Bridge assessment using forced-vibration testing. ASCE Journal of Structural Engineering, Vol. 121, Issue 2, 1995, p. 161-173.
-
Yi T., Li H., Gu M. Full-scale measurements of dynamic response of suspension bridge subjected to environmental loads using GPS technology. Science China Technological Sciences, Vol. 53, Issue 2, 2010, p. 469-479.
-
Nassif H. H., Gindy M., Davis J. Comparison of laser Doppler vibrometer with contact sensors for monitoring bridge deflection and vibration. NDT&E International, Vol. 38, Issue 3, 2005, p. 213-218.
-
Fletcher M. S., Parker J. S. Dynamics of the Hungerford Millennium footbridges, UK. Proceedings of the Institution of Civil Engineers-Bridge Engineering, Vol. 156, Issue 2, 2003, p. 57-62.
-
Siringoringo D. M., Fujino Y. System identification of suspension bridge from ambient vibration response. Engineering Structures, Vol. 30, Issue 2, 2008, p. 462-477.
-
Pakrashi V., Harkin J., Kelly J. Monitoring and repair of an impact damaged prestressed bridge. Proceedings of the Institution of Civil Engineers – Bridge Engineering, Vol. 166, Issue 1, 2013, p. 16-29.
-
González A., Obrien E. J., McGetrick P. J. Identification of damping in a bridge using a moving instrumented vehicle. Journal of Sound and Vibration, Vol. 331, Issue 18, 2012, p. 4115-4131.
-
Brownjohn J. Estimation of damping in suspension bridges. Proceedings of the Institution of Civil Engineers: Structures and Buildings, 1994.
-
Bhowmik B., Tripura T., Hazra B., Pakrashi, V. First-order eigen-perturbation techniques for real-time damage detection of vibrating systems: theory and applications. Applied Mechanics Reviews, Vol. 71, Issue. 6, 2019, p. 060801.
-
Jacobsen N. J., Andersen P., Brincker R. Using enhanced frequency domain decomposition as a robust technique to harmonic excitation in operational modal analysis. Proceedings of ISMA2006: International Conference on Noise and Vibration Engineering, 2006.
-
Brincker R., Zhang L., February Andersen P. Modal identification from ambient responses using frequency domain decomposition. Proceedings of the 18th International Modal Analysis Conference (IMAC), 2000.
-
Brincker R., Zhang L., Andersen P. Modal identification of output-only systems using frequency domain decomposition. Smart Materials and Structures, Vol. 10, Issue. 3, 2001, p. 441.
-
Lamarque C. H., Pernot S., Cuer A. Damping identification in multi-degree-of-freedom systems via a wavelet-logarithmic decrement – Part 1: Theory. Journal of Sound and Vibration, Vol. 235, Issue 3, 2000, p. 361-374.
-
Gutenbrunner G., Savov K., Wenzel H. Sensitivity studies on damping estimation. Proceedings of the 2nd International Conference on Experimental Vibration Analysis for Civil Engineering Structures, 2007.
-
Sevim B., Bayraktar A., Altunişik A. C., Adanur S., Akköse M. Modal parameter identification of a prototype arch dam using enhanced frequency domain decomposition and stochastic subspace identification techniques. Journal of Testing and Evaluation, Vol. 38, Issue 5, 2010, p. 588-597.
-
Yamaguchi H., Nagahawatta H. D. Damping effects of cable cross ties in cable-stayed bridges. Journal of Wind Engineering and Industrial Aerodynamics, Vol. 54, 1995, p. 35-43.
-
Cheynet E. Automated Frequency Domain Decomposition (AFDD). MATLAB Central File Exchange, 2020, https://www.mathworks.com/matlabcentral/fileexchange/57153-automated-frequency-domain-decomposition-afdd.
Cited by
About this article

The authors acknowledge Deirdre O'Donnell and Robert Wright for contribution to instrumentation campaign of the original bridge. We acknowledge the Science Foundation Ireland (SFI) Marine and Renewable Energy Ireland (MaREI) Center and the EU-funded SIRMA (Strengthening Infrastructure Risk Management in the Atlantic Area) project (Grant No. EAPA\_826/2018). Basuraj Bhowmik also acknowledges the SEAI-funded WindPearl project (RDD/00263).
