Abstract
The mill vibration signals collected during mill operation are often affected by complex working conditions and various disturbances, thus presenting strong non-stationary characteristics. After the vibration signal is processed by noise reduction, although the noise interference and modal aliasing phenomenon are solved, the extracted vibration signal of the rolling mill still has the problems of strong non-stationarity, high complexity, and great difficulty in analyzing, which largely affects the prediction model construction. To address the above problems, this study proposes a multi-scale signal reconstruction method based on Fuzzy Entropy and Gath-Geva fuzzy clustering algorithm, which effectively reduces the complexity of the original sequence, reduces the number of predictive modellings, and improves the signal predictability and prediction accuracy. The sequence reconstruction of such non-stationary vibration signals based on their internal characteristics has obvious advantages for the problem of mill vibration prediction and analysis.
Highlights
- The paper proposes a multi-scale signal reconstruction method based on the fusion of fuzzy clustering algorithm and GG clustering algorithm, which effectively reduces the complexity of the original data and improves the predictability and prediction accuracy of the signal.
- The collected discrete signal is effectively restored to the original time-domain signal by the reconstruction method, which ensures the reliability of the signal.
- The signal reconstruction method proposed in this paper has greatly improved the accuracy of subsequent vibration signal prediction models.
1. Introduction
The mill vibration problem seriously restricts the product quality of plate and strip, the vibration signal collected by using the measuring device often has strong non-stationarity, increasing the difficulty of analysis, which greatly affects the construction of the vibration signal prediction model. In recent years, scholars have conducted a lot of research on vibration signal analysis and feature extraction. Literature [1] uses EMD to extract the IMF components from the measured signals of the rolling mill during steel biting and throwing, and performs the Hilbert transform on the IMF components to obtain the transient time-frequency characteristics of the signals. Literature [2] used the smooth pseudo wigner-ville distribution and empirical modal decomposition for the time-frequency analysis of vibration signals, and found the reasons affecting the vibration of the rolling mill. Literature [3] used the Hilbert-Yellow transform and its corresponding marginal spectrum for vibration signal analysis and fault diagnosis of rolling bearings, and identified the failure modes. Literature [4] carried out fault diagnosis on automatic tilting device bearings, and the fault type discrimination was carried out by extracting the fault eigenfrequency of the local Hilbert marginal spectrum.
In previous studies, the acquired vibration signals are only processed for noise reduction without noticing that the vibration signals are discrete, which reduces the impact of data non-stationarity on the model accuracy but leads to excessive model construction and cumbersome parameter tuning, which interferes with the subsequent signal analysis. The role of signal reconstruction is to convert the discrete-time signals into continuous-time signals in order to facilitate the restoration of the original signal characteristics and information.
The main contributions of this paper include:
1) This paper proposes a multi-scale signal reconstruction method, which effectively reduces the complexity of the original data and improves the predictability and prediction accuracy of the signal.
2) The collected discrete signal is effectively restored to the original time-domain signal by the reconstruction method, which ensures the reliability of the signal.
2. Data collection and processing
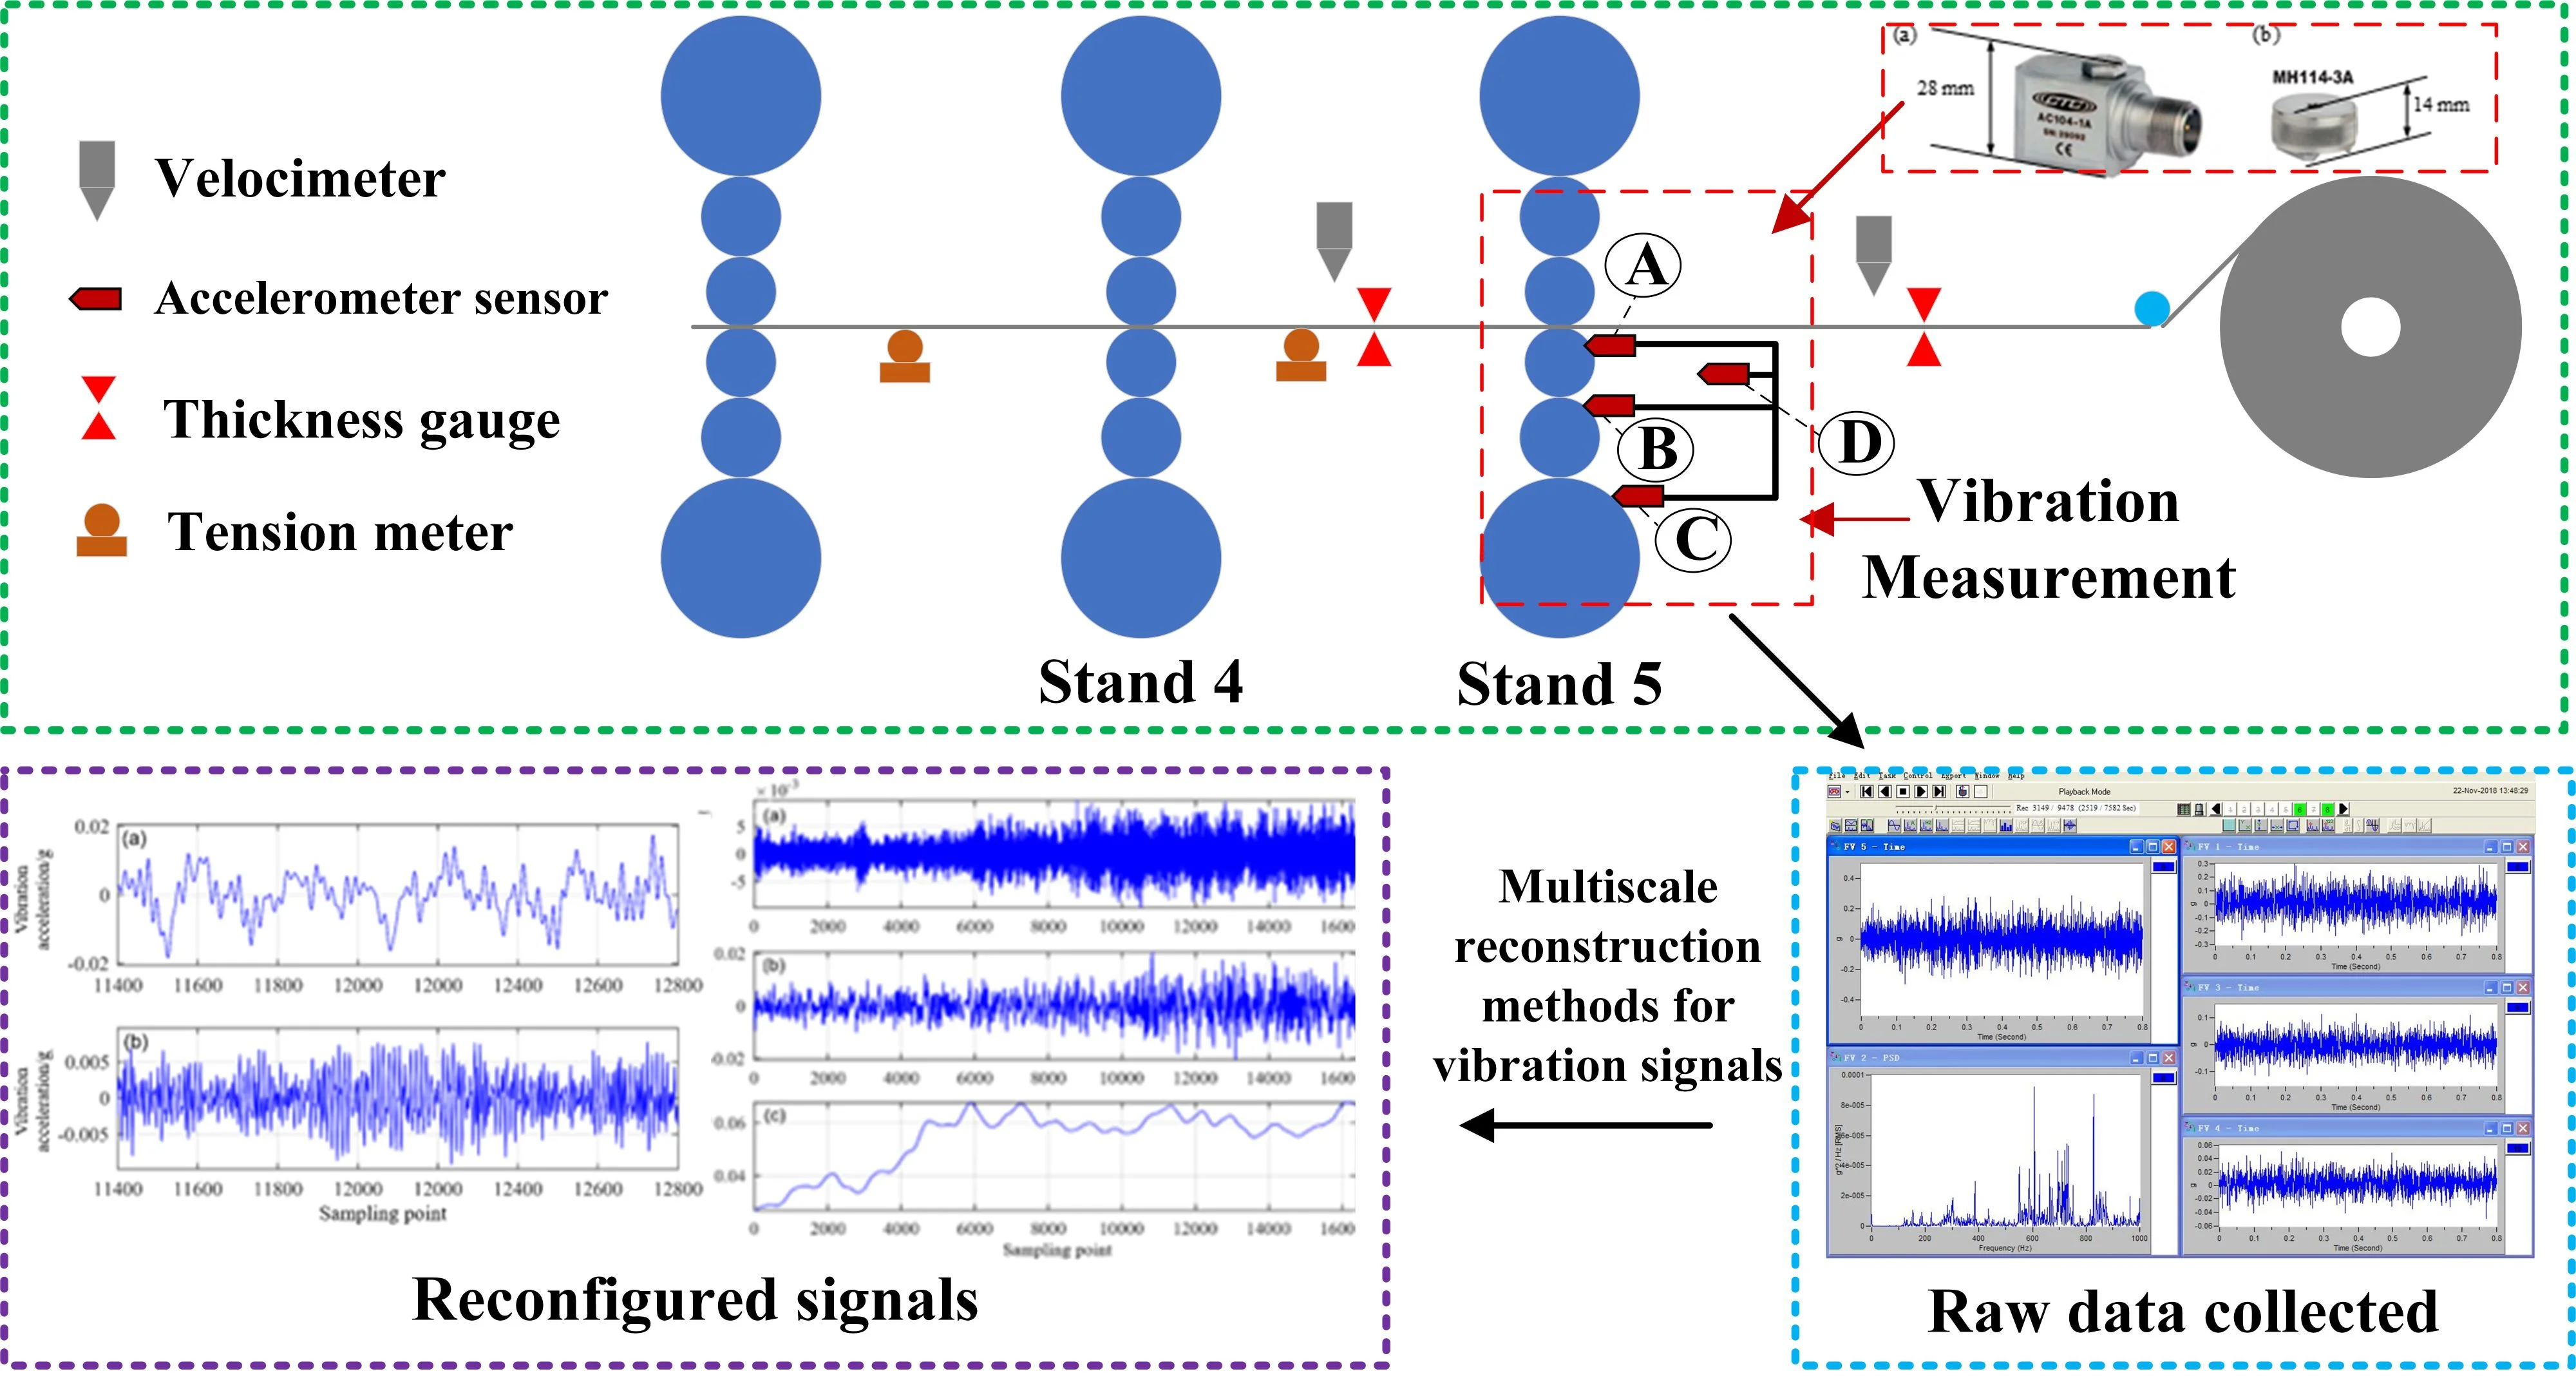
During the cold rolling process, the vibration of the rolling mill in the vertical direction is more obvious than the vibration in other directions. Therefore, this study mainly collects the vertical vibration acceleration signal of the rolling mill. This article uses the AC104-1A vibration sensor from the American CTC company, as shown in Fig. 1. The configuration parameters for the acceleration sensor are shown in Table 1.
Fig. 1AC104-1A vibration sensor vibration acceleration sensor and magnetic base
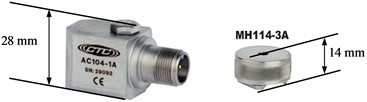
Fig. 2Sketch of the mill vibration data acquisition system
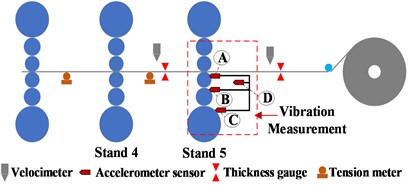
Table 1Parameters of AC104-1A vibration sensor
Parameter | Accuracy / (mV/g) | Frequency range / Hz | Effective range /g | Range of working temperature / ℃ |
Value | 100 | 0-10000 | ±50 | –50-121 |
The data collected were vibration signals from the fifth stand of a six-high rolling mill at a 1450 cold rolling mill in China. When installing the vibration sensor, take into account the size of the vibration sensor itself and the roll gap between the upper and lower work rolls. Therefore, as shown in Fig. 2, the vibration acceleration sensors are installed at four different positions A, B, C, and D. Position A is the vertical direction of the bearing seat on the operating side of the lower work roll; Position B is the vertical direction of the bearing seat on the operating side of the lower intermediate roller; Position C is the vertical direction of the bearing seat on the operating side of the lower support roller; Position D is the operating side frame.
Since the data collected by the testing equipment has a certain amount of noise, the data is first subjected to wavelet noise reduction when the follow-up work is carried out.
3. A multi-scale reconstruction method for rolling mill vibration signals
Seasonal-trend decomposition procedure based on loess (STL) decomposes non-smooth mill vibration signal into trend, seasonality, and stochastic components using locally weighted regression, capturing nonlinear trends and seasonality in time series:
where: represents the trend information of the non-stationary vibration signal, represents the period characteristics of the sequence, represents the random component of the sequence.
Adaptive signal decomposition methods based on the characteristics of the signal itself can decompose a nonlinear and non-smooth signal into a set of intrinsic modal functions shaped like:
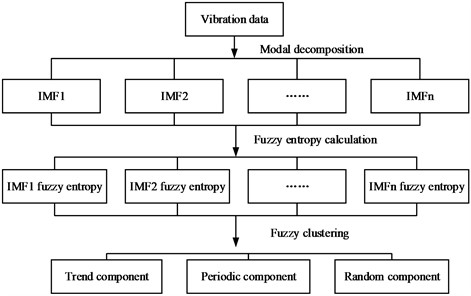
In this study, a data reconstruction method combining the fuzzy entropy clustering algorithm (FE) with the Gath-Geva (GG) clustering algorithm is proposed. The vibration signal multiscale reconstruction algorithm flow is shown in Fig. 3, the specific steps:
(1) Based on wavelet decomposition theory, the vibration signal is modally decomposed to obtain IMF components.
(2) Calculate the fuzzy entropy of each IMF separately, denoted as FE1, FE2, …FEk, and use the fuzzy entropy value to quantitatively evaluate the complexity of this modal vector.
(3) Set the number of clusters as 3, initialize the affiliation matrix , and iterate over the clustering centers.
(4) Calculate the covariance matrix of each class and obtain the distance between the samples and the clustering centers based on this covariance matrix.
(5) Update the affiliation matrix , and if the distance between the affiliation matrix before updating and the affiliation matrix obtained after updating is greater than a certain fixed termination tolerance ε, then go back to step (3) to continue the iteration until the loop stops.
(6) Merge and reconstruct the IMF components near each clustering center respectively and reconstruct the original time series into the form of trend-periodic-random series.
Fig. 3Framework of signal reconstruction method based on fuzzy entropy and fuzzy clustering
4. Analysis and discussion of experimental results
The study verifies the signal multiscale reconstruction method using vibration signals from the accelerated rolling stage. 16 IMFs are decomposed for noise reduction, and fuzzy entropy is calculated for each IMF. Parameter settings: embedding dimension = 3, similarity tolerance 0.2 ( is standard deviation of modal components). Calculation results shown in Fig. 4.
Fig. 4IMF fuzzy entropy change curve figure
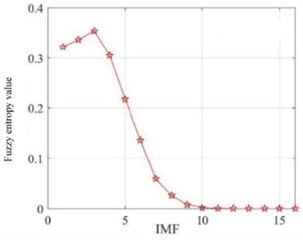
Fig. 5Clustering results of random period and trend components
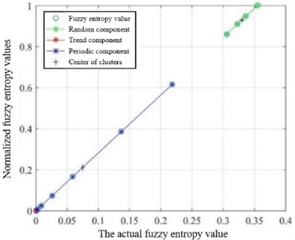
In order to verify the rationality of GG clustering algorithm, FCM clustering algorithm and Gustafson-Kessell (GK) clustering algorithm are selected to compare the performance with GG clustering algorithm in this chapter. The number of clustering centers with the same parameters is chosen to be 3, the iteration termination tolerance 10-6, and the weighting index is 2 for the clustering analysis of fuzzy entropy. The partition coefficient (PE) and categorical entropy (CE) are used as evaluation indexes:
where, represents the degree of affiliation of the -th class of the sample . The larger the PE value the smaller the CE value represents the better clustering effect of the algorithm. Three fuzzy clustering algorithms evaluation indexes are shown in Table 2.
Table 2Evaluation indicators of three clustering algorithms
Performance indicators | Clustering method | ||
FCM | GK | GG | |
PE | 0.9386 | 0.9491 | 0.9956 |
CE | 0.1305 | 0.1215 | NaN |
From the evaluation indexes in Table 2, it can be seen that all the performance indexes of GG fuzzy clustering algorithm are better than the other two algorithms, therefore, it is more reasonable to choose GG fuzzy clustering as the reconstruction algorithm in this paper. The clustering results are shown in Fig. 5, where the green, blue and red lines represent the clustering results of the random, periodic and trend components, respectively. The reconstructed and merged IMFs contained in the three components respectively obtained the final results as shown in Table 3.
Table 3IMF range included in each component
Component properties | Random component | Periodic component | Trend component |
IMF scope | IMF1-IMF4 | IMF5-IMF10 | IMF11-IMF16 |
Fig. 6 represents the decomposition result plots of random, cyclic and trend components respectively, taking 1400 sampling points to zoom in on the cyclic and trend components as shown in Fig. 7(a) for zooming in on the cyclic component to show the hidden cyclic pattern of the original time series, and repeating variations of the cycle at intervals of 400 sampling points as shown in Fig. 7(b) to show more clearly the random component fluctuations. From the above results to a large extent, it preserves the information characteristics and reduces the number of patterns to be analysed.
In order to verify the effectiveness of the FE-GG time series reconstruction algorithm proposed in this chapter and the modelling optimization ability of the model, this paper intends to use the traditional LSTM model to model the reconstructed signals and the original signals for training and to compare the prediction effect of the model.
The dataset will be divided into training set, validation set and test set according to the ratio of 6:2:2, and five-step prediction will be performed using the same network structure. The time window length is 50, early-stopping is 20 steps, adaptive learning rate, and the number of batches are 256, respectively. The final prediction results are obtained as shown in Table 4.
Overall, the prediction accuracies of both the original and reconstructed signals decrease with increasing prediction time step. There is a significant difference in the prediction accuracy of the two signals as the step length increases. The RMSE of the reconstructed signal prediction model after the FE-GG model in the fifth step is 1.27, the MAE is 0.99, the MAPE is 1.63, and the R2 is 0.96, which is significantly better than the accuracy of the original signal prediction model. In terms of accuracy decay, the predictive accuracy of the reconstructed signal prediction model from the first step to the fifth step is at a high level, with R2 only decreasing from 0.98 to 0.96, and the change of RMSE and other indexes is small.
Fig. 6Time domain plot of random periodic trend components of vibration signals
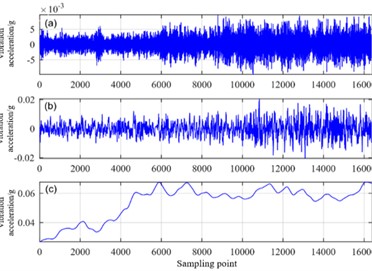
Fig. 7Local enlarged images of random and periodic components
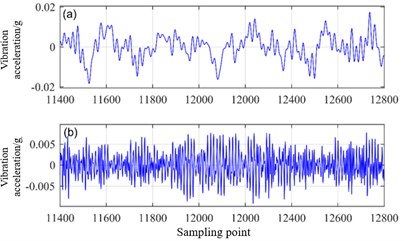
Table 4Evaluation indicators for raw and reconstructed signals under different prediction steps
Datasets | Original Signal Data | Reconstructed signal data | ||||||||
Predicted step length | 1 | 2 | 3 | 4 | 5 | 1 | 2 | 3 | 4 | 5 |
RMSE (10-3) | 1.13 | 1.44 | 2.41 | 3.83 | 5.29 | 1.13 | 1.14 | 1.15 | 1.24 | 1.27 |
MAE (10-3) | 0.83 | 1.14 | 1.95 | 3.09 | 4.26 | 0.88 | 0.89 | 0.91 | 0.96 | 0.99 |
MAPE | 1.34 | 1.90 | 3.30 | 5.31 | 7.41 | 1.44 | 1.48 | 1.56 | 1.57 | 1.63 |
R2 | 0.97 | 0.96 | 0.89 | 0.69 | 0.33 | 0.98 | 0.97 | 0.97 | 0.97 | 0.96 |
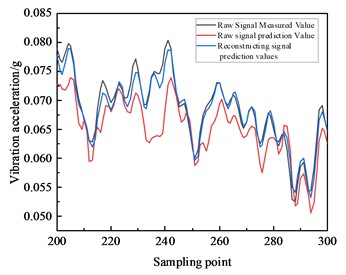
As shown in Fig. 8, the line graph of the prediction results of the fifth step is plotted. The predicted values of the signal prediction model reconstructed after decomposition and clustering are closer to the actual values than the original signal prediction model, and the prediction results are better. The effectiveness of the FE-GG time series reconstruction algorithm is verified by the above experimental analysis.
Fig. 8Line chart of the prediction results of the fifth step
5. Conclusions
Aiming at the problem that the vibration signals of rolling mills are highly non-stationary and it is difficult to predict and analysed the time series of vibration signals directly, this study proposes a method for reconstructing the vibration signals of rolling mills based on fuzzy entropy and GG clustering algorithm.
1) The random-periodic-trend component of the vibration signal is finally obtained by the fuzzy entropy calculation and clustering analysis of the IMF. The results show the feasibility of utilizing fuzzy entropy to represent the complexity of IMF alone. In the process of clustering analysis of fuzzy entropy values, the GG fuzzy clustering algorithm reflects a better performance compared with FCM clustering and GK fuzzy clustering.
2) The original and reconstructed signals are respectively predicted using LSTM, and the vibration signals reconstructed after the time series are predicted with higher accuracy of above 96 %, which still maintains high accuracy in multi-step prediction, and avoids the problem of modelling for each IMF, which realizes the decomposition and prediction analysis of complex vibration sequences.
References
-
Z. Meng, B. Liu, and P. M. Shi, “Time-frequency analysis for rolling mills transient vibration signal based on EMD and HT,” Journal of Yanshan University, Vol. 2, p. 110, 2008.
-
Y. Zang, X. B. Fan, and H. G. Wang, “Vibration analysis of based on signal-frequency characteristics,” Journal of Vibration, Measurement &. Diagnosis, Vol. 31, p. 642, 2011, https://doi.org/10.16450/j.cnki.issn.1004-6801.2011.05.002
-
H. Li, Y. Zhang, and H. Zheng, “Hilbert-Huang transform and marginal spectrum for detection and diagnosis of localized defects in roller bearings,” Journal of Mechanical Science and Technology, Vol. 23, No. 2, pp. 291–301, Apr. 2010, https://doi.org/10.1007/s12206-008-1110-5
-
X. H. Zhang, Z. W. Yuan, and X. M. Li, “Fault diagnosis method of swash-plate bearing based on MED and marginal spectrum.,” Measurement and Control Technology, Vol. 39, No. 12, pp. 116–120, 2020, https://doi.org/10.19708/j.ckjs.2020.07.280
-
K. Peng, K. Zhang, B. You, and J. Dong, “Quality-related prediction and monitoring of multi-mode processes using multiple PLS with application to an industrial hot strip mill,” Neurocomputing, Vol. 168, pp. 1094–1103, Nov. 2015, https://doi.org/10.1016/j.neucom.2015.05.014
-
X. Lu, J. Sun, G. Li, Z. Wang, and D. Zhang, “Stability analysis of a nonlinear coupled vibration model in a tandem cold rolling mill,” Shock and Vibration, Vol. 2019, pp. 1–14, Feb. 2019, https://doi.org/10.1155/2019/4358631
-
X. Lu, J. Sun, G. Li, Q. Wang, and D. Zhang, “Dynamic analysis of vibration stability in tandem cold rolling mill,” Journal of Materials Processing Technology, Vol. 272, pp. 47–57, Oct. 2019, https://doi.org/10.1016/j.jmatprotec.2019.05.001
-
X. Lu et al., “Prediction and analysis of cold rolling mill vibration based on a data-driven method,” Applied Soft Computing, Vol. 96, p. 106706, Nov. 2020, https://doi.org/10.1016/j.asoc.2020.106706
About this article

This work was supported by the National Natural Science Foundation of China (Grant Nos. U21A20117 and 52074085), the Fundamental Research Funds for the Central Universities (Grant No. N2004010), and the LiaoNing Applied Basic Research Program Project (2022JH2/101300008).
The datasets generated during and/or analyzed during the current study are available from the corresponding author on reasonable request.
The authors declare that they have no conflict of interest.
